

Abstract
Neuronal calcium loading attributable to hypoxic/ischemic injury is believed to trigger neurotoxicity. We examined in organotypic hippocampal slice cultures whether artificially and reversibly enhancing the Ca2+ buffering capacity of neurons reduces the neurotoxic sequelae of oxygen–glucose deprivation (OGD), whether such manipulation has neurotoxic potential, and whether the mechanism underlying these effects is pre- or postsynaptic. Neurodegeneration caused over 24 hr by 60 min of OGD was triggered largely by NMDA receptor activation and was attenuated temporarily by pretreating the slices with cell-permeant Ca2+ buffers such as 1,2 bis(2-aminophenoxy)ethane-N,N,N′,N′-tetra-acetic acid acetoxymethyl ester (BAPTA-AM). This pretreatment produced a transient, reversible increase in intracellular buffer content as demonstrated autoradiographically using slices loaded with 14C-BAPTA-AM and by confocal imaging of slices loaded with the BAPTA-AM analog calcium green-acetoxymethyl ester (AM). The time courses of14C-BAPTA retention and of neuronal survival after OGD were identical, indicating that increased buffer content is necessary for the observed protective effect. Protection by Ca2+buffering originated presynaptically because BAPTA-AM was ineffective when endogenous transmitter release was bypassed by directly applying NMDA to the cultures, and because pretreatment with the low Ca2+ affinity buffer 2-aminophenol-N,N,O-triacetic acid acetoxymethyl ester, which attenuates excitatory transmitter release, attenuated neurodegeneration. Thus, in cultured hippocampal slices, enhancing neuronal Ca2+ buffering unequivocally attenuates or delays the onset of anoxic neurodegeneration, likely by attenuating the synaptic release of endogenous excitatory neurotransmitters (excitotoxicity).
- calcium
- cell death
- anoxia
- calcium buffers
- neurotoxicity
- organotypic cultures
- hippocampal neurons
- BAPTA
- oxygen–glucose deprivation
- presynaptic mechanisms
Does increasing the ability of neurons to buffer calcium loads give them increased resilience to hypoxic/ischemic insults? This hypothesis is attractive because excessive Ca2+ loading has been shown repeatedly to trigger neurodegeneration (for review, see Choi, 1988; Ghosh and Greenberg, 1995; Tymianski, 1996; Tymianski and Tator, 1996). Because most (>95%) Ca2+ ions that enter cells under physiological conditions are buffered by endogenous mechanisms (Blaustein, 1988;Neher and Augustine, 1992; Zhou and Neher, 1993), it is intuitive to assume that Ca2+ buffering ability may be related to neuronal vulnerability. However, the Ca2+ buffering machinery of neurons has been difficult to manipulate in order to experimentally test this hypothesis. Although immobile Ca2+buffering sites such as mitochondria can be manipulated pharmacologically (Werth and Thayer, 1994; White and Reynolds, 1995;Budd and Nicholls, 1996a; Schindler et al., 1996), the mobile buffering component, composed primarily of Ca2+-binding proteins, cannot. Thus, most studies of relationships between endogenous mobile Ca2+ buffer content and neuronal survivability have been correlative in nature. Opinions arising from these are divided on whether Ca2+ buffers are beneficial against injury. For example, neurons expressing calbindin-D28K or parvalbumin may be more resistant to damage produced by excitatory amino acids (EAAs) and other toxins in vitro (Scharfman and Schwartzkroin, 1989; Mattson et al., 1991; Lukas and Jones, 1994; Diop et al., 1995; Pike and Cotman, 1995) and ischemic damage in vivo (Nitsch et al., 1989; Rami et al., 1992; Goodman et al., 1993). However, some studies refute this or fail to show such correlations (Freund et al., 1990; Weiss et al., 1990; Freund and Magloczky, 1993; Mockel and Fischer, 1994; Tortosa and Ferrer, 1994).
Recently, it has been possible to manipulate intracellular calcium-binding proteins directly. Lledo et al. (1992) transfected GH3 cells with calbindin-D28K, which attenuated Ca2+ currents and depolarization-evoked elevations in intracellular cytosolic Ca2+ concentration ([Ca2+]i) transients. Chard et al. (1993)directly injected calbindin and parvalbumin into neurons via patch pipettes, which attenuated [Ca2+]i increases in the cells. However, such experiments have not yet shown whether calcium-binding proteins subserve a neuroprotective function. A simpler alternative to manipulating endogenous Ca2+ buffers is to use synthetic, exogenous Ca2+ chelators (Tsien, 1980). The advantages over using Ca2+ binding proteins include a nondisruptive means to introduce the buffers into cells (Tsien, 1981), predictable Ca2+ buffering properties, and the potential for reversing their physiological actions through inactivation and/or cellular extrusion (Ouanounou et al., 1996). The physiological effects of exogenous buffers are well characterized, including their presynaptic effects on attenuating neurotransmitter release (Adler et al., 1991; Niesen et al., 1991; Fredholm and Hu, 1993; Roberts, 1993;Robitaille et al., 1993; Winslow et al., 1994; Ouanounou et al., 1996;Spigelman et al., 1996), postsynaptic effects on neuronal membrane excitability (Marty and Neher, 1985; Lancaster and Nicoll, 1987; Kohr and Mody, 1991; Schwindt et al., 1992; Zhang et al., 1995), and Ca2+ homeostasis (Neher, 1986; Neher and Augustine, 1992;Zhou and Neher, 1993; Tymianski et al., 1994a).
The utility of exogenous Ca2+ buffers as neuroprotectants against EAA excess has been examined previously, although with varying conclusions (Tymianski et al., 1993c, 1994a; but see Baimbridge and Abdel-Hamid, 1992; Dubinsky, 1993; Abdel-Hamid, 1994). However, their effects against anoxic neuronal injury have never been systematically explored, despite the fact that synaptic overactivity, which is attenuated by these compounds (see references above), is believed to be an etiological factor in anoxia (Kass and Lipton, 1982; Rothman, 1983,1984). Also, although the many physiological effects of Ca2+ buffers on both presynaptic and postsynaptic Ca2+-dependent processes are described (see references above), the effects specifically responsible for their neuroprotective properties have not been established.
Therefore, we studied for the first time the effects of Ca2+ buffering on anoxic neurodegeneration. We examined whether artificially and reversibly enhancing the Ca2+buffering capacity of neurons reduces the neurotoxic sequelae of oxygen–glucose deprivation (OGD), whether such manipulation has neurotoxic potential, and whether the mechanism underlying these effects is pre- or postsynaptic. We show unequivocally, using novel means, that neuroprotection in organotypic hippocampal slice cultures parallels exactly alterations in Ca2+ buffer content, that in select circumstances cell-permeant Ca2+ buffers also have neurotoxic potential, and that the site of neuroprotective actions of exogenous buffers is presynaptic, indicating that neuroprotection is achieved chiefly by attenuation of excitatory neurotransmitter release.
MATERIALS AND METHODS
Preparation of organotypic cultures. Organotypic hippocampal slice cultures were prepared according to the method ofStoppini et al. (1991) with minor modifications. Briefly, 7 d postnatal Wistar rat pups were anesthetized (50 mg/kg ketamine, i.p.), decapitated, and the hippocampi were removed and incubated (5 min) in ice-cold HBSS supplemented with d-glucose (to 6.5 mg/ml) and 20 mm HEPES acid/HEPES sodium salt, pH 7.2. Transverse hippocampal slices (400 μm) were obtained, replaced in ice-cold HBSS (15–20 min), and transferred to 30 mm Millicel-CM 0.4 μm tissue culture plate inserts (Millipore, Bedford, MA). These were placed in 6-well tissue culture plates (Corning Costar, Oneonta, NY) containing 1 ml of culture medium (CM) consisting of: 50% MEM, 25% horse serum, 25% Earl’s balanced salt solution supplemented withd-glucose and HEPES similar to the HBSS. HBSS and CM contained penicillin G and streptomycin sulfate (5.0 units/ml and 5 μg/ml, respectively). The slices were maintained at 36.5°C, 100% humidity, and 95% air/5% CO2 atmosphere and fed twice weekly. All solutions, antibiotics, and media were obtained from Life Technologies (Grand Island, NY).
Drugs and solutions. Culture and dissection media were as above. Balanced salt solution (BSS) contained (in mm): 125 NaCl, 5 KCl, 1.2 NaH2PO4, 26 NaHCO3, 1.8 CaCl2, 0.9 MgCl2, 10d-glucose and 10 HEPES/HEPES sodium. Glucose-free BSS (gf-BSS) was prepared by omitting glucose and adding 2 mm2-deoxy-d-glucose. 1,2 bis(2-aminophenoxy)ethane-N,N,N′,N′-tetra-acetic acid acetoxymethyl ester (BAPTA-AM) was obtained from Teflabs (Austin, TX). EGTA-AM, 2-aminophenol-N,N,O-triacetic acid acetoxymethyl ester (APTRA-AM), dinitro-BAPTA-AM, and calcium green-1-acetoxymethyl ester (AM) were from Molecular Probes (Eugene, OR). The permeant chelators were prepared within 72 hr of use as 20 mm stocks in anhydrous dimethyl sulfoxide (DMSO; J.T. Baker, Phillipsburg, NJ) and stored at −20°C. They were diluted to their final concentrations (10 and 100 μm) in BSS and sonicated for 3 min before use. NMDA (Sigma, St. Louis, MO) was prepared as a 20 mmstock in distilled water and dissolved to either 10, 40, or 100 μm final concentration in BSS preequilibrated to 36.5°C in 5% CO2. The NMDA antagonistsdl-2-amino-5-phosphonovaleric acid (APV) (300 μm, Sigma) and dizocilpine (MK-801, 30 μm) (Research Biochemicals, Natick, MA) were likewise prepared from stock solutions in gf-BSS.
Loading of slice cultures with calcium chelators. Cultures were rinsed 1× in BSS; incubated for 60 min at 36.5°C, 100% humidity, and a 5% CO2 in BSS containing the given permeant Ca2+ chelator; rinsed 2× in BSS; and maintained for an additional 30–40 min in the incubator before experiments. Control cultures were treated similarly with BSS containing 0.5% DMSO (the maximum quantity used in the chelator-treated slices).
The time course of BAPTA-AM loading into the slices was evaluated by loading them with 100 μm custom-synthesized14C-BAPTA-AM (specific activity 1.92 mCi/mol, Teflabs, Austin, TX) and fixing the BAPTA molecules in situ at different time intervals after loading. The radioactive carbons in14C-BAPTA-AM are located on the carboxyl residues comprising the Ca2+ chelating site, and are thus retained with the parent molecule after hydrolysis of the AM moieties. The relative 14C-BAPTA content in the slices was evaluated autoradiographically by exposing the slices to Hyperfilm βmax film (Amersham, UK) for 24 hr. The relative intra/extracellular distribution of 14C-BAPTA was evaluated by microautoradiography performed on semithin (10 μm) sections of fixed cultures using high-resolution LM-1 emulsion (Amersham, UK). Fixation of BAPTA was achieved by incubating the cultures for 90 min with 1-ethyl-3-(3-dimethylaminopropyl) carbodiimide-HCl (EDC, 20 mg/ml; Pierce, Rockford, IL) in PBS, pH 7.4, and by overnight incubation in 4% (w/v) paraformaldehyde in PBS (PFA). EDC cross-links carboxyl groups to primary amines found on surrounding proteins (Kendall et al., 1971; Yamamoto and Yasuda, 1977). Thus, it rapidly fixes BAPTA-free acid and other BAPTA-type chelators and permits the retention of BAPTA and its analogs in tissues during histological processing (Tymianski et al., 1997).
In some experiments, the slices were incubated as above with the fluorescent Ca2+ chelator calcium green-1/AM (25 μm), fixed with EDC, and viewed with a laser-scanning confocal microscope (488 nm excitation, ≥515 nm emission; Bio-Rad MRC 1000, Hertfordshire, England).
Induction of anoxia. The slice cultures were rinsed twice in BSS, returned to the incubator for 30 min, rinsed with gf-BSS for 15–20 min, transferred to an airtight microincubator chamber (Billups-Rothenberg, Del Mar, CA), and flushed with anoxic gas (5% CO2, balance N2, certified to 7 parts/million O2 in gas phase) for 60 sec at a pressure of 5 psi. This produced a rapid fall in oxygen content (to below 0.3%) at the level of the cultures (Fig. 1A, inset). All solutions were prewarmed and maintained at 36.5°C. Anoxia was terminated by returning the cultures to aerated culture medium containing 2.0 μg/ml propidium iodide (PI; Molecular Probes), a fluorescent viability indicator.

Characterization of organotypic hippocampal slice culture model. A, Anoxic vulnerability is maximal in 12 DIV or older cultures exposed to OGD, achieved by combining anoxia with aglycemia and 2DG. Cultures were exposed to 60 min of anoxia in the presence or absence of either d-glucose (11 mm) or 2DG (2 mm; n = 3 slices/group for 7–9 DIV, 5 slices/group for 12 DIV, 9 slices/group for 12 DIV + 2DG). Note that 60 min OGD in 12 DIV cultures caused PI fluorescence to rise to 35–40% of the maximum achieved by complete cell killing (neuronal and non-neuronal, see Materials and Methods). Sixty minutes OGD produced consistent near-total neuronal loss in the hippocampal cell layers by histological criteria (see Fig. 2). Inset, Time course of the decline in oxygen concentration after the onset of anoxia as measured with a Clarke oxygen electrode immersed in a culture well containing BSS. The electrode was calibrated at room air (20% oxygen) and in an anoxic atmosphere obtained by a 25 min flush with 95% nitrogen/5% CO2 with analyzed oxygen content of 7 parts/million in the gas phase (nominally zero oxygen). O2concentration at 3 min dropped to below 0.3%. B, PI fluorescence intensity is linearly related to the magnitude of neuronal loss (r = 0.95, p < 0.0001). Cultured 12 DIV hippocampal slices (n = 3) were exposed to OGD and fixed with 4% paraformaldehyde at 0, 5, and 24 hr after the insult. The number of pyknotic nuclei was counted in 16 high-power fields in the neuronal layers, and the counts were plotted against the PI fluorescence intensity obtained from the same fields immediately before fixation. C, PI fluorescence produced by 60 min OGD is of neuronal origin. Cultures were exposed to 500 μm NMDA (n = 8 slices) or to 500 μm each of NMDA and kainate (n = 8 slices) for 24 hr, or to either 1 or 3 hr of OGD (n = 7 and 9 slices, respectively) followed by a 24 hr incubation in BSS. PI fluorescence was normalized to that obtained from the same slices after complete cell killing. Both the NMDA and the 1 hr OGD insults produced only neuronal cell loss as gauged histologically (as in Fig. 3). The combined NMDA and kainate insult, as well as the 3 hr OGD insult, killed an additional cell population (p < 0.05, one-tailed Student’st test) that was resistant to 500 μm NMDA or 60 min of OGD, and was most likely glial, although a contribution from a small resistant neuronal population outside the neuronal layers cannot be excluded. PI fluorescence values obtained by OGD and the EAA insults were ∼40% of the maximum. Thus, the value of 40% of maximal fluorescence (horizontal dotted line) was selected in subsequent analyses as equating 100% neuronal death. D, Method of calculating cell death at a given time t from PI fluorescence images. Images of the cultures were taken before (i) and during (ii andiii) the 24 hr observation period and normalized to the maximal PI fluorescence values obtained with complete cell killing (iv). The formula shown was applied to the pooled fluorescence from the entire image or to fluorescence values derived from regions of interest (ROIs; solid lines iniv) encompassing the CA1,CA3, or dentate granule layer (DG) of the culture. ROIs were selected on the final PI image (iv) and then applied to the previous images in the same series (i–iii). Gray-level scale iniv applies to all images.
Anoxic vulnerability of slice cultures. Anoxic vulnerability depended on two factors: the culture age [days in vitro(DIV)] and the extent of glucose deprivation. Thus, cultures were maximally vulnerable to anoxia at 12 DIV or later, and required combining 60 min of anoxia with aglycemia and with 2 mm2-deoxy-d-glucose (2DG), an inhibitor of glucose metabolism (Fig. 1A). Anoxia without glucose deprivation was not toxic. Anoxia with glucose deprivation without 2DG produced little toxicity in young cultures (7–9 DIV) and incomplete injury in 12 DIV cultures (Fig. 1A). Thus, subsequent experiments were performed on 12–14 DIV cultured slices. Sixty minutes of glucose deprivation alone or in combination with 2DG was well tolerated by the cultures in the absence of anoxia, as gauged 24 hr after the insult both by the lack of any increase in PI fluorescence (Fig.2A) and normal neuronal morphology (Fig. 2C,E). Adding 60 min of anoxia caused intense PI fluorescence restricted to the neuronal cell layers (Fig.2B; layers CA1–CA3 and DG), complete degeneration of the neuronal layers upon histological examination (Fig.2D), and marked destruction of neuronal outlines at high magnification (Fig. 2F). Therefore, all anoxia experiments were performed in the absence of glucose and in the presence of 2 mm 2DG (henceforth referred to as OGD).
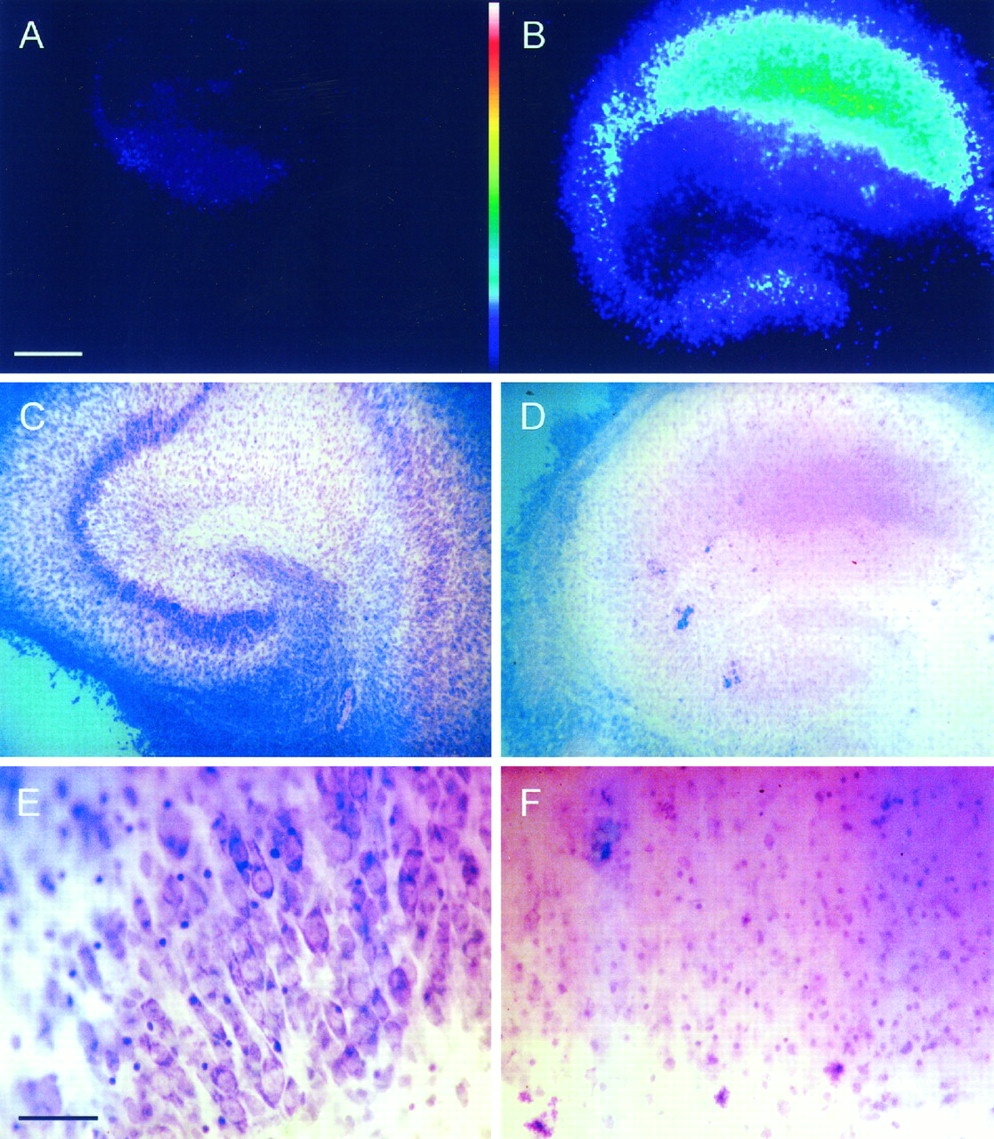
OGD causes complete neurodegeneration of all neuronal layers in organotypic hippocampal slices, whereas glucose deprivation alone does not. Cultures were maintained in BSS containing 2 μg/ml PI and exposed to anoxia/aglycemia + 2 mm 2DG (B, D, F) or to aglycemia + 2 mm 2DG without anoxia (A, C, E). After 24 hr, PI fluorescence was digitally imaged in the slices (A, B), after which they were fixed in 4% paraformaldehyde and stained with toluidine blue/acid fuchsin (C–F). No significant PI staining was observed in slices challenged with glucose deprivation alone (A), whereas OGD produced a significant increase in PI fluorescence in all neuronal layers (B). Similarly, glucose-deprived cultures exhibited normal neuronal morphology, whereas OGD-challenged slices sustained widespread neuronal loss at both low (4× objective; C, D) and high (40× objective; E, F) magnification. Thus, anoxic damage is reflected by intense PI staining (B), loss of neuronal cell layers at low magnification (D), and the replacement of neuronal outlines with pyknotic nuclei at higher magnification (F). A andB are digital, 8-bit/pixel pseudocolor images of PI fluorescence intensity, with purple andred representing low and high intensities, respectively (color bar). C–F are true-color images of the slices in A and B after staining with toluidine blue/acid fuchsin. The pale bluebackground in C and D is produced by toluidine blue staining of the membrane, on which the slices are cultured. Scale bars: 500 μm in A–D (shown inA); 75 μm in E and F(shown in E).
Measurement of neuronal cell death. Sequential PI fluorescence measurements were performed in each slice culture to define both the time course and extent of cell death over 24 hr. Nuclear staining with PI indicates cell death, because it is linearly related to the degree of cell loss (Fig. 1B) gauged by counts of pyknotic nuclei in high-power photomicrographs resembling those shown in Figure 2F (Newell et al., 1995). The advantage of measuring PI fluorescence over other toxicity assays, such as lactate dehydrogenase efflux, is that the former provides a quantitative index of cell death that can be easily repeated on the same preparation at different time intervals (Sattler et al., 1997).
To determine the cellular origin of the PI fluorescence increase produced by OGD, we first examined the distribution of cells from which the signal arose. OGD (60 min) produced the fluorescence pattern observed in Figure 2B, in which PI staining was restricted to the neuronal layers. Extending OGD from 1 to 3 hr produced only a slightly larger increase in PI fluorescence (Fig.1C), indicating that a near-maximal injury was already achieved by the 60 min insult. The damage was neuronal as determined histologically (Fig. 2) and by the fact that non-neuronal cells were unlikely to be damaged because they are considerably more resistant to anoxia (Vibulsreth et al., 1987; Rosenberg, 1991; David et al., 1996). Finally, cultures were exposed to 24 hr applications of large concentrations of NMDA with or without kainic acid. These insults, which affect neurons almost selectively (Koh and Choi, 1987; Bruno et al., 1994; David et al., 1996), produced PI fluorescence increases of a magnitude similar to that observed with anoxic insults (Fig.1C). Thus, a 60 min OGD produces near-complete and selective degeneration of neurons in the organotypic culture layers, which accounts for ∼40% of the maximal PI fluorescence achieved by complete cytodestruction (see below). This 40% of maximal PI fluorescence was therefore considered to represent 100% neuronal death in subsequent experiments.
Experimental protocols. All of the experiments were performed at 36.5°C in 12–14 DIV cultures (see above). Seventy-two hours before OGD, 2.0 μg/ml PI was included in the culture medium. This had no harmful effects on cell survival in the slices. Baseline PI fluorescence measurements were obtained from each slice immediately before OGD (Figs. 1Di, 4), and additional measurements were obtained at 1, 3, 5, and 24 hr after OGD.

MK-801, an NMDA receptor antagonist, attenuates neuronal damage produced by OGD: representative experiment. Pseudocolor images of PI fluorescence in cultures exposed to OGD (left column) and to OGD combined with MK-801 (30 μm;right column) at the indicated times. The panels at thebottom illustrate the maximum achievable PI fluorescence (after a further 24 hr incubation at 4°C) used to normalize the previous measurements from the same slice. MK-801 pretreatment (15 min before the insult) improved neuronal survival (see Fig. 3).Color scale indicates the relationship between color and fluorescence intensity, with purple andred representing low and high intensities, respectively. Scale bar, 1 mm.
NMDA receptor antagonists, when used, were present in all of the solutions, from 15 min before OGD until the end of the experiment (usually 24 hr). Identical concentrations of antagonists were also added to control (uninjured) cultures. In some experiments, a 60 min NMDA application was used instead of OGD.
At the end of each experiment, the slices were lethally challenged with NMDA and kainic acid (500 μm each in BSS) for 2 hr and incubated at 4°C for 24 hr. An additional PI fluorescence image of each slice was then taken and used to normalize the previous fluorescence measurements from the same slice. The intensity of PI fluorescence achieved with complete cell killing exceeded that of 60 min OGD by approximately 2.5-fold (Fig. 4, bottom).
Image acquisition. PI fluorescence in the cultures was viewed using an inverted microscope (Nikon Diaphot-TMD) equipped with epifluorescence optics, a low-power objective (Nikon PlanApo 4/0.20), and a rhodamine filter block (Nikon G-2A). Images were digitized at 8 bits/pixel using a video image obtained with a SIT video camera (C2400 model 8, Hamamatsu Photonics, Japan) controlled by software (Image-1, Universal Imaging, West Chester, PA) running on an 80386 microprocessor-based personal computer. Hardware gain and black level settings were optimized so that a single PI-labeled fluorescent nucleus could be clearly detected, and so maximal cell death did not saturate the camera.
Data analysis. A PI fluorescence intensity measurement for any given slice culture consisted of the sum of the fluorescence intensity values of each pixel in the image. This value was proportional to the number of injured cells in the present preparation (Newell et al., 1995) (Fig. 1B). Each PI fluorescence measurement was background-subtracted using the fluorescence image gathered immediately before OGD and normalized to the maximal fluorescence obtained from the same slice after complete cell killing. Thus, the percentage of cell death in each experiment was expressed as:
 where Ft is slice fluorescence at time t, Fb is background fluorescence at the start of the experiment, andFmax is maximal fluorescence after complete cell killing (Fig. 1Div). In some experiments, the same approach was used to examine the effects of injury and treatment on cell death in specific hippocampal regions (CA1, CA3, and dentate gyrus) by obtaining the PI fluorescence values from these regions of interest separately, as shown in Figure 1Div. This separate analysis revealed that, unlike in the hippocampus in vivo, neurons in these regions in slice cultures behaved similarly with respect to their survival responses to NMDA, OGD, and to treatment with Ca2+ chelators (Table 1). All data were examined using ANOVA with the Newman–Keuls procedure to evaluate differences between individual group means. All means are shown with their SE.
Effects of OGD, NMDA, and BAPTA-AM on regional neuronal vulnerability
RESULTS
We examined whether increasing the Ca2+ buffering capacity of neurons reduces the neurotoxic sequelae of OGD, whether such manipulation has neurotoxic potential, and whether the mechanism underlying these effects is pre- or postsynaptic. Experiments were performed in 12–14 DIV organotypic hippocampal cultures exposed to 60 min OGD (Fig. 1A). Neuronal survival was measured quantitatively with the fluorescent viability marker PI at various time intervals for 24 hr after the insult (Fig. 1B). The 60 min OGD insult selectively injured neurons in the hippocampal cell layers (Figs. 1C, 2A–F; see Materials and Methods). Neurons in the different regions of the hippocampus (CA1, CA3, and dentate gyrus; Fig. 1Div) behaved similarly with respect to their vulnerability to OGD and NMDA application; they also responded similarly to treatment (Table 1).
OGD neurotoxicity is mediated partially by NMDA receptor activation
Previous studies suggest that exogenous Ca2+chelators may affect NMDA receptor-mediated glutamatergic mechanisms. The chelators may act postsynaptically by attenuating neurotoxic NMDA-mediated cytosolic calcium loading (Tymianski et al., 1994a) and/or presynaptically by attenuating excitatory neurotransmitter release (Tymianski et al., 1994b; Ouanounou et al., 1996; Spigelman et al., 1996). Thus, we first examined the role of NMDA receptor activation in OGD toxicity in the present preparation. Also, because a 60 min OGD insult produces near complete death of all neurons in the slice (see Materials and Methods; Figs. 1C, 2), it was necessary to establish whether this severe insult is at all amenable to therapeutic manipulation.
Before the 60 min OGD insult, the cultures were pretreated with eitherdl-APV (300 μm) or MK-801 (30 μm), a competitive and a noncompetitive NMDA antagonist, respectively. The antagonists were also included in the extracellular solution for the subsequent 24 hr observation period. Both NMDA receptor antagonists were equally effective in attenuating OGD neurotoxicity. The effects of both antagonists on the time course and extent of neurotoxicity were manifest within the first hour after insult (Fig. 3A) and persisted for 24 hr (Fig. 3B,C). Treated slices exhibited between 40 and 50% improved neuronal survival over similarly challenged, untreated controls (Fig. 3C). The representative PI fluorescence images in Figure 4 illustrate both the time course and extent of neurotoxicity in cultures exposed to OGD (left column) or to OGD with MK-801 (right column). Adding the NMDA antagonist visibly reduced the increase in PI fluorescence at each time point examined compared with the untreated injured control. Thus, OGD toxicity, presumably triggered by synaptic overactivity and endogenous glutamate release, is mediated to a significant degree by NMDA receptor activation as it is attenuated by NMDA antagonists.

OGD-induced neuronal injury is partially mediated by NMDA receptor activation. Slice cultures were exposed to 60 min OGD alone (11 slices) or in the presence of 30 μm MK-801 (11 slices) or 300 μmdl-APV (9 slices). Antagonists were present from 15 min before OGD until the end of the 24 hr period. A, B, Representative series of experiments. Both antagonists equally reduced anoxic injury when compared with untreated anoxic slices (ANOVA followed by the Newman–Keuls procedure for multiple comparisons; groups included are in dotted boxes, p values marked on plot). Open symbols, Glucose deprivation in the presence of 2 mm 2DG without anoxia (no treatment, 11 slices; MK-801, 11 slices; APV, 13 slices). A, Time course of neuronal cell death at 0–5 hr. B, Extent of neuronal death at 24 hr (note differences in ordinate between A andB). C, Effect of NMDA antagonists on the survival of OGD-challenged neurons over 24 hr. Data were pooled from two series of experiments using MK-801 (22 total slices) and APV (23 slices). Protective efficacy of a treatment was expressed as a survival ratio, defined as 100 × (1 −Dtreated/Duntreated), whereDtreated/Duntreatedis the ratio of OGD-induced neuronal death in the antagonist treated and untreated groups, respectively. A value of 100 indicates that the treatment completely prevented neuronal death, whereas 0 indicates no effect of treatment. Asterisks indicate significant differences from zero.
Incubating cultured slices with BAPTA-AM results in intraneuronal chelator accumulation
The loading of AM derivatives of BAPTA into neurons in thick tissue sections is more problematic than in dissociated cultures. The difficulty is ascribed to the intervening extracellular matrix (which limits access to neurons) (Yuste and Katz, 1991) and is solved partially by using higher concentrations of AM analogs (Dani et al., 1992). Because intracellular delivery of Ca2+ buffers was critical to the present study, we first determined whether loading organotypic slices with permeant buffers achieves intraneuronal chelator accumulation.
Slice cultures were loaded with 14C-BAPTA-AM and fixed with EDC (see Materials and Methods). The method of EDC fixation distinguished between BAPTA-AM and its deesterified forms because the cross-linking reaction involves the carboxylic acids of the Ca2+ chelating site (Tymianski et al., 1997). The fixed slices were sectioned (10 μm), coated with photo emulsion, and evaluated by microautoradiography (Fig. 5A, representative section). This revealed a preferential localization of silver grains over neuronal cell layers (66.4 ± 3.1 over cell layers compared with 43.2 ± 2.1 outside cell layers; units are grains/surface area unit, means indicated differed by Student’st test, p < 0.0001).

Treating slice cultures with BAPTA-AM and BAPTA analogs results in intraneuronal chelator accumulation.A, Cellular autoradiography of the CA1 region from a 10-μm-thick section of a 14C-BAPTA-AM-loaded slice culture (40× microscope objective) counterstained with hematoxylin and eosin. The slice was loaded with 100 μm14C-BAPTA-AM (see Materials and Methods) and fixed with EDC 24 hr after loading. There was a higher density of silver grains over the cell layers (see Results). Scale bar, 40 μm. B, Confocal image of a slice culture similarly loaded with the fluorescent cell-permeant BAPTA analog calcium green-AM (25 μm), fixed after 5 hr with EDC (see Results), and sectioned (10 μm). Distinct localization of the compound was detected in cell layers. Scale bar, 300 μm. C, Higher magnification of an area from the slice in B confirms intraneuronal loading of calcium green. Scale bar, 20 μm. Data in A andB are representative of five experiments per group.
To evaluate with greater accuracy the spatial distribution of BAPTA-like compounds in loaded slices, cultures were loaded with the fluorescent BAPTA analog calcium green-1-AM (25 μm) and examined by confocal microscopy. Visualization of distinct cell layers was poor in the first hour because of the presence of calcium green-1-AM precipitates overlying the slice tissue (data not shown). To better visualize the intraneuronal chelator salt without the confounding presence of calcium green-AM, some slices were fixed with EDC, washed many times, sectioned (10 μm), and imaged. This approach revealed unambiguously the presence of the indicator in the intraneuronal compartment (Fig. 5B,C).
BAPTA-AM pretreatment temporarily protects against OGD-induced neurodegeneration
Slice cultures were pretreated at 36.5°C with different concentrations of BAPTA-AM. OGD was initiated for 60 min within 45–60 min after loading was completed. Neuronal death was then measured at different time intervals for 24 hr. The representative experiments in Figure 6, A and B, illustrate that pretreatment with both 10 and 100 μm BAPTA-AM was well tolerated by control cultures, showing no untoward effects of the drug treatment alone. Both chelator concentrations attenuated considerably the toxicity of 60 min OGD throughout the first hour of observation, with the higher BAPTA concentration having a slightly greater effect (Fig. 6A). The extent of early protection by BAPTA was similar to that of NMDA receptor antagonists (compare Fig.3A to Fig. 6A and Fig. 3C to Fig. 6C). However, unlike treatment with NMDA antagonists, protection by BAPTA-AM pretreatment did not persist until the 24 hr time point (Fig. 6B).

Pretreatment with BAPTA-AM temporarily protects cultured slices from OGD. The slices were pretreated with BAPTA-AM (10 or 100 μm, n = 18 and 19 slices, respectively) in a total of 0.5% DMSO or with DMSO alone. Subsequently, they were exposed to 60 min OGD. A, B, Representative series of experiments. A, OGD-induced cell death was significantly lower in both BAPTA-treated groups at 1, 3, and 5 hr after the insult compared with untreated OGD controls (n = 17 slices). B, At 24 hr, however, this protective effect of BAPTA pretreatment was no longer significant (ANOVA followed by Newman–Keuls procedure for multiple comparisons; groups included are in dotted boxes,p values marked on plot). Open symbols, Glucose deprivation without anoxia (DMSO, 10 μm and 100 μm BAPTA-AM groups, n = 9, 6, and 8 slices, respectively). C, Effect of BAPTA-AM on the survival of OGD-challenged neurons over 24 hr. Data were pooled from two series of experiments using 10 μm BAPTA-AM pretreatment (18 slices) and five series of experiments with 100 μm BAPTA-AM (66 slices). Survival ratios were calculated as in Figure 4C. At 3 and 5 hr after OGD, the survival ratios of 10 and 100 μm BAPTA-AM pretreatments were comparable to those resulting from NMDA antagonists. However, unlike with NMDA antagonists, a protective effect of BAPTA was no longer observed at 24 hr. Asterisks indicate significant differences from zero (no treatment effect).
The time course of 14C-BAPTA retention in the cultured slices parallels exactly the time course of neuroprotection
A disadvantage of using cell membrane-permeant forms of BAPTA to enhance Ca2+ buffering is that the intracellular concentrations of the chelator are difficult to estimate. Also, because these compounds are metabolized (Tsien, 1981; Van Der Zee et al., 1989) and extruded from cells (Di Virgilio et al., 1990; Munsch and Deitmer, 1995; Ouanounou et al., 1996), their kinetics are difficult to predict. Therefore, to determine the cause of the transient neuroprotective action of BAPTA-AM seen presently, we examined the time course of BAPTA retention in the cultures.
Slices were loaded with 14C-BAPTA-AM, fixed at 0, 3, 5, 10, and 24 hr after loading with EDC (see Materials and Methods), and studied by autoradiography. The time course of 14C-BAPTA retention in the slice tissue is shown qualitatively in the representative 14C-BAPTA autoradiographs in Figure7A, and quantitatively by densitometric analysis (Fig. 7B). Tissue 14C-BAPTA content remained stable for the first 5 hr after loading, followed by a rapid decline to nearly 50% of initial levels at 10 hr, and a fall to below 15% of initial values by 24 hr. This time course paralleled exactly the time course of neuroprotection by BAPTA-AM after OGD (compare Fig.6C to Fig. 7B).

The time course of BAPTA retention in the cultured slices parallels exactly the time course of neuroprotection. The cultures were loaded using 14C-BAPTA-AM, and the relative quantity of 14C-BAPTA in the slice tissue was assessed autoradiographically. The chelator was fixed at the different times using the cross-linker EDC (see Materials and Methods).A, Representative 14C-BAPTA autoradiographs of cultures fixed at the indicated times after loading with14C-BAPTA-AM. EDC was used for panels i–v.vi illustrates a slice similarly loaded using14C-BAPTA-AM, but fixed in 4% paraformaldehyde (PFA) rather than with EDC immediately after loading. This fixative fails to maintain the chelator in the tissue (compare with i). Scale bar, 1.2 mm. B, Densitometric quantitation of the time course of BAPTA retention. Data shown are background-subtracted mean density values obtained from at least two 14C-BAPTA-AM-loaded slices at each time point and at each group. PFA-fixed slices were not distinguishable from background. The 14C-BAPTA signal was retained in the slices for the first 5 hr and then decreased markedly by 24 hr (compare with protective efficacy, Fig. 6C). The background-corrected maximum black level of the photographic emulsion is also shown (triangles) to emphasize that the complete retention of EDC-fixed slices between 0 and 5 hr is not attributable to a saturation artifact.
These experiments (Figs. 6, 7) contrast with those using NMDA antagonists (Figs. 3, 4), in which the antagonists could be maintained at their site of action throughout the 24 hr observation period. They illustrate that the neurotoxic processes triggered by OGD are Ca2+-dependent and remain active for many hours beyond the initial insult, because toxicity could be blocked both while NMDA antagonists were present outside the cells (24 hr) and while Ca2+ buffering was elevated within the cells (several hours). The nature of these neurotoxic processes is presently unclear. However, brief anoxic or excitotoxic insults in other preparations (such as primary striatal cultures, cerebellar granule cells, and acute hippocampal slices) have been shown to trigger persistent secondary processes, including the delayed formation of nitric oxide, a prolonged release of endogenous EAAs for hours after terminating the initiating insult, longstanding cell membrane depolarization that exceeds the duration of the primary insult, longstanding failure of synaptic transmission, and prolonged disturbances in cell energy metabolism (Kass and Lipton, 1982, 1986; Novelli et al., 1988; Strijbos et al., 1996).
The protective effect is attributable to intracellular BAPTA and not to extracellular BAPTA or the AM moiety
The identical time courses of neuroprotection and of14C-BAPTA retention are insufficient to prove causality between the presence of intracellular BAPTA and the protective effect. However, identical pretreatment of cultured slices with 100 μm BAPTA tetrapotassium salt, which is cell-impermeant, had no effect on the time course and extent of neurodegeneration after OGD, indicating that extracellular Ca2+ chelation was not responsible for neuroprotection (Fig. 8). Also, pretreating slices with dinitro-BAPTA-AM, a chelator having a negligible affinity for Ca2+ ions (Kd ∼25 mm), also had no significant effect on cultures exposed to OGD (Fig. 8). Thus, the observed effects of BAPTA-AM were specifically attributable to enhancement of intracellular Ca2+ buffering, rather than to effects of the AM moiety or to nonspecific pharmacological phenomena related to the BAPTA structure, since these are also provided by dinitro-BAPTA-AM.

Protection by BAPTA-AM is attributable to intracellular Ca2+ chelation, not to extracellular Ca2+ buffering or to the AM moiety. Slice cultures were challenged with 60 min OGD in the presence of DMSO alone (DMSO; 24 slices), BAPTA-AM (38 slices), BAPTA tetrapotassium salt (K-BAPTA; 5 slices), which is cell-impermeant, and dinitro-BAPTA-AM (DN-BAPTA-AM; 8 slices), which has a negligible affinity for Ca2+.Asterisks indicate differences from DMSO groups (ANOVA followed by Newman–Keuls procedure for multiple comparisons).
These findings, along with the results in Figures 5, 6, 7, indicate unequivocally that enhancing neuronal Ca2+ buffering either attenuates, or delays by many hours, the onset of anoxic neurodegeneration.
Ca2+ buffers are ineffective as neuroprotectants when transmitter release is bypassed
If synaptic overactivity mediates anoxic cell death (Kass and Lipton, 1982; Rothman, 1983, 1984), then protection by Ca2+buffers, which attenuate synaptic transmitter release in many preparations (Adler et al., 1991; Niesen et al., 1991; Tymianski et al., 1994b; Ouanounou et al., 1996; Spigelman et al., 1996), may occur by this mechanism. However, exogenous Ca2+ buffers also attenuate postsynaptic cytosolic Ca2+ increases in neurons (Tymianski et al., 1993c, 1994a). Because Ca2+ loading triggers neurotoxicity (Choi, 1988; Hartley et al., 1993; Tymianski et al., 1993a,b; Lu et al., 1996), the protective effects of BAPTA-AM could be ascribed to this postsynaptic mechanism.
To examine this presently, the process of synaptic transmitter release was bypassed by exposing the cultures to NMDA, rather than to OGD. This maneuver directly activates postsynaptic NMDA receptors and produces toxicity similar to OGD (Fig. 1C). If Ca2+buffers protect by presynaptic mechanisms, then they should be ineffective when the insult is produce by adding exogenous excitotoxin.
The cultures were pretreated as before with 100 μm of either: BAPTA-AM, EGTA-AM (a slow buffer with similar Ca2+affinity to BAPTA) or APTRA-AM (a fast buffer with a lower Ca2+ affinity than BAPTA; see below). The cultures were then challenged for 60 min with a range of concentrations of NMDA (10, 40, and 100 μm).
Neurons in both chelator-treated and untreated cultures exposed to 10 μm NMDA were unaffected by this insult, and no adverse effects of the chelators were noted (Fig.9A). By contrast, a 100 μm NMDA exposure caused almost complete, widespread neuronal death, which also remained unaffected in the presence of the chelators (Fig.9A). Furthermore, an intermediate exposure to NMDA (40 μm) actually potentiated, rather than reduced, cell death in cultures treated with BAPTA-AM (Fig. 9A–C). However, this potentiated toxicity was not seen with either EGTA-AM or with APTRA-AM (Fig. 9A–C). The inability of any of the chelators to attenuate NMDA toxicity is consistent with a presumed presynaptic site for their neuroprotective action. The increased toxicity of intermediate NMDA concentrations in the presence of BAPTA-AM is also consistent with previous reports in which BAPTA-AM pretreatment of cell cultures enhanced or accelerated the toxicity ofl-glutamate or NMDA challenges (Baimbridge and Abdel-Hamid, 1992; Dubinsky, 1993; Abdel-Hamid, 1994).

BAPTA-AM pretreatment is ineffective when neurons are directly challenged with NMDA. A, Slice cultures were pretreated with 100 μm of either BAPTA-AM, EGTA-AM, or APTRA-AM, and were then challenged with either 10, 40, or 100 μm NMDA for 60 min (9–11 slices per group). The chelators had no impact on the time course and extent of neurotoxicity produced by the mild and severe NMDA insults (10 and 100 μm NMDA, respectively). The intermediate insult (40 μm NMDA) caused increased neurodegeneration in the presence of BAPTA-AM (asterisks, p< 0.05). B, C, Representative experiments with 40 μm NMDA, in which BAPTA-AM, but not EGTA-AM or APTRA-AM, potentiated NMDA toxicity (n = 8–10 slices in NMDA groups, 4–6 slices in control groups). Dotted boxes, Groups included in ANOVA, followed by Newman–Keuls procedure for multiple comparisons (p indicates comparisons to BAPTA + NMDA-treated group).
APTRA-AM, a permeant buffer that selectively attenuates transmitter release, is also protective
Exogenous Ca2+ buffers attenuate transmitter release by dissipating the gradients of high presynaptic [Ca2+]i required to trigger the release process (Adler et al., 1991; Roberts, 1993). Because [Ca2+]i must rise to micromolar levels for release to occur (Smith and Augustine, 1988), chelators having a relatively low Ca2+ affinity may be as potent at attenuating release as high-affinity buffers. For example, APTRA, whoseKd for Ca2+ is in the 20–25 μm range, attenuates excitatory transmitter release in acute hippocampal slices as effectively as BAPTA (Kd of 100–400 nm) (Spigelman et al., 1996). In contrast to their presynaptic actions, however, buffers with micromolar Ca2+ affinity have little effect on postsynaptic [Ca2+]i increases evoked by EAAs (Tymianski et al., 1994a), and may thus be used to separate presynaptic from postsynaptic effects.
Figure 10, A and B, shows that in cultured slices loaded with 100 μm APTRA-AM before 60 min OGD, neuroprotection was observed at 3 and 5 hr but not at 24 hr, an effect similar to that of BAPTA-AM. This finding and the ineffectiveness of both BAPTA-AM and APTRA-AM in the face of a direct NMDA insult (see above) further support a presynaptic site of action for the neuroprotective mechanism of Ca2+ buffers.

APTRA-AM, a permeant chelator having a lower Ca2+ affinity and different structure from BAPTA-AM, is also effective. Slices were pretreated with 100 μm of either BAPTA-AM (11 slices) or APTRA-AM (9 slices). Controls were pretreated with DMSO alone (9 slices). Subsequently, the cultures were exposed to 60 min OGD. Neuronal survival at 3 and 5 hr after OGD was better in the chelator-treated groups (ANOVA on groups indicated in thedotted boxes was followed by Newman–Keuls procedure for multiple comparisons; p values indicate comparisons to chelator-untreated controls). A, Times 0–5 hr.B, Outcome at 24 hr.
DISCUSSION
Here we examined the hypothesis that enhancing neuronal Ca2+ buffering capacity would attenuate or delay the onset of anoxic neurodegeneration, and we examined the mechanisms of these effects. The toxicity of OGD in the present model of anoxic neurodegeneration (Figs. 1, 2) was mediated largely by NMDA receptor activation (Figs. 3, 4). Incubating the cultured slices with BAPTA-AM produced intraneuronal chelator accumulation (Fig. 5) and temporarily protected against OGD (Fig. 6). The time course of BAPTA retention in the cultured slices paralleled exactly the time course of neuroprotection (Fig. 7), indicating that enhanced resilience to OGD lasted only while Ca2+ buffering capacity was elevated. This enhanced resilience was attributable to intracellular Ca2+ chelation by BAPTA, and not to extracellular Ca2+ chelation or to the AM moiety (Fig. 8). Furthermore, the site of neuroprotective action of BAPTA was likely presynaptic, because the exogenous Ca2+ buffers were ineffective when the step of transmitter release was bypassed by adding NMDA directly (Fig. 9), and because APTRA-AM, a permeant buffer that selectively attenuates transmitter release, was also effective against OGD (Fig.10). Although the ability of Ca2+ buffers to attenuate synaptic transmitter release is documented (Adler et al., 1991; Niesen et al., 1991; Tymianski et al., 1994b; Ouanounou et al., 1996;Spigelman et al., 1996), this is the first demonstration that this property underlies the mechanism by which intracellular Ca2+ buffering enhances neuronal resilience against anoxic injury.
Organotypic hippocampal slice cultures are being regarded increasingly as a useful model system for investigating hypoxic/ischemic mechanisms (Newell et al., 1990, 1995; Vornov and Coyle, 1991; Strassler and Fischer, 1995). We chose this model because, unlike dissociated cell cultures, organotypic slices retain the anatomical integrity of synaptic circuits, which, through synaptic overactivity, may be involved in producing ischemic neuronal damage (Kass and Lipton, 1982; Rothman, 1983, 1984; Johansen et al., 1986;Onodera et al., 1986). Also, the advantages associated with the qualitative and quantitative resemblance of cultured hippocampal slices to mature brain (Gahwiler, 1984; Stoppini et al., 1991; Buchs et al., 1993; Muller et al., 1993) may outweigh potential technical difficulties associated with their use. These difficulties consist primarily of unreliable drug delivery and of uncertainty in quantitatively gauging cell death in the thick tissue slice. However, these issues were overcome in this report (Figs. 1, 2, 5).
Because endogenous cellular Ca2+ buffers are difficult to manipulate, we used the cell-permeant form of BAPTA, an ion chelator that has a high selectivity and affinity for Ca2+ over other ions and that exhibits fast Ca2+ binding (Tsien, 1980; Kao and Tsien, 1988; Pethig et al., 1989). BAPTA, a synthetic buffer, is thought to share several properties with endogenous Ca2+ binding proteins such as calbindin-D28K, including cytoplasmic mobility, Ca2+ affinity, Ca2+ binding rates, and measurable physiological effects (Scharfman and Schwartzkroin, 1989; Chard et al., 1993; Roberts, 1993,1994). However, unlike endogenous Ca2+ buffers, the loading of BAPTA-like compounds into neurons is reversible, because they are actively extruded from the cell by organic anion transport mechanisms (Di Virgilio et al., 1990; Munsch and Deitmer, 1995; Ouanounou et al., 1996). These features make BAPTA and its analogs ideal for reversibly manipulating cytoplasmic Ca2+ buffering in neurons to directly examine the association between cytoplasmic Ca2+buffering and neuronal vulnerability to injury.
Time course of neuroprotection from OGD by chelator pretreatment
The finding that the neuroprotection time course of BAPTA-AM paralleled exactly its retention in the slices suggests the intuitive next step, which is to examine strategies to promote the retention of BAPTA-like buffers in neurons to determine whether this prolongs the protective effect. Because BAPTA and its analogs are primarily extruded by organic anion transport mechanisms (Di Virgilio et al., 1990; Munsch and Deitmer, 1995; Ouanounou et al., 1996), two approaches may be used to enhance chelator retention: (1) using inhibitors of organic anion pumps, such as probenecid, which reduces the extrusion of BAPTA analogs from cells and prolongs the presynaptic inhibition of excitatory neurotransmission (Arkhammar et al., 1991; Ouanounou et al., 1996); and (2) lowering temperature, because membrane transporters function more slowly at reduced temperatures (Bigelow et al., 1986; Sayegh et al., 1992; Knerr and Lieberman, 1993). Both hypothermia (Bruno et al., 1994;Newell et al., 1995) and probenecid (M. Tymianski and R. Sattler, unpublished observations) are inherently neuroprotective in addition to modulating BAPTA retention. Details of their effects on the time course of protection by permeant buffers will be examined in a future report.
Neuroprotection and toxicity of exogenous Ca2+ chelators
Although enhancing neuronal Ca2+ buffering has neuroprotective potential, we have shown that BAPTA-AM, under select circumstances (moderate insult with NMDA), can also be toxic. This finding reconciles the authors’ and others’ previously conflicting conclusions about the utility of Ca2+ buffers as neuroprotectants [Scharfman and Schwartzkroin (1989) vs Abdel-Hamid (1994)] (Baimbridge and Abdel-Hamid, 1992; Dubinsky, 1993; Tymianski et al., 1993c, 1994a). For example, Tymianski et al., working in spinal neurons, suggested that pretreatment with BAPTA-AM was protective against a glutamate challenge when toxicity was assayed within a few hours of the insult. However, Abdel-Hamid and Baimbridge showed in hippocampal neurons that pretreatment with BAPTA-AM before excitotoxin application was toxic at 24 hr (see references above). The disparity of previous findings illustrates the importance of evaluating the time course, the mechanism, and the extent of cell death in excitotoxic paradigms, particularly because increasing evidence now suggests that processes mediating excitotoxic neurodegeneration remain operative for many hours beyond the original insult (this paper; Strijbos et al., 1996). The present report indicates that both previous views have merit, because neuroprotection and toxicity by the chelators may depend both on the mechanism (presynaptic or postsynaptic) and severity of injury.
Previous studies provide limited information on the mechanism of protective action of exogenous Ca2+ buffers. For example, although early protective effects have been reported in cultured spinal neurons after glutamate application (Tymianski et al., 1993c, 1994a), toxicity was not examined at the 24 hr time point, and thus no adverse effects of the chelators were noted. Also, in contrast to the lack of protection seen in BAPTA-AM-treated organotypic hippocampal cultures challenged with NMDA, our work in spinal neurons indicated that treatment of neurons with cell-permeant Ca2+ buffers was protective against the direct application of glutamate. Thus, although the results in the present report point to a principally presynaptic mechanism for the action of the exogenous buffers in hippocampal slice cultures, we cannot rigorously exclude the possibility that, in some instances, the mechanism of neuroprotection by Ca2+ buffers may include a postsynaptic component. A weakness of previous works, however, was that no attempt was made to determine the extent to which endogenous excitotoxin release contributed to toxicity after exogenous glutamate application. Thus, the degree to which attenuation of transmitter release contributed to protection in cultured spinal neurons is uncertain. Similarly, work in vivo in which permeant Ca2+ buffers attenuated neocortical damage in focal brain ischemia (Tymianski et al., 1993c, 1994b) did not specifically rule out either a pre- or postsynaptic locus for the buffers’ protective effect. However, in these studies, the demonstration of efficacy of a low-affinity Ca2+ buffer against ischemia (4,4′-difluoro BAPTA-AM, Kd ∼ 4600 nm) is also suggestive of a presynaptic protective mechanism.
Unlike neuroprotective mechanisms, the physiological effects of exogenous Ca2+ buffers have been better characterized. Buffering of presynaptic [Ca2+]i increases in submembrane regions where transmitter release occurs is a property of fast Ca2+ buffers in the squid giant synapse (Adler et al., 1991), dentate granule cells (Niesen et al., 1991), and CA1 pyramidal neurons (Tymianski et al., 1994b; Ouanounou et al., 1996; Spigelman et al., 1996), and explains the ability of buffers having a wide range of Ca2+ affinities to attenuate transmitter release. Postsynaptically, exogenous Ca2+ buffers affect Ca2+ dynamics (Roberts, 1993, 1994; Zhou and Neher, 1993) and cell membrane excitability by potentiating Ca2+-dependent membrane currents (Zhang et al., 1995). However, the impact of these postsynaptic effects on neuronal vulnerability to injury is uncharacterized.
The mechanisms of toxicity observed in BAPTA-AM-treated cells after a moderate NMDA insult (Fig. 9) are also unclear. Calcium ions are important second messengers governing numerous physiological processes within cells (Blaustein, 1988; Ghosh and Greenberg, 1995). Intuitively therefore, it is understandable that long-standing suppression of physiological Ca2+ signaling in neurons could be harmful. However, the finding that control cultures tolerated being loaded with Ca2+ buffers without exhibiting toxicity (Figs. 6, 9) suggests that either toxicity is a synergistic property of neuronal Ca2+ loading in the presence of a buffer, or that neurons that are injured by EAAs or by OGD are less tolerant than uninjured controls of the presence of exogenous buffers.
Proponents of the former hypothesis suggest that intracellular Ca2+ chelation may actually increase rather than decrease total neuronal Ca2+ loading (Baimbridge and Abdel-Hamid, 1992; Abdel-Hamid, 1994), thus preventing Ca2+-dependent inactivation of Ca2+ channels or NMDA receptor channels (Legendre et al., 1993). This has been the rationale for using BAPTA as a common ingredient in patch pipette solutions to prevent the rundown of Ca2+ and Ca2+-dependent currents (Spigelman et al., 1992; Zhang et al., 1994, 1995). Certainly, both exogenous BAPTA-like and endogenous Ca2+ buffers have been shown to prolong stimulus-evoked increases in [Ca2+]iin neurons (Chard et al., 1993a; Tymianski et al., 1994a). Thus, although this has never been tested directly, the toxicity of enhanced Ca2+ buffering could be directly attributable to increased postsynaptic Ca2+ loading (Hartley et al., 1993; Lu et al., 1996). Interestingly, transfecting GH3 cells with calbindin-D28K caused a decrease rather than an increase in stimulus-evoked calcium currents (Lledo et al., 1992), and decreasing the ability of mitochondria to buffer Ca2+ in cerebellar granule cells decreased neuronal Ca2+ loading and consequent neurotoxicity (Budd and Nicholls, 1996b). Both findings are contradictory to the notion that enhanced Ca2+ buffering increases Ca2+ loading. Pending direct examination of the above hypothesis, an additional possibility is that BAPTA-AM toxicity is unrelated to Ca2+ chelation. For example, after deesterification, the metabolism of AM moieties to formaldehyde (Tsien, 1981) may be toxic when excessive quantities of BAPTA-AM are used. This could explain why toxic effects of BAPTA-AM persisted after BAPTA itself was extruded from the cells (Fig. 7). Also, BAPTA and its analogs have been shown to pharmacologically block inositol triphosphate-mediated Ca2+ release and the activation of phospholipases independently of Ca2+ chelation (Coorssen and Haslam, 1993; Richardson and Taylor, 1993). Finally, toxicity could be ascribed to a combination of the above possibilities.
Conclusion
The present results demonstrate for the first time that enhancing the Ca2+ buffering capacity of cultured neurons can delay or attenuate the onset of anoxic neurodegeneration, most likely by presynaptic inhibition of excitatory neurotransmitter release. However, exogenous permeant Ca2+ chelators such as BAPTA-AM may be less effective when the injury does not involve endogenous synaptic overactivity, and may exhibit toxicity. Further work is warranted to better define the protective and toxic sequelae of Ca2+buffering in neurons, because this previously understudied aspect of cellular Ca2+ regulation may provide useful new approaches to treating neurodegenerative disorders associated with disturbed Ca2+ homeostasis.
Footnotes
M.T. is a Clinician Scientist of the Medical Research Council of Canada. This work was supported by an Ontario Technology Fund Grant in collaboration with Allelix Biopharmaceuticals to M.T. We thank Lucy Teves for technical assistance.
Correspondence should be addressed to Dr. Michael Tymianski, Neuroprotection Laboratory, Lab 11–416, MC-PAV, Playfair Neuroscience Unit, Toronto Hospital, Western Division, 399 Bathurst Street, Toronto, Ontario M5T-2S8, Canada.


