

Abstract
Brain homeostasis depends on the composition of both brain interstitial fluid and CSF. Whereas the former is largely controlled by the blood–brain barrier, the latter is regulated by a highly specialized blood–CSF interface, the choroid plexus epithelium, which acts either by controlling the influx of blood-borne compounds, or by clearing deleterious molecules and metabolites from CSF. To investigate mechanisms of brain protection at the choroid plexus, the blood–CSF barrier was reconstituted in vitro by culturing epithelial cells isolated from newborn rat choroid plexuses of either the fourth or the lateral ventricle. The cells grown in primary culture on semipermeable membranes established a pure polarized monolayer displaying structural and functional barrier features, (tight junctions, high electric resistance, low permeability to paracellular markers) and maintaining tissue-specific markers (transthyretin) and specific transporters for micronutriments (amino acids, nucleosides). In particular, the high enzymatic drug metabolism capacity of choroid plexus was preserved in the in vitro blood–CSF interface. Using this model, we demonstrated that choroid plexuses can act as an absolute blood–CSF barrier toward 1-naphthol, a cytotoxic, lipophilic model compound, by a coupled metabolism–efflux mechanism. This compound was metabolized in situ via uridine diphosphate glururonosyltransferase-catalyzed conjugation, and the cellular efflux of the glucurono-conjugate was mediated by a transporter predominantly located at the basolateral, i.e., blood-facing membrane. The transport process was temperature-dependent, probenecid-sensitive, and recognized other glucuronides. Efflux of 1-naphthol metabolite was inhibited by intracellular glutathione S-conjugates. This metabolism–polarized efflux process adds a new facet to the understanding of the protective functions of choroid plexuses.
- choroid plexus epithelial cell culture
- blood–brain barrier
- brain protection
- drug metabolism
- multidrug resistance-associated protein
- UDP-glucuronosyl transferase
- glutathione S-transferase
The CSF circulatory system has for long been considered as a drainage system for the degradation products of cerebral metabolism, as well as a mechanical means of achieving buoyancy and intracranial volume adjustment. New evidence suggests more specific CSF functions, including buffering of brain extracellular fluid ions and other solutes, hormone delivery, paracrine neurotransmission, and mediation of immune responses (Johanson, 1995;Davson and Segal, 1996; Boulton et al., 1997). CSF is secreted for a large part by the three types of choroid plexuses located in the ventricular cisternae. Similarly to other secreting/transporting epithelia, the choroidal epithelium, which overlies a highly vascularized stromal core, is composed of a tight monolayer of polarized cells and forms the actual barrier between blood and CSF. Choroid plexuses have been shown to participate in the various functions attributed to CSF, and accordingly, epithelial cells are shown to be highly specialized cells. They possess polarized specific transport systems that allow blood to brain influx of micronutriments or brain to blood efflux of harmful neurotransmitter metabolites and various neuroactive drugs (Spector, 1986; Davson and Segal, 1996;Suzuki et al., 1997). The choroidal epithelium is a source of and a target for hormones and other neuroactive compounds (Bondy et al., 1992; Nilsson et al., 1992; Tu et al., 1992; Yamamoto et al., 1996;Chodobski et al., 1997). Moreover, in view of the considerable local activity of catechol-O-methyl transferase and monoamine oxidase B, choroid plexuses probably represent an inactivation site and biochemical barrier for neurotransmitters (Lindvall et al., 1980). Finally, a high capacity for phase I (functionalization) and phase II (conjugation) drug metabolism has been recently described in the choroidal tissue (Johnson et al., 1993; Ghersi-Egea et al., 1994;Leininger-Muller et al., 1994; Strazielle and Ghersi-Egea, 1999). These two last features, coincident with the presence of efflux systems, hint at an additional function of choroid plexuses as a major detoxification and protective organ within the brain.
To probe into this new mechanism of brain protection, we tested whether the choroid plexus epithelium could act as an efficient enzymatic barrier impeding the blood-to-CSF transfer of 1-naphthol, a model molecule for lipid soluble xenobiotics, which is potentially cytotoxic and genotoxic (Wilson et al., 1996), and is also substrate for a uridine 5′-diphosphate (UDP)-glucuronosyltransferase (UGT), one of the conjugation enzymes largely expressed in the choroid plexus. Conjugated metabolites may in some cases be toxic, and their clearance from the cells, referred to as phase III, is a crucial step in xenobiotic metabolism (Ishikawa, 1992). We investigated as a second goal, the fate of the resulting 1-naphthyl-β-d-glucuronide (NG), and its site of export from the polarized choroidal epithelial cell. To elucidate simultaneously kinetics of transepithelial flux, metabolic processes and polarized export mechanisms, we have developed an in vitro model of the choroidal epithelium. This system, which reproduces the characteristic features of the in vivoblood–CSF barrier, consists of a polarized monolayer grown on a semipermeable membrane and allows separate access to apical, basolateral, and intracellular domains.
Some of these results have been published in abstract form (Strazielle and Ghersi-Egea, 1997a, 1998).
MATERIALS AND METHODS
Primary cell culture of choroidal epithelial cells
Animal care and procedures have been conducted according to the guidelines approved by the French Ethical Committee (decree 87–848), the European Community directive 86–609-EEC, and meet the Neuroscience Society guidelines. Timed pregnant rats were obtained from IFFA Credo (St. Germain sur l’Arbresle, France). Primary cultures of epithelial cells from 1- or 2-d-old rat choroid plexuses were prepared using a modification of the method described by Tsutsumi et al. (1989). Rat pups were killed, the brain was exposed, and choroid plexuses from fourth ventricle (4V) and lateral ventricles (LVs) were rapidly dissected under stereomicroscope and separately kept in a warm (37°C) culture medium consisting of Ham’s F-12 and DMEM (1:1) supplemented with 10% (v/v) fetal calf serum, 2 mm glutamine, and 50 μg/ml gentamycine (all reagents from Life Technologies, Gaithersburg, MD).
The tissue was rinsed twice in PBS (without Ca2+ and Mg2+) and then incubated in PBS containing 1 mg/ml pronase (Sigma, St Louis, MO) for 25 min at 37°C. Predigested plexuses were recovered by sedimentation and washed once with PBS. The supernatant containing mostly single nonepithelial cells was discarded, and the large clumps of epithelial cells were briefly shaken in 0.025% trypsin (Life Technologies) containing 12.5 μg/ml DNase I (Boehringer Mannheim, Mannheim, Germany). The supernatant resulting from sedimentation was withdrawn and kept on ice, with 10% fetal calf serum. Fresh trypsin solution was added to the tissue, and this step was repeated five times. Cells were pelleted by centrifugation at 800 × g for 5 min, and pellets were resuspended in culture media. Epithelial cells were further enriched by differential attachment on plastic dishes. After 2 hr of incubation at 37°C resulting in fibroblast, endothelial cell and macrophage adhesion to the plastic, supernatants were collected and cells were seeded on Transwell-Clear filter inserts (12 mm diameter, 1 cm2 surface, 0.4 μm pore size; Costar Plastics, Cambridge, MA) precoated on the upper side with basal lamina components at a density of 1.3 cm2/plexus from the fourth ventricle and 0.65 cm2/plexus from the lateral ventricle. The medium was changed after 48 hr, then every other day. Coating with laminin (Becton Dickinson, Bedford, MA) was as described by the manufacturer, and coating with collagen was performed according to Dehouck et al. (1990).
Culture media was supplemented with 5 μg/ml insulin, 5 μg/ml transferrin, 5 ng/ml sodium selenite, 10 ng/ml epidermal growth factor, 2 μg/ml hydrocortisone, 5 ng/ml basic fibroblast growth factor, and 500 μm hypoxanthine. Laminin-coated inserts (without cells) were kept in the same conditions. Unless otherwise stated, experiments were performed within 5–7 d after confluence.
Transepithelial electric resistance
The transepithelial electric resistance (TEER) was measured in tissue culture medium with a Millicell-ERS resistance meter (Millipore, Bedford, MA). Independent measurements were recorded on three cell culture areas for each filter and were averaged. TEER of laminin-coated, cell-free filters was measured as background and was subtracted from values of the cell-seeded filters. TEER was expressed as ohms times square centimeter. Because TEER is temperature-dependent (Misfeldt et al., 1976), care was taken to record the resistance at a constant temperature of 30°C.
Immunocytochemistry
Cells were fixed for 20 min at 4°C in 4% paraformaldehyde in PHEM buffer (in mm: 60 PIPES, 25 HEPES, 10 EGTA, 2 MgCl2, and 140 NaCl, pH 6.9). For F-actin labeling, cells were permeabilized with cold acetone (−20°C) for 1 min, followed by a 30 min incubation at room temperature in BODIPY FL-phallacidin (165 nm; Molecular Probes Europe BV, Leiden, The Netherlands). For labeling of cytokeratins and occludin, free aldehydes were quenched with 75 mm NH4Cl and 20 mm glycine in PBS for 10 min. Cells were washed in PBS and permeabilized with methanol at −20°C for 3 min, followed by a blocking step in 10% fetal calf serum in PBS for 30 min. All incubations and washes of antibodies were performed using the same buffer. Cells were incubated overnight at 4°C with either one of the following primary antibodies, anti-cytokeratin mouse monoclonal Pan (Sigma) used at 1:100 or anti-occludin rabbit polyclonal (Zymed, San Francisco, CA) used at 1:200. Controls were run with isotype IgGs (mouse from Serotec, Oxford, England and rabbit from Zymed). After four washes, FITC-conjugated anti-mouse IgG (1:50; Jackson ImmunoResearch, West Grove, PA) and BODIPY FL-conjugated anti-rabbit IgG (1:100; Molecular Probes) secondary antibodies were used for 1 hr at room temperature. After washing and mounting, the preparations were examined on a Leitz DMRB fluorescence microscope using a 40× oil immersion lens.
Transmission electron microscopy
Samples for electron microscopy were prepared on cells cultured for 8 d. Tissue or cells were fixed in 2% glutaraldehyde in 0.12m sodium cacodylate buffer and 1 mmCaCl2, pH 7.4, for 30 min at 37°C. All subsequent steps were performed at 4°C. After washing, the samples were post-fixed with 1% osmium tetroxide–1.5% potassium ferricyanide for 30 min, washed again and stained in 1.2% uranyl acetate for 20 min. Tissues were dehydrated in graded alcohol and resin-embedded.
Sections (1- to 2-μm-thick) were placed on a glass slide and stained with 1% toluidine blue for light microscopy observation. Adjacent silver-to-pale gold ultrathin sections (∼80–90 nm) were cut with a diamond knife and picked up on formvar-coated, single-slot nickel grids. Grids were then stained with uranyl acetate and lead citrate and examined on a JEOL 1200EX electron microscope.
RNA isolation and RT-PCR
Total cellular RNA was isolated from liver, choroid plexuses of newborn rat and from choroid plexus epithelial (CPE) cells at different stages of culture, according to Chomczynsky and Sacchi (1987)and used as a template for reverse transcription using oligo-dT as a primer. A 406 nt fragment was then amplified using a primer containing nucleotides 75–94 and an antisense primer corresponding to nucleotides 463–480 of the published transthyretin rat cDNA (Dickson et al., 1985). PCR products were cloned into pCR 2.1 using the TA Cloning kit (Invitrogen, Leek, The Netherlands), and the sequences were confirmed by dideoxy sequencing.
Enzymatic measurements
Choroidal tissue and choroidal cells scraped from culture inserts were homogenized in a 0.32 m sucrose, 50 mm K phosphate, 1 mm K EDTA, 0.1 mmdithiothreitol buffer, pH 7.4, using a glass-glass homogenizer. Liver and cortical tissue cleared from meninges and superficial blood vessels were also sampled from newborn rats and treated similarly for comparative purposes. The resulting homogenates were used for enzyme measurements. NADPH-cytochrome P-450 reductase activity was measured at 25°C using cytochrome c as a substrate, according to the method of Strobel and Dignam (1978) modified as previously described (Ghersi-Egea et al., 1989). The enzymatic activity of membrane-bound epoxide hydrolase was assayed at 37°C by measuring the rate of hydrolysis of benzo[a]pyrene-4,5-oxide in a spectrofluorimeter, according to the method of Dansette et al. (1970). The native activities of UGTs were measured toward 1-naphthol (Ghersi-Egea et al., 1987). The substrate (0.5 mm) was incubated with protein (150–500 μg) and UDP-glucuronic acid (4 mm) in a 30 mm Tris-HCl, 0.6 mm MgCl2 buffer at pH 7.4. The reaction was stopped by addition of ice-cold acetonitrile, and after centrifugation, the reaction mixture was analyzed by HPLC (see HPLC analysis section). Control measurements were performed by omitting either 1-naphthol or UDP-glucuronic acid in the reaction mixture. Glutathione S-transferase activity was determined according to Habig et al. (1974). Assays were conducted in 0.1m potassium phosphate, pH 6.5 at 25°C, using 1 mm glutathione and 1 mm1-chloro-2,4-dinitrobenzene (CDNB) as substrate. The complete assay mixture without protein homogenate was used as a control. The activity was strictly dependent on glutathione addition and totally inhibited after addition of 0.5 mm ethacrynic acid.
Total protein content was measured by the method of Petersen (1977), with bovine serum albumin as the standard.
Permeability studies
Culture inserts were rinsed once on both sides before initiating the permeability study. All incubations were performed on a rotating platform (250 rpm) at 37°C, and volumes added to both compartments of the insert were chosen as to be in equilibrium and to avoid any hydrostatic pressure. Some experiments were performed at 4°C. Blood-to-CSF flux will be referred to as basolateral to apical transfer, whereas CSF-to-blood flux will be referred to as apical to basolateral transfer. In both cases, the flux is from the donor to the acceptor chamber. Unless otherwise stated, sets of four filters were studied for each experimental condition. Permeability studies were performed using [14C]sucrose (350 mCi/mmol; Amersham, Little Chalfont, England), [3H]thymidine (74 Ci/mmol; Moravek, Brea, CA), [3H]phenylalanine (50 Ci/mmol; Moravek), thymidine, phenylalanine, and 1-naphthol (Sigma).
Apical to basolateral transport. Wells of a 12-well plate were filled with 1.2 ml of Ringer’s solution–HEPES buffer (in mm: 150 NaCl, 5.2 KCl, 2.2 CaCl2, 0.2 MgCl2, 6 NaHCO3, 2.8 glucose, 5 HEPES, pH 7.4). One insert covered by a confluent monolayer of epithelial cells was set into one well, and 0.4 ml of the same buffer containing a known amount of [14C]sucrose and the compound or compounds of interest, either tritiated or unlabeled, was added to the upper compartment of the insert. At regular intervals thereafter, the insert was transferred to another well to minimize the backflux of molecules from the acceptor to the donor chamber. Laminin-coated filters without cells were also run in triplicate at the same time. These inserts were however transferred at shorter intervals because of the relatively high rate of flux. For [14C]sucrose and 3H labeled molecules, the radioactivity of a 0.8 ml aliquot from each well as well as a 50 μl aliquot of the upper chamber was determined by liquid scintillation counting. The remaining acceptor medium and donor solution were sampled and analyzed by HPLC to determine the concentrations of the unlabeled compounds in both compartments (see below HPLC analysis).
Basolateral to apical transport. Ringer’s solution–HEPES buffer (1.2 ml) containing [14C]sucrose and the compound or compounds of interest was placed in one well of a 12-well plate, and an insert containing 0.4 ml of Ringer’s solution–HEPES buffer in its upper compartment was transferred to this well. At regular intervals after addition of the insert, an aliquot (whose volume could vary from 250 to 400 μl) was removed from the apical chamber and replaced with an equal volume of fresh buffer. For each sampled aliquot, a 150 μl fraction was processed for liquid scintillation counting, and the remaining fraction was assayed by HPLC. As described above, triplicate filters without cells were run simultaneously.
Calculation of flux. The flux of material across the monolayer was estimated as the amount cleared from the donor fluid (Siflinger-Birnboim et al., 1987). The volume clearance is given by the following equation:
 Equation 1where Ca is the concentration in the acceptor solution at the time of sampling, Va is the volume of the acceptor solution, and Cd is the concentration in the donor solution. The latter was corrected for each sampling period by adjusting its value for the amount of molecule cleared during the previous time point. This correction was essentially insignificant for small polar molecules but was important for highly lipophilic compounds such as 1-naphthol, or for measurements of compound flux across filters without cells. For apical to basolateral flux measurement, as the filter was transferred to fresh medium at each time point, the concentration in the acceptor fluid was therefore zero at the beginning of a sampling period. For basolateral to apical flux experiments, the acceptor solution was only partly sampled and renewed, and from the second to the last time point, Ca was corrected to account for the amount of compound remaining from the previous sampling period.
During the course of the experiment, the clearance volume increased linearly with time, whichever direction the flux was measured. The rate of clearance, equal to the slope of a plot of the cumulative volume over time, was determined by least squares regression analysis. Cd, can be assumed constant over each sampling period. With a backflux considered as negligible, the rate of clearance becomes equal to the permeability-surface area (PS) product (in microliters per minute per filter). As for electrical resistances in series, the reciprocals of the PS products of the serially arranged layers composing the cell monolayer-laminin-filter system are additive (Siflinger-Birnboim et al., 1987) and verify the following equation:
 Equation 2where PSt and PSf are the PS products determined for filters with and without epithelial cells, respectively, and PSe is the permeability-surface area product of the epithelial monolayer. The permeability coefficient of the epithelial cells, Pe (centimeters per minute) was obtained by dividing the calculated PSe value by the surface area of the filter.
Efflux and identification of metabolites
The efflux of glucuronosyl conjugates from epithelial cells was determined by incubating cells with 1-naphthol or 4-methylumbelliferone applied either to the apical or the basolateral side of the monolayer at a concentration of 50 μm, unless otherwise specified. The acceptor compartment (respectively, the lower or the upper chamber) contained Ringer’s solution–HEPES buffer and was sampled at various time points as described above. The donor solution was either sampled at regular time intervals for kinetic analysis or at the end of the experiments. Both apical and basolateral solutions were subsequently analyzed by HPLC. Export rates (in picomoles per minute per square centimeter) were obtained by dividing the total amount of glucuronide effluxed per filter by the time of the experiment. Both protocols for sampling the donor solution yielded similar results in term of export rate as the exchange of glucuronide between the two chambers was always negligible (see Results section). Identification of the glucuronosyl conjugate was conducted using β-d-glucuronidase hydrolysis as follows: 60 μl of the medium sampled after cell exposure to 1-naphthol was added to 40 μl of 150 mmacetate buffer, pH 5, containing either 10 mg/ml glucuronidase (from bovine liver, 0.041 U/mg; Fluka, Buchs, Switzerland), or 20 mmd-saccharic acid 1,4-lactone (Sigma), a specific inhibitor of glucuronidase, or both the glucuronidase and its inhibitor, and incubated for 2 hr at 37°C. The glucuronidase preparation being available as a thick protein suspension, proteins were precipitated at the end of the incubation by addition of 50 μl of cold acetonitrile, and pelleted at 10 000 rpm for 10 min. An aliquot of the resulting supernatant was analyzed by HPLC following the protocol described below.
For isolated choroid plexus experiments, 4V choroid plexuses were excised as previously described and transferred to Ringer’s solution–HEPES buffer at 37°C for a 5 min recovery period. They were then incubated under agitation (400 rpm) in a 50 μm1-naphthol solution. At regular intervals (10, 20, 30, and 40 min), the incubation medium was recovered and replaced with fresh 1-naphthol. After the incubation, the plexuses were briefly rinsed in ice-cold Ringer’s solution–HEPES buffer and digested in 1 mm NaOH for glucuronide determination. The amount of NG present in the medium at the end of each sampling period and in the tissue at the end of the experiment was measured by HPLC. For that purpose, control choroid plexuses were incubated in parallel in the absence of 1-naphthol.
HPLC analysis
1-naphthyl-β-d-glucuronide was detected and quantified in the supernatant obtained from both UGT enzymatic activity and β-d-glucuronidase hydrolysis assay incubations by using a reverse phase HPLC procedure performed on a LC10 Shimadzu system (Duisburg, Germany) as follows: Samples (20–50 μl) were applied with an auto injector device (SIL-10Axl), cooled at 4°C, onto an Ultrasphere ODS RP-18 analytical column (3 μm, 4.6 × 75 mm; Beckman, Fullerton, CA) equipped with a RP-18 guard column. Sample elution was isocratic, using a mobile phase of a 16.5:0.5:83 mixture of acetonitrile/acetic acid/water pumped at a constant rate of 1 ml/min with a LC-10AT pump. Absorbance of the effluent was monitored at 285 nm using a UV variable wavelength detector (SPD10A). All chromatograms were run at room temperature. Retention times for NG and 1-naphthol were 8 and 38 min, respectively. Quantification was performed from calibration curves based on the peak areas obtained after injection of standard solutions. The detection threshold was 1 pmol for NG. For chromatogram clarity the chromatographic profiles obtained for incubations realized in the presence of glucuronidase were corrected by subtracting the profile obtained for a similar incubation, except that 1-naphthol was omitted in the original cultured cell incubation.
The subsequent routine quantification of 1-naphthol and of its glucuronosyl-conjugate in the Ringer’s solution–HEPES buffer incubation medium was realized by direct injection of the samples into the HPLC apparatus, using similar analytical condition except that a mobile phase of a 22:0.5:77.5 mixture of acetonitrile–acetic acid–water was used to reduce the retention time of NG and 1-naphthol to 3.5 and 20 min, respectively. Experiments using 4-methylumbelliferone as substrate were realized and quantified in a similar way, except that the detector was set at 317 nm, and the mobile phase used was a 14.5:0.5:85 mixture of acetonitrile–acetic acid–water, leading to retention times of 2.4 and 10 min for 4-methylumbelliferyl-β-d-glucuronide and 4-methylumbelliferone, respectively. For thymidine transfer experiment, the HPLC quantification of the compound was realized by direct injection of incubation medium onto a TSK gel super ODS column (Tosohaas, Montgomeryville, PA). With the UV detector set at 266 nm and an isocratic elution using a 3.5:76.5 mixture of acetonitrile–water as the mobile phase, the retention time for thymidine was 3.6 min. For each set of transfer experiments, one filter was run in the same manner, except that the compound studied was omitted from the cell incubation system. The collected apical and basolateral media were then analyzed by HPLC to check that no material, possibly released from the filter/cell system, coeluted with the compounds investigated or their metabolites.
Effect of temperature on NG efflux
Epithelial cells were incubated with 20 μm1-naphthol in the apical chamber and allowed to accumulate the corresponding glucuronide for 20 min at 37°C. Monolayers were then washed extensively in ice-cold Ringer’s solution–HEPES buffer until the remaining substrate was fully eliminated, as monitored by HPLC analysis of the washing solutions, and further incubated with fresh buffer in both compartments either for 2 × 10 min at 4°C or 37°C or for 10 min at 4°C followed by 10 min at 37°C. The efflux of the metabolite was quantified in both chambers by HPLC.
Probenecid-sensitivity of NG efflux
Cells were exposed apically to 50 μm 1-naphthol as a substrate and NG efflux was monitored in both chambers. Probenecid (dissolved in DMSO) was added to both compartments, and its possible effect on the monolayer tightness was assessed by measuring apical to basolateral transfer of [14C]sucrose. Control experiments were run using DMSO alone. Wells of a 12-well plate were filled with 1.2 ml of Ringer’s solution–HEPES containing probenecid or DMSO. Inserts covered with cells were set into wells, and 0.4 ml of buffer containing [14C]sucrose, 1-naphthol, and probenecid or DMSO (donor solution) was added to the upper compartment of the inserts. At 20 and 40 min, the insert was transferred to another well. Simultaneously, the 400 μl upper solution was removed and replaced with an equal volume of fresh donor solution. Aliquots of the lower chamber were radioassayed for [14C]sucrose as described above. Samples from both chambers were analyzed by HPLC. At the end of the efflux experiment (time 60 min), the cells were washed by two quick immersions in a large volume of ice-cold Ringer’s solution–HEPES buffer, followed by two 5 min incubations in ice-cold buffer on a rocking platform. Membranes were cut from the inserts, and cells were lysed by freeze-thaw cycles in 100 μl distilled water. Proteins were precipitated by 70 μl acetonitrile and centrifuged. The supernatant was recovered, and the intracellular NG was assayed by HPLC as described above.
Competition experiments
Epithelial cell monolayers were loaded with the glutathione S-conjugate, 2,4-dinitrophenyl glutathione (GS-DNP) by apical exposure to 1 mm CDNB for 10 min at 37°C, followed by a 15 min period at 18°C. This second period enables to reach an appreciable pool of competitor within the cells as it reduces transport of GS-DNP out of the cells without reducing the GS-DNP formation rate (Lam et al., 1992; Evers et al., 1996). After loading, each filter was positioned in a 12-well plate containing 1 ml of Ringer’s solution–HEPES buffer in each well, and the apical medium was replaced with 0.3 ml of the donor solution containing 1 mm CDNB, 20 μm 1-naphthol, and [14C]sucrose. NG efflux was monitored in both chambers as described above, except that the volume sampled and replaced in the upper chamber at each interval was 150 μl. The intracellular amount of NG was determined as described above. Control filters were incubated in parallel with 0.25% ethanol instead of CDNB.
RESULTS
Rat CPE cells in primary culture form a polarized monolayer on laminin-coated filters
In addition to the morphological differences between choroid plexuses from the lateral, third, and fourth ventricles, biochemical differences were also reported (Strazielle and Ghersi-Egea, 1997b). Separate primary cultures of epithelial cells were therefore initiated from plexuses harvested from LV and 4V. Because the characteristics and properties investigated in this study were similar for both types of culture, results will be presented only for one type of cell or the other. Cells were prepared according to Tsutsumi et al. (1989), by which isolation of epithelial cells versus other types of cell is achieved by differential sedimentation and attachment. The mild enzymatic dissociation step yielded a final epithelial cell suspension comprising only a few single cells and mainly small cell clusters. Therefore, accurate cell counting was not feasible, and the cell suspension was plated on a surface area per choroid plexus basis. This cell dilution procedure gave consistent results with regard to the course of establishment of optical confluence and barrier properties. Cell attachment on laminin-coated filters occurred within 24–36 hr and was complete after 48 hr, at which time the media was changed. The cells achieved optical confluence within 2–3 d after plating. They grew as densely packed small polygonal cells and produced a monolayer displaying a typical cobblestone appearance (Fig.1A).

Morphology and phenotype of primary culture of rat CPE cells. Phase-contrast micrographs of 8-d-old CPE cells cultured on laminin-coated filters (A) shows a typical cobblestone arrangement of polygonal cells, whereas a heterogeneous cellular population that includes fibroblast-like elongated cells is observed when rat tail collagen-coated filters are used (B). The light micrograph of a 1-μm-thick cross section (C) shows a confluent 8-d-old monolayer of CPE cells lying on the laminin-coated permeable filter. Higher magnification of CPE cell monolayer (D) illustrates the presence of numerous microvilli (arrows) decorating the apical cell surface. The immunofluorescence assay using anti-cytokeratin antibodies (E) shows a positive staining of the cells. Scale bars: A–C, 20 μm; D, E, 10 μm.
Choosing the appropriate substrate used to reconstitute a basement membrane was found to be a crucial step for achieving the further selection of epithelial cells. When plated on collagen-coated filters, cells failed to establish the hydrodynamic barrier that they formed on laminin-coated filters (see below), and inverse phase optical microscopy revealed the presence of clusters of fibroblast-like elongated cells that tended to overgrow the epithelial cells (Fig.1B). These contaminating cells were not observed on laminin-coated filters (Fig. 1A), even after extended periods of culture (up to 12 d). Coating of Transwell-COL (already precoated with collagen by the manufacturer) with laminin did not improve the selectivity or the establishment of the barrier phenotype (data not shown).
The epithelial phenotype of the cells was further demonstrated by positive staining with a mixture of anti-cytokeratin monoclonal antibodies that recognize among others the simple epithelial types of keratins (8, 18, and 19) known to be expressed in vivo in the CPE cells (Miettinen et al., 1986; Fig.1E). Variation in fluorescence intensity among the cell population is likely to reflect the differential expression of the various cytokeratin subtypes.
The 1-μm-thin cross-sections confirm that after 8 d of culture on laminin-coated filters, the cells formed a monolayer of bulging cuboidal cells with morphological asymmetry (Fig.1C). In particular, the dome-shaped apical surface was studded with microvilli extending upward into the medium (Fig.1D).
Transmission electron microscopy was performed to confirm the extent to which cells in culture displayed ultrastructural features characteristic of the cells in situ. Eight-day-old monolayers displayed cuboidal cells with distinct cell surface domains. At the luminal or apical surfaces, the cells presented uneven borders of thin cytoplasmic processes resembling tightly packed elongated microvilli (Fig. 2A). Intercellular junctional complexes were observed at the apical end of the lateral faces of contiguous cells as electron dense areas (Fig.2B), closely mimicking the zonula adherens and zonula occludens organization observed in the CPE cells in situ(data not shown; Peters et al., 1991). Beneath these junctions, the plasma membranes of these lateral cell surfaces ran more or less parallel to each other, extending near the basal region, in extensive interdigitations forming characteristic complex infoldings (Fig.2C).

Ultrastructure of newborn rat CPE cells cultured on laminin-coated filters. Transmission electron micrographs of cultured CPE cells demonstrate the ultrastructural features of a polarized epithelial cell monolayer such as an abundant border of elongated microvilli associated with the apical surface (top panel; scale bar, 0.5 μm), tightly apposed lateral membrane with complex apical junctions organized as zonula adherens and zonula occludens association (arrow), and gap junction (arrowhead) (bottom left panel; scale bar, 0.25 μm), and complex interdigitations (★) at the basolateral side (bottom right panel; scale bar, 0.25 μm).F, Porous filter.
CPE cells develop functional barrier properties and establish intercellular tight junctions
An essential feature of the choroidal epithelium in vivo is the formation of a semipermeable barrier to the passage of solutes, that is based on sealing apical tight junctions between neighboring epithelial cells. The in vitro establishment of barrier properties can be tested by monitoring transepithelial electrical resistance of cells cultured on permeable supports and by measuring the paracellular (intercellular) flux of small molecular weight hydrophilic tracers. Therefore, TEER and the clearance of sucrose were measured in parallel from the first day of culture to up to day 8 and were used as evidence for the development of functional tight junctions in the monolayers. With cell optical confluence at day 2, TEER across the cell layers became significantly higher than the resistance measured on laminin-coated filters and rapidly increased until it reached a plateau around day 6 (Fig.3A). The value of 178 Ω × cm2 at day 8 is similar to the TEER measuredin vivo in bullfrog choroid plexus (Saito and Wright, 1983). Permeability to sucrose was inversely related to the electrical resistance and was gradually impeded, to reach at day 8, a Pe value of 0.43 × 10⁻³ ± 0.02 × 10⁻³ cm/min (Fig. 3B). Consistent with the establishment of intercellular junctions, this value increased dramatically to 12.07 × 10⁻³ ± 2.21 × 10⁻³cm/min when sucrose flux was measured in the absence of extracellular Ca2+ and Mg2+, that are required for junction integrity. Indicative of an insignificant fibroblast contamination in the monolayer, neither cis-hydroxyproline, nor cytosine β-d-arabino-furanoside, when added to the culture medium as classical inhibitors of fibroblast growth, decreased the flux of sucrose across the monolayer (data not shown).

Establishment of barrier properties by cultured CPE cells. A, Development of transepithelial resistance in LV CPE cell monolayer. Note the marked increase in electrical resistance between days 2 and 6. Values are expressed as mean ± SD obtained from four different filters and are corrected for the mean electrical resistance of four laminin-coated filters. B, Development of a permeability barrier in LV CPE cell monolayer. Apical to basal flux of [14C]sucrose was measured for 60 min. Pe values are expressed relative to Pe at day 8, as mean ± SD obtained from four different filters. Pe decreased as a function of culture time. The Pe measured on 8-d-old cultured cells raised from 0.43 × 10⁻³ ± 0.02 × 10⁻³ cm/min when the transfer experiment was performed in standard condition to 12.1 × 10⁻³ ± 2.2 × 10⁻³cm/min when the transfer experiment was performed in Ca2+/Mg2+-free buffer that disrupts the tight junction organization. C, Generation of a hydrodynamic barrier at day 2. When culture medium is changed on the second day after plating, CPE cell monolayers on laminin-coated supports (filter on the right) impede, during the next 48 hr, the hydrodynamic equilibration of fluids between the two chambers, unlike CPE cells on collagen-coated filters or optically confluent filters seeded with fibroblasts (filter on the left).
Furthermore, CPE cells generated a hydrodynamic barrier as early as day 2 after seeding (Fig. 3C). Volumes of medium added in both chambers on that day were such as to create a difference in fluid levels, the level being higher in the upper reservoir, to generate a hydrodynamic pressure. CPE cell monolayers were able to maintain this hydrodynamic imbalance for the next 48 hr, and for each interval of time between later medium renewals. In contrast, CPE cell monolayers cultured on collagen filters and containing fibroblast-like cells, or filters covered with fibroblasts at high density, failed to maintain this hydrodynamic difference, which was dissipated in <12 hr (overnight).
The intercellular junctional structures, that are crucial for the epithelium to generate electrical gradients and regulate its permeability, are complex and include transmembrane proteins interacting with cytoplasmic partners and with the cytoskeleton. In particular, the transmembrane protein occludin, exclusively localized at tight junctions in epithelia, has been demonstrated to contribute to the paracellular seal and interact indirectly via ZO-1 with an adjacent perijunctional ring of actin, that also regulates the tight junction permeability (Fanning et al., 1998). Both occludin and actin intracellular distribution was investigated in 8-d-old CPE cell monolayers. Staining with phallacidin showed a marginal arrangement of actin filaments, consistent with a continuous belt lining the cell membrane (Fig. 4A). In a similar pattern, an anti-occludin antibody stained a junctional ring with no apparent discontinuities (Fig. 4B). Both markers confirmed the establishment in CPE cell primary cultures of tight junctions previously suggested ultrastructurally by EM and functionally by TEER and sucrose permeability data.

Distribution of junction-associated proteins in cultured CPE cells. Eight-day-old CPE cells grown on laminin-coated filters were labeled with phallacidin for actin staining (A) or with antibodies against occludin (B). Both markers showed a continuous circumferential distribution consistent with the establishment of tight junctions in CPE cell monolayers. Scale bar, 10 μm.
CPE cell monolayers express the choroidal specific protein transthyretin and retain transport systems
Brain transthyretin is mostly synthesized and secreted by the epithelial cells of the choroid plexus, for which it is regarded as a tissue-specific and differentiation marker (Kato et al., 1986). Transthyretin mRNA expression was investigated in cultured CPE cells by reverse PCR, in comparison to freshly isolated choroid plexuses from newborn rat (Fig. 5). After 3 and 8 d of culture, epithelial cells from the lateral ventricle choroid plexus continued to express transthyretin mRNA demonstrating the highly differentiated status of the in vitro choroidal epithelium. Northern blot analysis was performed using as a cDNA probe, the fragment amplified by PCR. It was also confirmed that 4V CPE also retained this specificity and marker of differentiation, and that in both types of cultured cells, messenger levels are maintained at equivalent levels during the course of the culture (data not shown).In vitro uptake studies using isolated/perfused choroid plexuses and some in vivo experiments have shown that carrier-mediated transport of amino acids and nucleosides takes place at the choroid plexus (Spector, 1985; Segal et al., 1990; Thomas and Segal, 1996). The ability of the epithelial barrier to transport such compounds was examined on 8-d-old CPE cell monolayers (Table1). 4V CPE cells were exposed on the basolateral side to phenylalanine at a low concentration of 2 μm. The permeability measured was much higher than that of sucrose. Furthermore, increasing the concentration of phenylalanine to 500 μm reduced significantly the cell monolayer permeability to the amino acid by >60%. These results are consistent with a saturable carrier-mediated transport of the amino acid. Self-inhibition of thymidine transport also was demonstrated on LV CPE cells with a significant decrease of 35% in the Pe value between 5 and 800 μm.

Expression of transthyretin in CPE cells. Total mRNA preparations isolated from newborn rat 4V (lane 3) and LV (lane 4) choroid plexuses, 3-d-old LV CPE cells (lane 5), and 8-d-old LV CPE cells (lane 6) were reverse transcribed with oligo-dT. The 406-bp-long fragment amplified using oligonucleotides specific for transthyretin in samples from both fresh tissue and cellular cultures shows that transthyretin mRNA expression is maintained in cultured cells. Newborn rat liver mRNA (lane 1) and cultured glial cells mRNA (lane 7) were processed in parallel as positive and negative control, respectively. Lanes 2 and 8 contain DNA molecular weight markers.
Basolateral to apical saturable transport of [3H]phenylalanine and [3H]thymidine across CPE cell monolayers
The high drug metabolism activity of choroid plexus is maintained in cultured CPE cells
The elevated metabolic capacity toward xenobiotics that is characteristic of choroidal tissue was evaluated in the in vitro model. Drug metabolism classically involves phase I enzymes, which create or modify a functional group on a generally lipophilic substrate and phase II enzymes, which conjugate the functional group of xenobiotics or of their primary metabolites with various polar cosubstrates. The specific activity of two phase I enzymes, the membrane-bound epoxide hydrolase and NADPH cytochrome P-450 reductase, and two phase II enzymes, UGT and glutathioneS-transferase (GST), were measured in 7- to 9-d-old LV and 4V CPE cells, in comparison to freshly isolated plexuses, as well as in liver and cerebral cortex from newborn rat (Fig.6). For all the enzymes, the activity was maintained in the cultured epithelial cells, at levels not significantly different from those measured in the corresponding freshly isolated plexuses. These activities are comparable to the levels measured in the liver, which is the major organ responsible for drug metabolism, and, with the exception of NADPH cytochrome P-450 reductase activity, which is high in brain tissue at early developmental stages (Ghersi-Egea et al., 1989), are 7- to 30-fold higher than in the overall cortex. These data indicate that (1) the xenobiotic metabolism capacity of choroid plexus is at least for a large part attributable to the choroidal epithelium, although other cells from the stromal core could also contribute to this function, and (2) CPE cells after 8 d in culture retain this drug metabolism specificity.

Xenobiotic metabolism enzyme activities in CPE cells. Homogenates of freshly isolated choroid plexuses (solid columns) and CPE cells cultured for 8 d (dashed columns) from either lateral ventricle (LV) or fourth ventricle (4V) were assayed for four drug-metabolizing enzyme activities: the membrane-bound epoxide hydrolase (mEH), UDP-glucuronosyltransferase-conjugating planar substrates (1-naphthol UGT), NADPH cytochrome P-450 reductase (Reductase), and glutathioneS-transferase (GST). For comparison, activities measured in freshly isolated liver (Li) and cerebral cortex (Cx) homogenates are also reported. All four activities measured in cultured cells were close to those measured in fresh choroidal tissue and reached hepatic levels. Note the large, statistically significant (two-tailed t test for unequal variance) differences in the level of mEH, 1-naphthol UGT, and GST activities when any choroidal material was compared with cerebral cortex. Data are expressed as mean ± SD; n = 3–7.
The choroid epithelium forms an effective metabolic barrier through conjugation pathway
The in situ metabolic capacity of cultured epithelial cells and its possible implication and consequences on xenobiotic transfer through the monolayer was investigated using 1-naphthol, a cytotoxic compound which is used as a model of lipid soluble substrate.
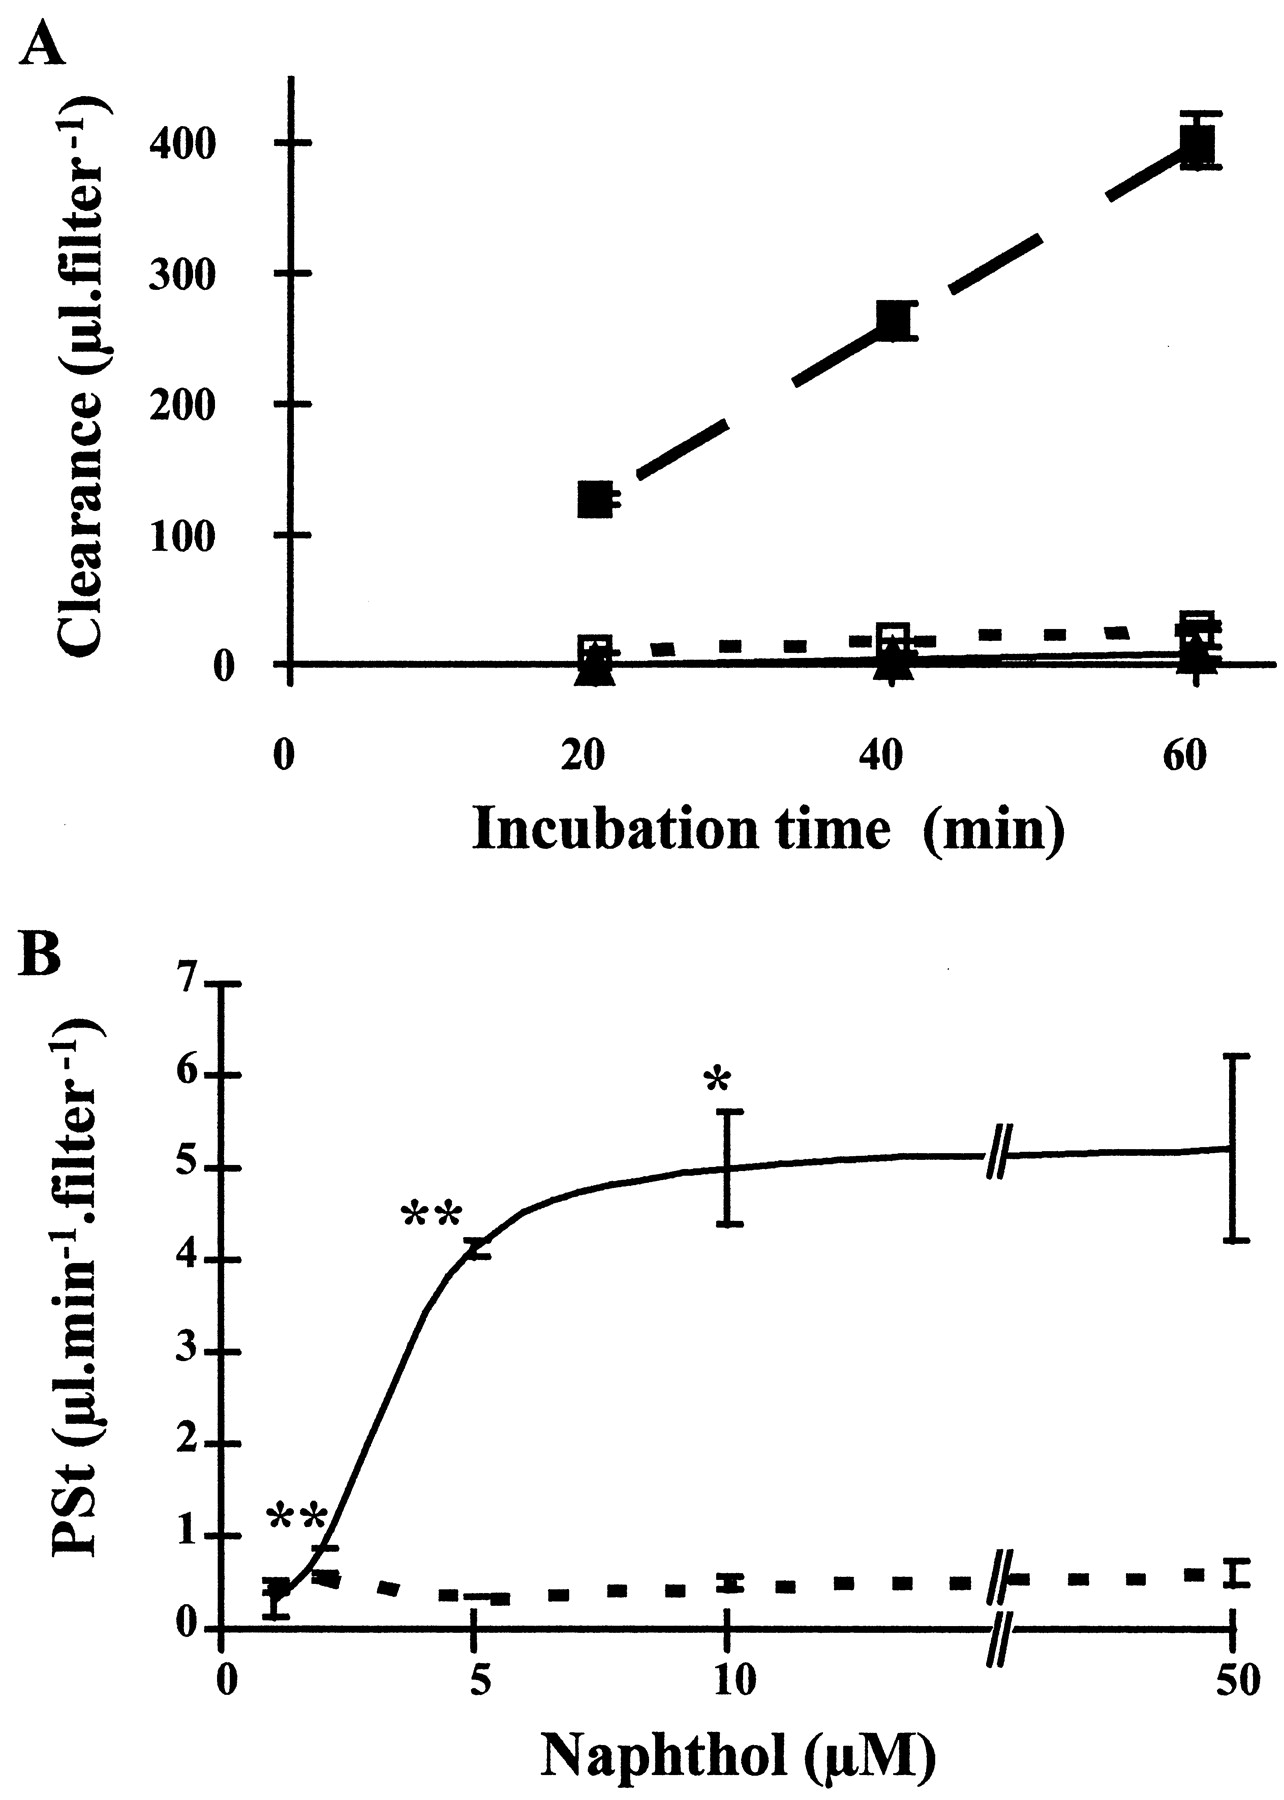
As expected from its strong lipophilicity (indicated by an octanol/pH 7.4 buffer partition coefficient of 248) (B. Leininger-Muller, personal communication), 1-naphthol diffused readily across the choroidal monolayer, with a clearance rate considerably higher than that of sucrose. In the experiment illustrated in Figure7A, apical to basolateral PSt values were 6.85 ± 0.36 and 0.46 ± 0.07 μl · min−1 · filter−1for 50 μm 1-naphthol and for sucrose, respectively. The process was linear over the time period studied (60 min) and was independent of the direction of transfer as a similar plot could be obtained for basolateral to apical transfer (data not shown). When 1-naphthol was used at a concentration of 50 μm, the permeability coefficients Pe were calculated to be 12.55 × 10⁻³ ± 4.88 × 10⁻³cm/min and 12.95 × 10⁻³ ± 1.82 × 10⁻³ cm/min (n = 4) for basolateral to apical and apical to basolateral transfer, respectively.

Metabolic barrier effect of choroidal epithelial cells on the transcellular passage of the lipophilic compound 1-naphthol. A, Clearance of 1-naphthol. One micromolar (triangle) or 50 μm (filled square) 1-naphthol and [14C]sucrose (open square) as a tracer were added to the abluminal side of cells and renewed every 10 min to maintain the concentration close to a constant level in the donor compartment. The upper chamber was sampled every 20 min. All results are expressed as mean ± SD (n = 3). All three clearance curves were linear. The large difference in the clearance of 1-naphthol between the two concentrations of the compound can be quantified by calculating the corresponding PSt values which are for this particular experiments of 0.17 ± 0.07, 6.85 ± 0.36, and 0.46 ± 0.07 μl/min for 1 μm, 50 μm 1-naphthol, and [14C]sucrose, respectively. B, Effect of 1-naphthol concentration on its influx rate across the CPE cell monolayer. Cells were exposed on the abluminal membrane to decreasing concentrations of 1-naphthol (solid line) and to tracer concentration of [14C]sucrose (dotted line). PSt values, determined from the slopes calculated between 10 and 60 min, decreased with decreasing concentration of 1-naphthol, and for 1 μm reached sucrose value. All values are mean ± SD (n = 3 to 5 from two experiments). Differences in 1-naphthol PSt values between a given concentration and the one below were determined by a one-tailed t test for unequal variance, *p < 0.05; **p < 0.01. For all concentrations, except for 1 μm, PStvalues for 1-naphthol and sucrose were significantly different (p < 0.01) by a two-tailed ttest for unequal variance.
When cells were incubated with decreasing concentrations (10, 5, 2, and 1 μm) of the lipophilic molecule in the basolateral chamber, the clearance of the compound was strongly reduced, leading to an almost complete inhibition of 1-naphthol diffusion in the opposite chamber for concentration <2 μm (Fig. 7B). Indeed, the permeability coefficient calculated for 1 μm1-naphthol was 0.35 × 10⁻³ ± 0.24 × 10⁻³ cm/min (n = 5), and was not statistically different from that of sucrose (0.49 × 10⁻³ ± 0.07 × 10⁻³cm/min) whose transfer rate was measured simultaneously as an indicator of paracellular pathway. As indicated by the linearity of the clearance curve obtained for 1 μm 1-naphthol (Fig. 7A), the barrier effect occurred immediately and could not be accounted for by 1-naphthol depletion because our experimental conditions ensured that <10% of the initial amount of 1-naphthol was cleared from the donor chamber by the end of the sampling period.
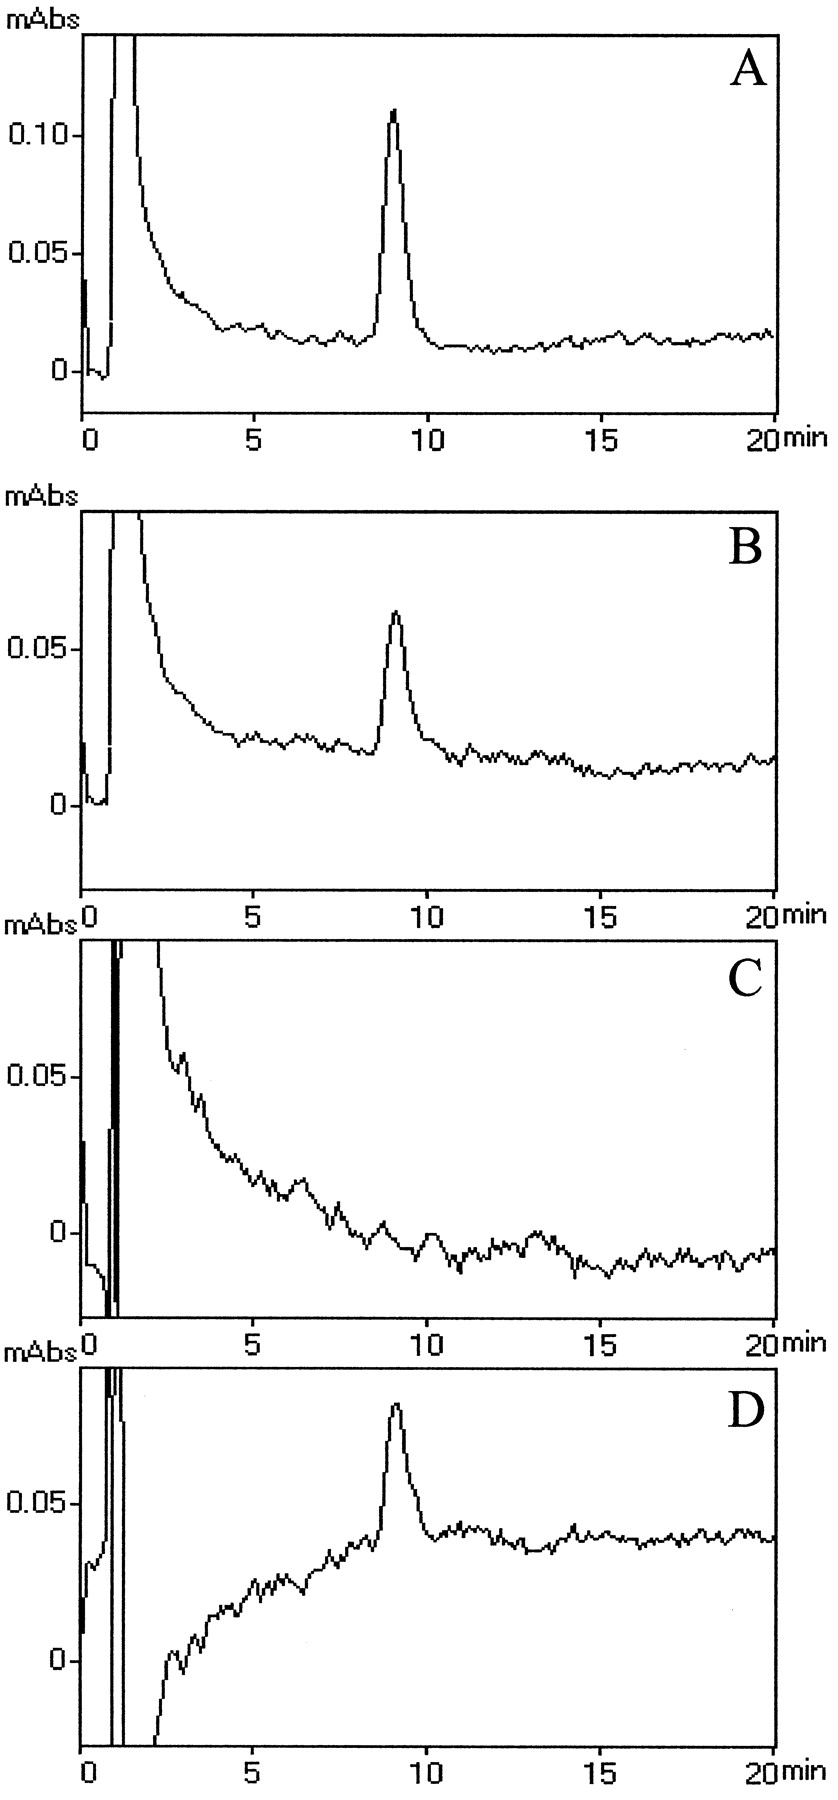
Based on these results, it was postulated that epithelial cell drug metabolizing enzymes could actually form an enzymatic barrier to xenobiotic flux, which thus implied the intracellular production of metabolites and their eventual excretion either at one or at both poles of the polarized cells. Because 1-naphthol is substrate for the UGT isoform that conjugates planar phenols, the glucuronosyl conjugate of this compound was primarily investigated in both apical and basolateral transfer solutions. The analysis of HPLC elution profiles revealed in samples collected from either chamber a peak that was not present when transfer of 1-naphthol was performed on filter without cells, and had a retention time identical to that of NG (Fig.8, compareA, B). The identity of the compound released from CPE cells was further assessed by its susceptibility to β-glucuronidase cleavage. Incubating the transfer solution with β-glucuronidase led to a complete disappearance of the signal, whereas in parallel incubations realized in absence of β-glucuronidase, this peak remained unchanged (Fig.8B,C). To confirm the specificity of a β-glucuronidase-mediated cleavage of the compound, similar glucuronidase incubations were performed in the presence of 20 mmd-saccharic acid 1,4-lactone, a specific inhibitor of the enzyme. The persistence of the peak eluted at 8 min (Fig. 8D) demonstrated that the compound released by CPE cells was indeed generated by glucuronidation.

Reversed phase HPLC identification of 1-naphthyl-βd-glucuronide as the metabolite released by cultured epithelial cells during exposure to 1-naphthol.A, HPLC profile obtained from a standard solution of 1-naphthyl-β-d-glucuronide. We injected 19 pmol of glucuronide. B, HPLC profile obtained from the cell incubation medium when β-glucuronidase is omitted from the reaction mixture, shows a peak coeluting with 1-naphthyl-β-d-glucuronide. C, Exposure to β-glucuronidase leads to a complete disappearance of the metabolite.D, Specific inhibition of β-glucuronidase byd-saccharic acid 1,4-lactone prevents the hydrolysis of 1-naphthyl-β-d-glucuronide present in the cell incubation medium. C and D profiles are corrected as described in Materials and Methods. When present (B–D), 1-naphthol eluted at 40 min.
Export of glucuronosyl conjugates by CPE cells is a transporter-mediated polarized process
Because CPE cells form a tight monolayer delimiting two separate compartments, it became possible to investigate the kinetic of NG export across each membrane. The inset in Figure9A illustrates as an example, the time course of NG efflux from 4V CPE cell monolayers exposed on both membranes to 50 μm 1-naphthol, and shows that the export of the metabolite was linear and occurred immediately in both chambers. However, a striking difference in the curve slopes was observed. The basolateral and apical export rate values calculated from repeated experiments were of 16.88 ± 2.72 and 6.51 ± 1.25 pmol · min−1 · cm−2, respectively (n = 10 filters from four cell preparations; Fig. 9A). Because the apical membrane of CPE cells has a brush-border of microvilli, it is likely to present a much larger surface area available for exchange than the basolateral membrane. Therefore, the 2.63 ± 0.35-fold higher secretion of the glucuronide in the bottom chamber indicates a strongly polarized process, resulting in preferential metabolite elimination at the blood-facing membrane. A similar cell polarity was observed on LV CPE cell monolayers with a basolateral to apical ratio of 2.66 ± 0.49 (n = 5 filters from two cell preparations) for the glucuronide efflux.

Polarized efflux of 1-naphthyl-β-d-glucuronide from 8-d-old CPE cell monolayers and from isolated choroid plexus. A, Cells from 4V choroid plexuses were incubated with 50 μm1-naphthol in both compartments, which were renewed every 10 min (see Materials and Methods for details). Samples were taken from both the apical and the basolateral chambers every 10 min for 50 min and assayed for 1-naphthyl-β-d-glucuronide. Data from one experiment are shown as an example in the inset in which the cumulated amount of glucuronide excreted (in picomoles per square centimeter) is plotted versus time. Each time point is a mean value of two filters. The efflux process was linear over the 50 min period in the apical (triangle, solid line) and in the basolateral (square, dotted line) compartments. The export rates expressed in picomoles per minute per square centimeter (mean ± SD; n = 10 from four experiments) show a strong polarity of the efflux with 72% of the glucuronide released at the blood-facing membrane of the cells (BL, basolateral compartment; A, apical compartment). B, Isolated 4V choroid plexuses were incubated with 50 μm 1-naphthol. The incubation medium was changed every 10 min for 40 min and assayed for 1-naphthyl-β-d-glucuronide. At the end of the experiment, plexuses were digested, and their content in glucuronide was measured. Values expressed as picomoles effluxed (in case of incubates) or contained (in case of isolated tissue) per plexus are mean ± SD (n = 3). The increasing efflux during the three first sample periods and the large amount of NG retained in the tissue is another indication of a major basolateral, i.e., stroma-facing efflux from the choroidal epithelium, before its secondary release from the stroma into the incubation medium. Differences between one time point and the previous one were determined by a one-tailedt test for unequal variance, **p < 0.01.
As a further evidence of polarity, Figure 9B shows that NG was produced by isolated choroid plexuses and released in the incubation medium, but in contrast to the export kinetic observed on CPE cell monolayers, this release was nonlinear and increased significantly during the first three sampling periods, coming to a plateau between 30 and 40 min. Moreover, a large amount of NG was retained in the tissue, most likely in the stromal compartment delineated by the tight choroidal epithelium rather than intracellularly (see below for intracellular amount of NG in the cultured cells). This data, and the delay in reaching a steady-state efflux rate in the incubation medium are in favor of a preferential basolateral export of NG, i.e., into the stromal compartment of the isolated choroid plexus, before its release in the incubation medium.
As this polarized efflux is indicative of a transporter-mediated mechanism rather than a passive diffusion process, the temperature-dependence of NG efflux was investigated. CPE cells loaded with NG and maintained at 37°C rapidly exported the metabolite in the incubation medium (Fig. 10). The efflux was almost fully inhibited when cells were kept at 4°C (with a respective inhibition of 100 and 92% for the two efflux periods). When cells kept at 4°C for 10 min were rewarmed to 37°C, NG efflux resumed immediately and was comparable to that of cells kept at the higher temperature. By contrast, decreasing the temperature from 37 to 4°C led to a reduction of only 3.8- and 3.3-fold in respective PSt values for sucrose (as a paracellular marker) and 1-naphthol (used as a model molecule for the passive diffusion process; data not shown). The total inhibition of NG export is thus further evidence for a transport process.

Effect of temperature on NG efflux from CPE cell monolayer. After a 20 min incubation at 37°C in 20 μm1-naphthol to allow for NG accumulation, LV CPE cells were rinsed at 4°C. Efflux was then measured either for 2 × 10 min at 37°C, or 4°C, or for 10 min at 4°C followed by 10 min at 37°C. Values (in picomoles per square centimeter) represent the mean ± SD (n = 3) of the total amount of glucuronide excreted from the cell monolayer during the incubation period. The absence of glucuronide release when cells were kept at 4°C indicates that a transport process rather than passive diffusion is involved in the efflux of NG. When cells were rewarmed at 37°C, the efflux resumed immediately. Filled columns, Efflux from 0 to 10 min;hatched columns, efflux from 10 to 20 min.
To assess whether the membrane transport process was unidirectional or bidirectional, we measured the passage of extracellularly added NG across the cell monolayer in both directions (Table2). The permeability of CPE cells to the glucuronide was always slightly lower than that of sucrose, whichever membrane was exposed to the molecules (p < 0.01, paired t test). No statistical differences in glucuronide Pe values were found either between the low and high concentrations of NG or between the two transfer directions. These data indicate that (1) NG is not lipophilic enough to passively cross the membranes to a significant extent (as predicted for a glucuronosyl conjugate), and (2) the polarized NG efflux we demonstrated is unidirectional and outwardly directed, i.e., mediated by an active transport rather than a facilitated diffusion process.
Passage of extracellular 1-naphthyl-β-d-glucuronide across CPE cell monolayer
The apparent affinity of this metabolism–efflux process for 1-naphthol was then investigated. Varying the concentration of 1-naphthol in the medium from 500 to 1 μm changed neither the rate of glucuronide production nor the polarity of efflux (data not shown). Only for a concentration of 0.4 μm was the efflux rate decreased by 21.2 ± 12.8% (n = 3), without change in the polarity. Lower concentrations could not be tested as the substrate was cleared too fast for the extracellular concentration to remain constant over the sampling period. Therefore, with an apparent affinity constant <0.4 μm, the overall affinity of the metabolism–efflux process occurring at the cultured cell monolayer is rather high for 1-naphthol and explains the total barrier effect observed when 1-naphthol concentration was <2 μm (see Discussion). The apparent affinity constant of UGT toward 1-naphthol, determined on newborn rat choroid plexus homogenate, was found to be 1.6 μm (data not shown). This value is slightly higher than the apparent affinity constant measured for the metabolism–efflux of NG in CPE cells, a difference that could be accounted for by a moderate concentration of the substrate in the cells. Indeed, assuming an average cell height of 8 μm, the intracellular concentration of 1-naphthol at the end of the experiments was estimated to be fivefold to eightfold higher than the actual 1-naphthol concentration used in the incubation medium (data not shown).
Export of NG by CPE cells is probenecid-sensitive and is shared by other conjugates
The substrate specificity of the transporter involved in NG efflux was tested toward a different glucuronosyl conjugate. For that purpose, 4V CPE cells were exposed to 50 μm4-methylumbelliferone, another UGT substrate, and the efflux rate of the corresponding metabolite 4-methylumbelliferyl-β-d-glucuronide, was determined in both compartments. Basolateral and apical export rate values were, respectively, 6.94 ± 0.60 and 2.18 ± 0.12 pmol · min−1 · cm−2(n = 3), yielding a basolateral to apical ratio value of 3.2, fairly similar to that of NG. These data suggest that both glucuronides are exported via the same transporter, which thus, must exhibit some specificity toward the glucuronosyl moiety.
Because glucuronides are organic anions, we tested whether probenecid, a commonly used inhibitor of multispecific organic anion transport systems, had any effect on NG efflux from CPE cells. When 4V monolayers were exposed to 50 μm 1-naphthol in the presence of probenecid, NG export was reduced at both membranes to a similar extent and in a dose-dependent manner: 1 mm probenecid had a slight 12% decrease effect (p < 0.05), whereas 4 mm probenecid caused a 65–75% inhibition (p < 0.01) (data not shown; Fig.11). Higher doses of the inhibitor were not used because a slight increase in sucrose Pe was observed for 4 mm (0.47 × 10⁻³ ± 0.05 × 10⁻³ vs 0.33 × 10⁻³ ± 0.03 × 10⁻³cm/min; n = 4), indicating that high doses of probenecid could increase the paracellular pathway and exert toxic effects on the cell monolayer. For both concentrations, the reduced glucuronide efflux remained linear over time, indicating that probenecid effect occurred very rapidly (data not shown). The effect of probenecid was also reversible as shown in Figure 11. When cells exposed to the inhibitor for 20 min were washed and further incubated with 1-naphthol without probenecid, NG efflux resumed at a rate similar to that measured in untreated cells. Decrease in the export is not likely to be caused by UGT inhibition because (1) probenecid had no effect on UGT activity measured on choroid plexus homogenate (data not shown) and (2) the intracellular content in NG was increased from 18.9 ± 2.7 pmol/filter (n = 4) for DMSO to 30.8 ± 4.7 pmol/filter (n = 6) for 4 mm probenecid (p < 0.01; one-tailedt test for unequal variance).

Reversible effect of probenecid on NG efflux from CPE cells. Cells were incubated at 37°C in 50 μm1-naphthol in the presence of 4 mm probenecid or DMSO (control experiments). After 20 min efflux, some probenecid-treated cells were washed and incubated in 1-naphthol without the inhibitor. Efflux was performed for another 2 × 20 min. NG was quantitated in both basolateral (bottom part of thebars), and apical (top part of thebars) compartment, at the end of each interval. Results expressed as picomoles per minute per square centimeter are the mean ± SD (n = 4) of the amount of glucuronide excreted from the cell monolayer. For clarity, only half of SD bars are shown. A significant inhibition of total NG efflux occurred in the presence of probenecid (**p < 0.01; one-tailed t test for unequal variance) and was fully reversible. Note that the residual efflux from probenecid-treated cells was polarized as in control cells. Open columns, Without probenecid; hatched columns, 4 mmprobenecid. A, DMSO control; B, 4 mm probenecid throughout; C, 4 mm probenecid for 20 min, DMSO for 2 × 20 min.
Among probenecid-sensitive organic anion transport systems known to date, multidrug resistance-associated protein (MRP) has been implicated in the ATP-dependent cellular export of various glucuronidated compounds, a process that underwent competition from glutathioneS-conjugates such as dinitrophenyl-S-glutathione (Kobayashi et al., 1991; Jedlitschky et al., 1996; Loe et al., 1996). Because GS-DNP can be produced intracellularly by GSTs from extracellularly added CDNB (Evers et al., 1996), and GST activity toward CDNB is high in CPE cell homogenates (Fig. 6), we investigated whether this MRP substrate interacts with the export of NG. Loading of CPE cells with GS-DNP caused a marked reduction of NG efflux rate, as demonstrated by a decrease from 30.03 ± 0.34 pmol · min−1 · cm−2 in ethanol-treated cells (n = 4) to 3.26 ± 1.05 pmol · min−1 · cm−2 in CDNB-treated cells (n = 4). A moderate increase in the permeability to sucrose (2.3-fold) was concomitantly observed in monolayers treated with CDNB. However, intracellular NG content was not modified when cells were loaded with the glutathione conjugate, nor did CDNB inhibit UGT activity measured in a plexus homogenate. This indicates that the impaired efflux of NG is not caused by a decrease in NG production.
DISCUSSION
Insights into choroid plexus transport functions have been gained mainly by (1) in vitro uptake studies on dissected choroid plexus, (2) blood-to-choroid plexus uptake measurement or true CSF-to-blood transepithelial flux measurement performed on isolated perfused sheep choroid plexus, (3) ventriculocisternal perfusion, (4)in situ brain perfusion coupled with cisterna magna CSF sampling or microdialysis (for review, see Davson and Segal, 1996). However, the results from the latter in vivo procedures may be impaired by CSF flow and complex pathway of circulation, and by CSF–brain exchanges (Ghersi-Egea et al., 1996). Establishment ofin vitro cellular models of the choroid plexus epithelium to elucidate dynamic blood–CSF exchange mechanisms has been a challenge for the last few years. Several attempts have been performed from various species, using starting material from different developmental stages (Crook et al., 1981; Tsutsumi et al., 1989; Peraldi-Roux et al., 1990; Southwell et al., 1993; Ramanathan et al., 1996; Villalobos et al., 1997; Hakvoort et al., 1998; Zheng et al., 1998). Surprisingly, the data from these models have been mostly restricted to uptake and secretion. The few demonstrations of transepithelial flux of a molecule across choroidal cells were based on the measurement of an imbalance between its apical and basolateral concentrations, a method relevant only for active transport (Southwell et al., 1993; Hakvoort et al., 1998; Zheng et al., 1998). The cellular model and transfer technique we have developed allowed the characterization of transport-mediated and passive diffusion transfer in both directions, as well as cellular efflux mechanisms. We used newborn rat material to initiate our culture as (1) at this developmental stage, the choroidal epithelium already forms a tight and differentiated barrier, expressing transthyretin and drug-metabolizing enzymes (Tauc et al., 1984; Thomas et al., 1988;Strazielle and Ghersi-Egea, 1997b); (2) the size of choroid plexuses is already large and one litter provides sufficient material for 25 culture inserts; (3) the stromal core of the plexus is reduced in young animals compared with adults, which lessens the risk of fibroblast contamination. The cell isolation protocol we used gave highly reproducible monolayers of differentiated CPE cells, and, importantly, in contrast to other cellular models reported, fibroblast contamination was avoided without the use of growth inhibitors such as cytosine arabinoside or cis-hydroxyproline, which to some extent impede epithelial cell growth and functions. In addition, high levels of drug-metabolizing enzyme activities such as UGT, GST, or epoxide hydrolase were maintained in the cultured cells. This further confirms the differentiated status of the cultured CPE cells because these activities are valuable markers for differentiated cultured hepatocytes (Guillouzo, 1998).
Besides the structural and morphological features described in our reconstituted choroidal epithelium, a functional proof of its restrictive barrier property was provided by the fairly low monolayer permeability to sucrose, which reflects the paracellular pathway and appears sufficiently limited to allow precise measurement of permeability across the in vitro system. It should be noted that, although CPE cells are sealed in vivo by a continuous belt of tight junctions and strongly impede the passive diffusion of polar compounds, this epithelium is not as tight as the cerebral capillary endothelium forming the blood–brain barrier and has been classified, based on functional grounds, in the category of “leaky” epithelia (Castel et al., 1974; Davson and Segal, 1996).
This in vitro model of the blood-CSF barrier was used to investigate mechanisms of brain protection by the choroid plexus via an enzymatic barrier. Exposure of CPE cell monolayers to the lipophilic and cytotoxic compound 1-naphthol resulted in its conjugation into 1-naphthyl-β-d-glucuronide. Cellular export of this metabolite occurred predominantly at the basolateral, i.e., blood-facing membrane, thus facilitating its further elimination. This metabolic process will provide a complete barrier effect if the rate of metabolism Rm is at least equal to the rate of naphthol penetration Rp within the cells. The latter can be estimated according to Equation 3: Rp = PeH × C, where C is the concentration of 1-naphthol in the incubation medium, and PeH is the permeability coefficient of 1-naphthol across the cell monolayer, measured for a high concentration of the compound, i.e., when the rate of metabolism is negligible with regard to the flux rate across the cells (such as 50 μm; see Fig. 7). Accordingly, we can assume PeH equal to the Pe value of 12.5 × 10⁻³ cm/min obtained for 50 μm1-naphthol. The NG intracellular content after a 60 min incubation in 50 μm naphthol was found negligible in comparison to the total amount of NG effluxed in the medium during the period (18 vs 1601 pmol, respectively, calculated from Fig. 10, group A). The maximal value for Rm can therefore be approximated to the maximal rate measured for the metabolic/efflux process, i.e., 23.4 pmol · min−1 · cm−2(Fig. 9A). According to Equation 3 and assuming that the rate of metabolism is at its maximal velocity, then the enzymatic barrier will be fully efficient for concentrations up to 1.87 μm (resulting from Rm/PeH). This theoretical value is in agreement with the experimental concentration below which naphthol did not cross the monolayer. This correlation shows that the barrier effect is fully accounted for by metabolism. Moreover, our assumption about Rm is justified because the apparent affinity constant of the metabolism–efflux process for 1-naphthol was estimated to be <0.4 μm. Thus, this work demonstrates the presence in the choroid plexus, of a high-affinity conjugation/efflux process which, in conjunction with a highly efficient intracellular synthesis of the cosubstrate UDP-glucuronic acid, functions as an effective metabolic barrier toward lipophilic compounds such as 1-naphthol.
Cellular efflux of NG is transporter-mediated as indicated by polarity, temperature sensitivity, unidirectionality, and inhibition of the process by other conjugates and by probenecid, which is known to block the transport of various organic anions in different epithelia. Organic anion transport systems have been investigated at the choroid plexus, mostly by in vitro uptake studies. In particular, clearance of CSF-borne naturally occurring organic anions such as leukotriene C4, taurocholate, or exogenous organic acids like salicylic acid and β-lactam antibiotics has been demonstrated to occur via the choroid plexus (Spector and Goetz, 1985; Susuki et al., 1997). Other recent works have reported the choroidal expression of organic anion transporter polypeptide oatp1 and oatp2 genes (Hogue-Angeletti et al., 1997; Abe et al., 1998). However, the involvement of these transporters in the efflux process of NG is unlikely because (1) oatp1 is located at the apical membrane of epithelial cells (Hogue-Angeletti et al., 1997), (2) oatp members are involved in cellular uptake processes rather than excretion (Oude Elferink et al., 1995), and (3) the range of substrates transported by oatp members does not apparently include glucuronide or glutathione conjugates except 17β-estradiol-β-d-glucuronide. The transport process we demonstrated is predominantly located at the basolateral membrane and outwardly directed. These data, and the recognition of the transporter by another glucuronoconjugate and by GS-DNP, strongly suggest the presence of a member of the MRP family at the basolateral membrane of the choroid plexus. These transporters first reported in tumor cells, (Marsh et al., 1986) have been described in normal tissues and circulating blood cells. They mediate the excretion of a large number of amphiphilic anions, most of which are conjugates of lipophilic compounds with glucuronide, sulfate, or glutathione (Leier et al., 1994; Jedlitschky et al., 1996; Loe et al., 1996). Six members of this family, exhibiting different tissue distribution and intracellular localization, have been identified to date (Cole et al., 1992;Büchler et al., 1996; Paulusma et al., 1996; Ito et al., 1997;Kool et al., 1997; Kiuchi et al., 1998; Uchiumi et al., 1998; Kool et al., 1999). Whereas MRP1 is found at the basolateral membrane of hepatocytes or transfected polarized pig kidney cells (Mayer et al., 1995; Evers et al., 1996), MRP2 has been demonstrated to localize to the apical domain of polarized epithelia such as the hepatocyte canalicular membrane or kidney proximal tubule luminal membrane (Schaub et al., 1997; Evers et al., 1998). The exact identity of the basolateral efflux pump in the choroidal epithelium remains to be determined.
In addition to UGT, other conjugating enzymes such as GSTs are likely to contribute to the enzymatic blood–CSF barrier phenotype, because GST activity and glutathione content are high in the choroid plexus (Fig. 6; Lowndes et al., 1994), and glutathione conjugates compete for the basolateral efflux transporter. This would be of particular importance for the CSF penetration and overall cerebral disposition of some anticancer drugs known to be MRP substrates either as glutathione conjugate or nonmodified (Cole and Deeley, 1998). Additionally, the MRP-like transport activity may be relevant to the basolateral efflux of neuroactive endogenous conjugates such as leucotriene C4 at the choroid plexus (Spector and Goetz, 1985).
In conclusion, the blood–CSF interface possesses a functional molecular machinery for all steps of endobiotic and xenobiotic metabolism and elimination. This paradigm of a coupled mechanism of metabolism–polarized efflux represents a new insight in understanding the contribution of choroid plexuses in the preservation of cerebral homeostasis. Furthermore, the role of the blood-CSF interface in the central bioavailability of neuroactive compounds can now be investigated with our in vitro choroidal epithelium model.
Footnotes
This work was supported by Sidaction, the Agence Nationale de Recherche sur le Sida, and the Institut National de la Santé et de la Recherche Médicale (PRISME 98–01). N.S. is a recipient of the Agence Nationale de Recherche sur le Sida. We also thank the Région Nord-Pas de Calais for financial support. We thank Profs. Joe Fenstermacher and Clifford Patlak, and Dr. Marie-Francoise Belin for advice and critical discussion. We thank Prof. Romeo Cecchelli for free access to his technical facilities, Prof. Joe Fenstermacher for access to his electron microscopy Center, and Dr. Simon Saule for access to his molecular biology equipment. We also thank Wendy Finnegan for processing the transmission electron micrographs and Jean-Marc Merchez for help with preparation of the photographs.
Correspondence should be addressed to Dr. Jean-François Ghersi-Egea, Institut National de la Santé et de la Recherche Médicale U 433, Faculté de Médecine R.T.H. Laennec, Rue Guillaume Paradin, F 69372 Lyon Cedex, 08 France.


