

Abstract
The color of an object, when part of a complex scene, is determined not only by its spectral reflectance but also by the colors of all other objects in the scene (von Helmholtz, 1886; Ives, 1912; Land, 1959). By taking global color information into account, the visual system is able to maintain constancy of the color appearance of the object, despite large variations in the light incident on the retina arising from changes in the spectral content of the illuminating light (Hurlbert, 1998; Maloney, 1999). The neural basis of this color constancy is, however, poorly understood. Although there seems to be a prominent role for retinal, cone-specific adaptation mechanisms (von Kries, 1902; Pöppel, 1986; Foster and Nascimento, 1994), the contribution of cortical mechanisms to color constancy is still unclear (Land et al., 1983; D’Zmura and Lennie, 1986). We examined the color perception of 27 patients with defined unilateral lesions mainly located in the parieto-temporo-occipital and fronto-parieto-temporal cortex. With a battery of clinical and specially designed color vision tests we tried to detect and differentiate between possible deficits in central color processing. Our results show that color constancy can be selectively impaired after circumscribed unilateral lesions in parieto-temporal cortex of the left or right hemisphere. Five of 27 patients exhibited significant deficits in a color constancy task, but all of the 5 performed well in color discrimination or higher-level visual tasks, such as the association of colors with familiar objects. These results indicate that the computations underlying color constancy are mediated by specialized cortical circuitry, which is independent of the neural substrate for color discrimination and for assigning colors to objects.
Acquired color perception deficits caused by cerebral lesions have been reported since the 19th century (MacKay and Dunlop, 1899). The impairments reported in patients, either in combination with other disorders or alone, range from attenuation of wavelength discrimination or color sorting up to a complete loss of color perception, color agnosia, and deficiencies in color constancy.
A loss of color perception, which is often referred to as dyschromatopsia or achromatopsia, has been reported in patients after bilateral cortical damage to the lingual and fusiform gyri on the ventro-medial side of the occipito-temporal lobe (for review, see Damasio et al., 1980; Zeki, 1990). Achromatopsic patients describe colors as dim, dirty, pale, or washed out or as shades of gray. Although they show abnormal performance on pseudoisochromatic color plates and on color-sorting tasks such as the Farnsworth–Munsell 100-hue test, they name hues of brightly colored or remembered objects correctly (Meadows, 1974; Green and Lessel, 1977; Heywood and Cowey, 1987; Rizzo et al., 1993).
Color agnosia is characterized by an impairment in relating typical colors or color names to everyday objects such as fruits or vegetables. Also, the ability to name colors or to select, for example, color tokens by name can be lost (color anomia). These deficits are often associated with aphasic symptoms such as alexia and seem to occur independently either of specific or complete color perception deficits.
A deficit of color constancy is the inability to compensate for changes in color appearance when the spectral composition of the illuminating light changes (Hurlbert, 1998; Maloney, 1999). The visual system seems to achieve color constancy by comparing the colors of all objects within the field of view and attributing an increase, for example, in the amount of long wavelengths reflected from all objects to a shift in redness of the illuminant (Land, 1959). This implies that the perceived hue of an object depends on the colors of the surrounding objects, or that color constancy requires a context (von Helmholtz, 1886; Ives, 1912; Land, 1959; Hurlbert, 1996). Although such compensation is never complete, it seems to correct for at least approximately half of the change of color appearance under different illuminations (Helson and Michels, 1948; Brainard and Wandell, 1991, 1992; Arend, 1993;Bäuml, 1994; Brainard, 1998).
At present, it is unclear which cortical areas are responsible for mediating color constancy (D’Zmura and Lennie, 1986). First, lesion studies in macaque monkeys have shown that ablation of area V4 results in color constancy deficits (Wild et al., 1985; Walsh et al., 1993), but accompanying deficits in hue discrimination were also found. This makes it uncertain whether the color constancy deficit was caused by the more basic hue discrimination deficit. Furthermore, the results of lesion experiments in macaque monkeys and of clinical studies in human patients do not support a simple parallel between monkey and human visual cortices (Merigan, 1993; Heywood et al., 1995; Hadjikani et al., 1998; Heywood and Cowey, 1998; Zeki et al., 1998). Second, and most importantly, the effect of cortical lesions on color constancy in humans has not been studied systematically. All published studies involve patients who were either achromatopsic (Bramwell et al., 1997;Cowey and Heywood, 1997; D’Zmura et al., 1998) or had severely impoverished wavelength discrimination (Kennard et al., 1995; Morland and Ruddock, 1997). Kennard et al. (1995) and D’Zmura et al. (1998)used a color-naming task and found that their patients altered the names of surface colors in accord with the changes in their Commission Internationale d’Éclairage (CIE) chromaticity coordinates when the illumination was varied. This inability to compensate for the changes in the illuminant resulted in a shift in the color category associated with the chromaticity coordinates.
These clinical observations, although interesting, leave unanswered the basic question of whether deficits in color constancy can occur independently of those in other color vision function. In response to that question, we investigated the perception of color in 27 patients with unilateral cortical lesions, using a battery of different color vision tests, which included standard clinical tests as well as those especially designed to investigate color discrimination and color constancy.
MATERIALS AND METHODS
Patients
The 27 patients of this study (12 female and 15 male; for clinical details, see Table 1) suffered from unilateral brain lesions, resulting from either a stroke (19), a tumor (5), ischemia (1), hematoma (1), or bleeding and trauma (1). The patients’ mean age was 46.0 ± 13.1 (SD) years (range, 25–72 years). Patients had to fulfill the following selection criteria, as determined from their neurological records and informal assessment: a good general state of mental and physical health, full comprehension of the tasks, normal or corrected to normal acuity, absence of severe oculomotor disorders, no sedative medication, and an interval between lesion and testing of >2 months. Nine of the patients suffered from different types of aphasic syndromes, but all were able to talk or to communicate reliably. For 22 patients, we were able to obtain their computed tomographic (CT) and/or magnetic resonance imaging (MRI) scan, made at the time closest to the incident, to verify the lesion location. All of them had a circumscribed unilateral lesion with a clear demarcation of the lesioned from the surrounding tissue. For the other five patients, CT or MRI scans were not conducted or unavailable. Other clinical details of the patients are provided in Table 1. Before any testing, informed consent was obtained from all patients in accordance with the Declaration of Helsinki.
Clinical details of the 27 patients
To evaluate the patients’ general visual and attentional status, we administered several standard tests of visual fields, acuity, contrast sensitivity, and color perception (see below).
Control group
For comparison, we also tested nine control subjects (three female and six male) who had no known history of any neurological or visual dysfunction. Their age distribution was similar to that of the patients [mean age, 40.2 ± 14.6 (SD) years; range, 20–70 years]. Three of the authors served as control subjects, but the others were naive with respect to the purpose of this study.
Lesion locations and visual deficits for the 27 patients
Standard visual tests
Perimetry
Visual fields were examined separately for each eye with the standard Tübingen Automatic Perimeter in 25 of the 27 patients (Table 2). In 12 patients, visual field defects were found; 6 of them had a defect in their left visual hemifield, and 6 had a defect in their right hemifield. Nine of the 12 patients had a complete hemianopia, 1 had an incomplete hemianopia, and 2 patients had an upper right quadranopia.
Contrast sensitivity
Each patient’s monocular contrast sensitivity was evaluated with the Vistech-VCTS 6500 charts at a viewing distance of 3 m. Sensitivity was measured by testing the orientation discrimination of gratings with spatial frequencies ranging from 1.5 to 18 cycles/degree at various contrast levels. None of the patients fell out of the normal range.
Spatial attention
As a test of neglect, patients were tested in a visual search task using the shape cancellation test of Mesulam (1985). Subjects were asked to mark all examples of one symbol (a hatched “sun”) with a colored pencil on the test sheet covered with various symbols. The time to completion was not restricted but was recorded. The occurrence of errors (wrong symbol markings) and misses as well as the search strategy were evaluated. Only two patients showed more than two mistakes. Patient HR omitted five symbols on the left side of the test sheet only, whereas patient MS, who also missed five symbols, made mistakes on both sides.
Congenital color vision deficiencies
Red–green congenital color vision impairments were tested by means of the Mollon–Reffin color test (Mollon et al., 1991) and the Ishihara pseudoisochromatic plates (Ishihara 1962). The data of patients with congenital color vision impairments were excluded from further analysis.
All paper-and-pencil tests were run under daylight with additional neon light illumination (∼250 lux, 3100°K). The color tests described below were run on a computerized setup in an otherwise dark room.
Color tests
Color constancy
For the evaluation of color constancy, we used an achromatic matching task that has been widely used in psychophysics to quantify color constancy performance (Helson and Michels, 1948; Arend, 1993;Bäuml, 1994; Brainard, 1998). Stimuli were displayed on a color monitor (BARCO CCID7751) driven by a graphic board (VSG 2/3, Cambridge Research Systems). A “Mondrian” stimulus, as shown in Figure 1, A and B, extending 21 × 20° of visual angle, was displayed in the center of the monitor screen, surrounded by a black nonreflecting cardboard covering ∼70 × 53° of the visual field. No other objects were visible in the dark room. The color field consisted of an irregular, randomized arrangement of small, colored rectangular patches. The patches had different, irregular sizes, with the smallest elements extending 12 arc min2 and the average size being 30 arc min2. A larger horizontally oriented rectangle (2° wide) was positioned at the center. The central rectangle had a uniform gray color, which could be adjusted by the observers.

A, Illustration of the color constancy display under the neutral illuminant C (daylight). Each of the Mondrian patterns consisted of a random arrangement of small, colored rectangles and a central larger, horizontal gray rectangle.B, Same reflectances under a bluish simulated illuminant. The colored patches above the Mondrian illustrate settings at different levels of color constancy (not shown during the experiment). C, CIE coordinates of the simulated surface colors of 226 different Munsell chips illuminated by five different illuminants. The corresponding transformation in color space for each Munsell chip under the four colored illuminants is indicated by the appropriate color; the neutral setting under CIE standard illuminant C is indicated in black.D, The observer had to adjust the color of the central rectangle by changing its color value along one of the cardinal directions of color space, as illustrated by the colored lines, until it appeared as a neutral gray under each of the five illuminants.
The colors of the small rectangles were calculated from the known reflectance spectra of 226 different Munsell chips (Cohen, 1964), virtually illuminated by light sources of different color temperature and dominant wavelength. Five different illuminations were chosen: CIE standard illuminant C (Wyszecki and Stiles, 1982) and four virtual illuminants, which had the effect of shifting the color of the neutral gray square along one of the cardinal directions of color space (Krauskopf et al., 1982; Fig. 1D). Under illuminant C the neutral gray had CIE 1931 x,y coordinates of (0.310,0.316) and a luminance of 15 cd/m2. The coordinates were shifted toward (0.358,0.304) under the red illuminant, toward (0.262,0.329) under the green illuminant, toward (0.297,0.268) under the blue illuminant, and toward (0.323,0.364) under the yellow illuminant. The virtual illuminations were computed by using a broad-band filter in combination with illuminant C. The broad-band filters were positive (yellow and green) or negative (blue and red) Gaussian functions with different means (red, 505 nm; green, 500 nm; blue, 522 nm; and yellow, 549 nm) and SDs (red, 50 nm; green, 90 nm; blue, 95 nm; and yellow, 105 nm). The transmittance of the filters was normalized so that the mean luminance of the illuminated Munsell chips stayed roughly constant. Figure 1C illustrates the shift in color space of all 226 Munsell chips under the four different illumination changes, indicated by the differently colored symbols. The neutral setting (illuminant C) is indicated in black. Figure1B shows an example of the monitor display under a bluish simulated illuminant; Figure 1A shows the same under neutral illumination.
The observer’s task was to adjust the color of the central rectangular patch until it appeared as a neutral gray surface under each illuminant (“surface match”). In the first part of the test, the Mondrian was set to neutral illumination C, and the color of the target rectangle was set to red, green, blue, or yellow. Then the observer adjusted the target rectangle along a line in color space corresponding to the axis of the illumination change until it appeared neutral gray. For each of these four initial colors, at least four neutral adjustments were completed by each subject. In the second part, the Mondrian was presented consecutively under one of the four different illuminations (red, green, blue, or yellow). Again, the color of the target rectangle could be modified along one axis of color space only, extending through the neutral setting and the setting predicted under full color constancy (Fig. 1D). The initial color of the target rectangle was always in the direction of the illuminant, being twice as far from the actual neutral point as the illuminant itself. The time for adjustment was not limited, and at the end of each trial the observers were asked whether they perceived the matched rectangle as neither reddish nor greenish and neither bluish nor yellowish, respectively, before they accepted a match to appear gray. After each match, a new Mondrian with randomized geometry was presented, and after each change of the illuminant, an adaptation break of at least 2 min was given.
Color constancy was calculated for each of the four virtual illuminations as the difference between the matched gray at the neutral illumination C and the matched gray under the virtual illumination, normalized to the difference of the illuminant coordinates. As a result, color constancy performance could be expressed as a percentage, which was typically between 0 and 100%. A setting of 100% indicated perfect color constancy. A value of 0% indicated no color constancy at all; i.e., the subject always matched the same physical gray, independent of the illumination of the surrounding Mondrian. However, because there were no constraints on the adjustments, a subject could theoretically also produce negative settings or settings >100%. Nevertheless, negative settings or settings >100% rarely occurred during testing.
Subjects were tested in three to five sessions, each lasting between 30 min and 1 hr. Breaks were given after each test and whenever subjects requested them.
Color and luminance discrimination
Discrimination thresholds were measured using the same computerized setup as above. The stimulus consisted of an 8 × 8 matrix of separate light gray squares (23 cd/m2) presented on a darker gray background (15 cd/m2). Each square subtended 1.2 × 1.2° of visual angle; the distance between the squares was 0.4° from edge to edge. The stimulus contained a target consisting of 2 × 2 neighboring squares, which differed slightly either in color (red, green, yellow, or blue) or in luminance (lighter or darker) from the other squares. The target was always presented in one of the four corners of the stimulus (Fig.2). The stimulus appeared for 1.5 sec and was followed by a uniform gray field matching the background luminance of the target display. The viewing distance was 70 cm.

A, Stimulus for the color discrimination task. A matrix of 8 × 8 squares was presented: 4 of the 64 squares were arranged as a 2 × 2 quadratic subset, which differed either slightly in color (red, green, blue, or yellow) or in luminance (lighter or darker) from the other 60 neutral gray squares. The subject had to report the location (quadrant) of the subset. B, Illustration of the color directions used in this study. Note that the appearances of these “cardinal direction” stimuli are distinctly different from perceptually determined “unique hues” (Krauskopf et al., 1982).
Subjects had to indicate the location of the target squares. The color or luminance difference between the target and the other squares was varied by a staircase procedure (Levitt, 1971) that converged at the color or luminance difference at which subjects were just able to correctly locate the target squares in 80% of all cases. Separate but randomly interleaved staircases were used for each of the six different test conditions: for a brighter, darker, redder, greener, bluer, or more yellow target (Fig. 2B). Each test session lasted ∼20 min. In the color conditions, the colors of the target squares were changed along the cardinal directions of color space (Krauskopf et al., 1982), which differentially excite the second-stage color opponent mechanisms in the early visual pathways (Derrington et al., 1984). These color directions were identical to the ones used in the color constancy experiments. Chromaticities for the color changes in the four directions were given above. To prevent the detection of the color target squares by means of luminance differences, small random luminance variations from square to square were introduced. The maximum variation was ± 1.6 cd/m2 and was just barely noticeable.
Naming and object recognition tests
We performed tests to evaluate the patients’ ability to name colors and objects and to assign characteristic colors to familiar objects (Fig. 3). Colored or black-and-white line drawings of natural objects, such as fruits, vegetables, and animals, and man-made objects, such as tools, were taken from the picture sets of Snodgrass and Vanderwart (1980). Three different tests were administered.

Examples of the stimuli used in the color-naming, object-naming, and color association tests. A, In the color-naming test, the subjects were required to name the color of familiar objects. B, In the object-naming test, they were required to name the familiar objects and their typical colors.C, In the color association test, they were required to say whether the object was appropriately colored.
Color naming. The ability to name colors correctly was tested on cards of paper, showing 24 different colored man-made objects (Fig. 3A). Subjects had to name the color of each object.
Object and (typical) color naming. To test the subjects’ memory for colors and objects, 24 simple black-and-white drawings of objects were presented (Fig. 3B). Subjects were asked to name each single object and its typical color. Approximately half of the items were man-made objects.
Color association of objects. Thirty pictures of different objects were shown (Fig. 3C). Half of these objects were shown in their typical color (e.g., a red bell pepper), the other half in an unusual color (e.g., a green horse). The subject had to name the color of each object and to say whether it was typical for the object. If the subject had doubts about the color of a specific object or rejected the color as being atypical, they were required to give their reason, which was recorded.
The performance on the three tests was evaluated by the percentage of correct answers.
Statistics
We used an iterative procedure to determine whether the performance of any of the observers was significantly worse than that of the whole group of patients and control observers. Because our control group with nine observers was too small to determine reliably the distributions of performance, and because most patients showed quite good performance in most of the tasks, we computed our distribution of “normal” performance from both control observers and those patients without deficits. We initially selected the control group as our normal group and computed the mean and SD of performance for each task separately. Then patients were added to the normal group if their performance did not deviate by >2.28 SDs from the mean of the previously selected normal group, equivalent to a one-sided confidence level of 1%. Mean and SD of the revised normal group were computed, and the procedure was iterated until the largest subset of controls and patients without any outliers was reached.
Reconstruction of the lesion and anatomical evaluation
To reconstruct each patient’s lesion, the CT or MRI scans recorded closest to the incident were used. The location and extent of each lesion were traced from slices of CT and/or MRI scans onto axial (horizontal) templates, the tilt plane of which best corresponded to the tilt plane of the CT or MRI scans. For reconstruction of each lesion, the distance between the axial levels of the brain templates was 4 mm. These (possibly) tilted templates were then transformed into the standard Talairach coordinate frame (Talairach and Tournoux, 1988).
RESULTS
Color constancy
The color constancy tests, which formed the core of these studies, were performed for color changes along the red–green and blue–yellow cardinal axes of color space. Figure 4shows the results of these tests. In this and all other histograms,filled bars indicate the patients’ data, and open bars indicate the data from the control group. The black line shows the normal distribution obtained by using the iterative procedure described above. The gray-shaded areaindicates the data lying outside 2.28 SDs of the mean and corresponds to 1% of the area under the curve. Median color constancy in our task was 45.5 and 35.5% for the red–green and blue–yellow axes, respectively. Along both color axes, patient AS showed the largest deficit and made slightly negative matches. In addition, along the red–green axis, four other patients, AK, HR, GZ, and RM, made matches outside of the statistically normal range. And, along the blue–yellow axis, five patients, AK, HR, GZ, RB, and MH, in addition to AS showed serious color constancy deficits. Patient RM, who showed a clear deficit along the red–green axis, had reduced color constancy (13%) along the blue–yellow axis. There was no systematic difference in the neutral gray adjustments between the patients and the control group, although the SD of the adjustments was slightly higher in the group of patients.

Histograms of the color constancy results of 27 patients and 8 control subjects. The ordinate gives the number of cases as a function of the color constancy indices in percent for neutral gray settings along both cardinal color directions. An index value of 0 indicates a setting of the gray rectangle irrespective of the change in illuminant (no color constancy); an index value of 100 indicates perfect adjustment to the illuminant (absolute color constancy). For comparison, the black line shows the distribution of settings for all unimpaired observers, including the control subjects; significant deviations of >2.28 SD are indicated by the shaded area. A, Color constancy indices for neutral gray settings along the red–green axis. The average of settings in both directions, toward red and toward green, is plotted. In this task, the five patients, AK, AS, GZ, RM, and GK, matched the gray value outside the statistically normal range. Patients HR and GR were just barely within the normal range. B, Color constancy indices for neutral gray settings along the blue–yellow axis. The average of settings in both directions along the blue–yellow axis is plotted. In this task, the six patients, AK, AS, HR, GZ, RB, and MH, matched the gray value outside the statistically normal range. The match of patient RM was just barely within the normal range.
Figure 5 presents a scatterplot of color constancy performance along both color axes, replotted from Figure 4. The dark-shaded area indicates the range in which the average color constancy was impaired along both axes. For clarity, slightly negative matches have been set to zero in this plot. It can be seen that five patients showed combined deficits along both color axes, AK, AS, HR, GZ, and RM. In addition, patients MH and RB exhibited a marked deficit along the blue–yellow axis only and showed average performance along the red–green color axis. In contrast, patient GK showed a marginal disturbance along the red–green color axis without any defect along the blue–yellow axis.
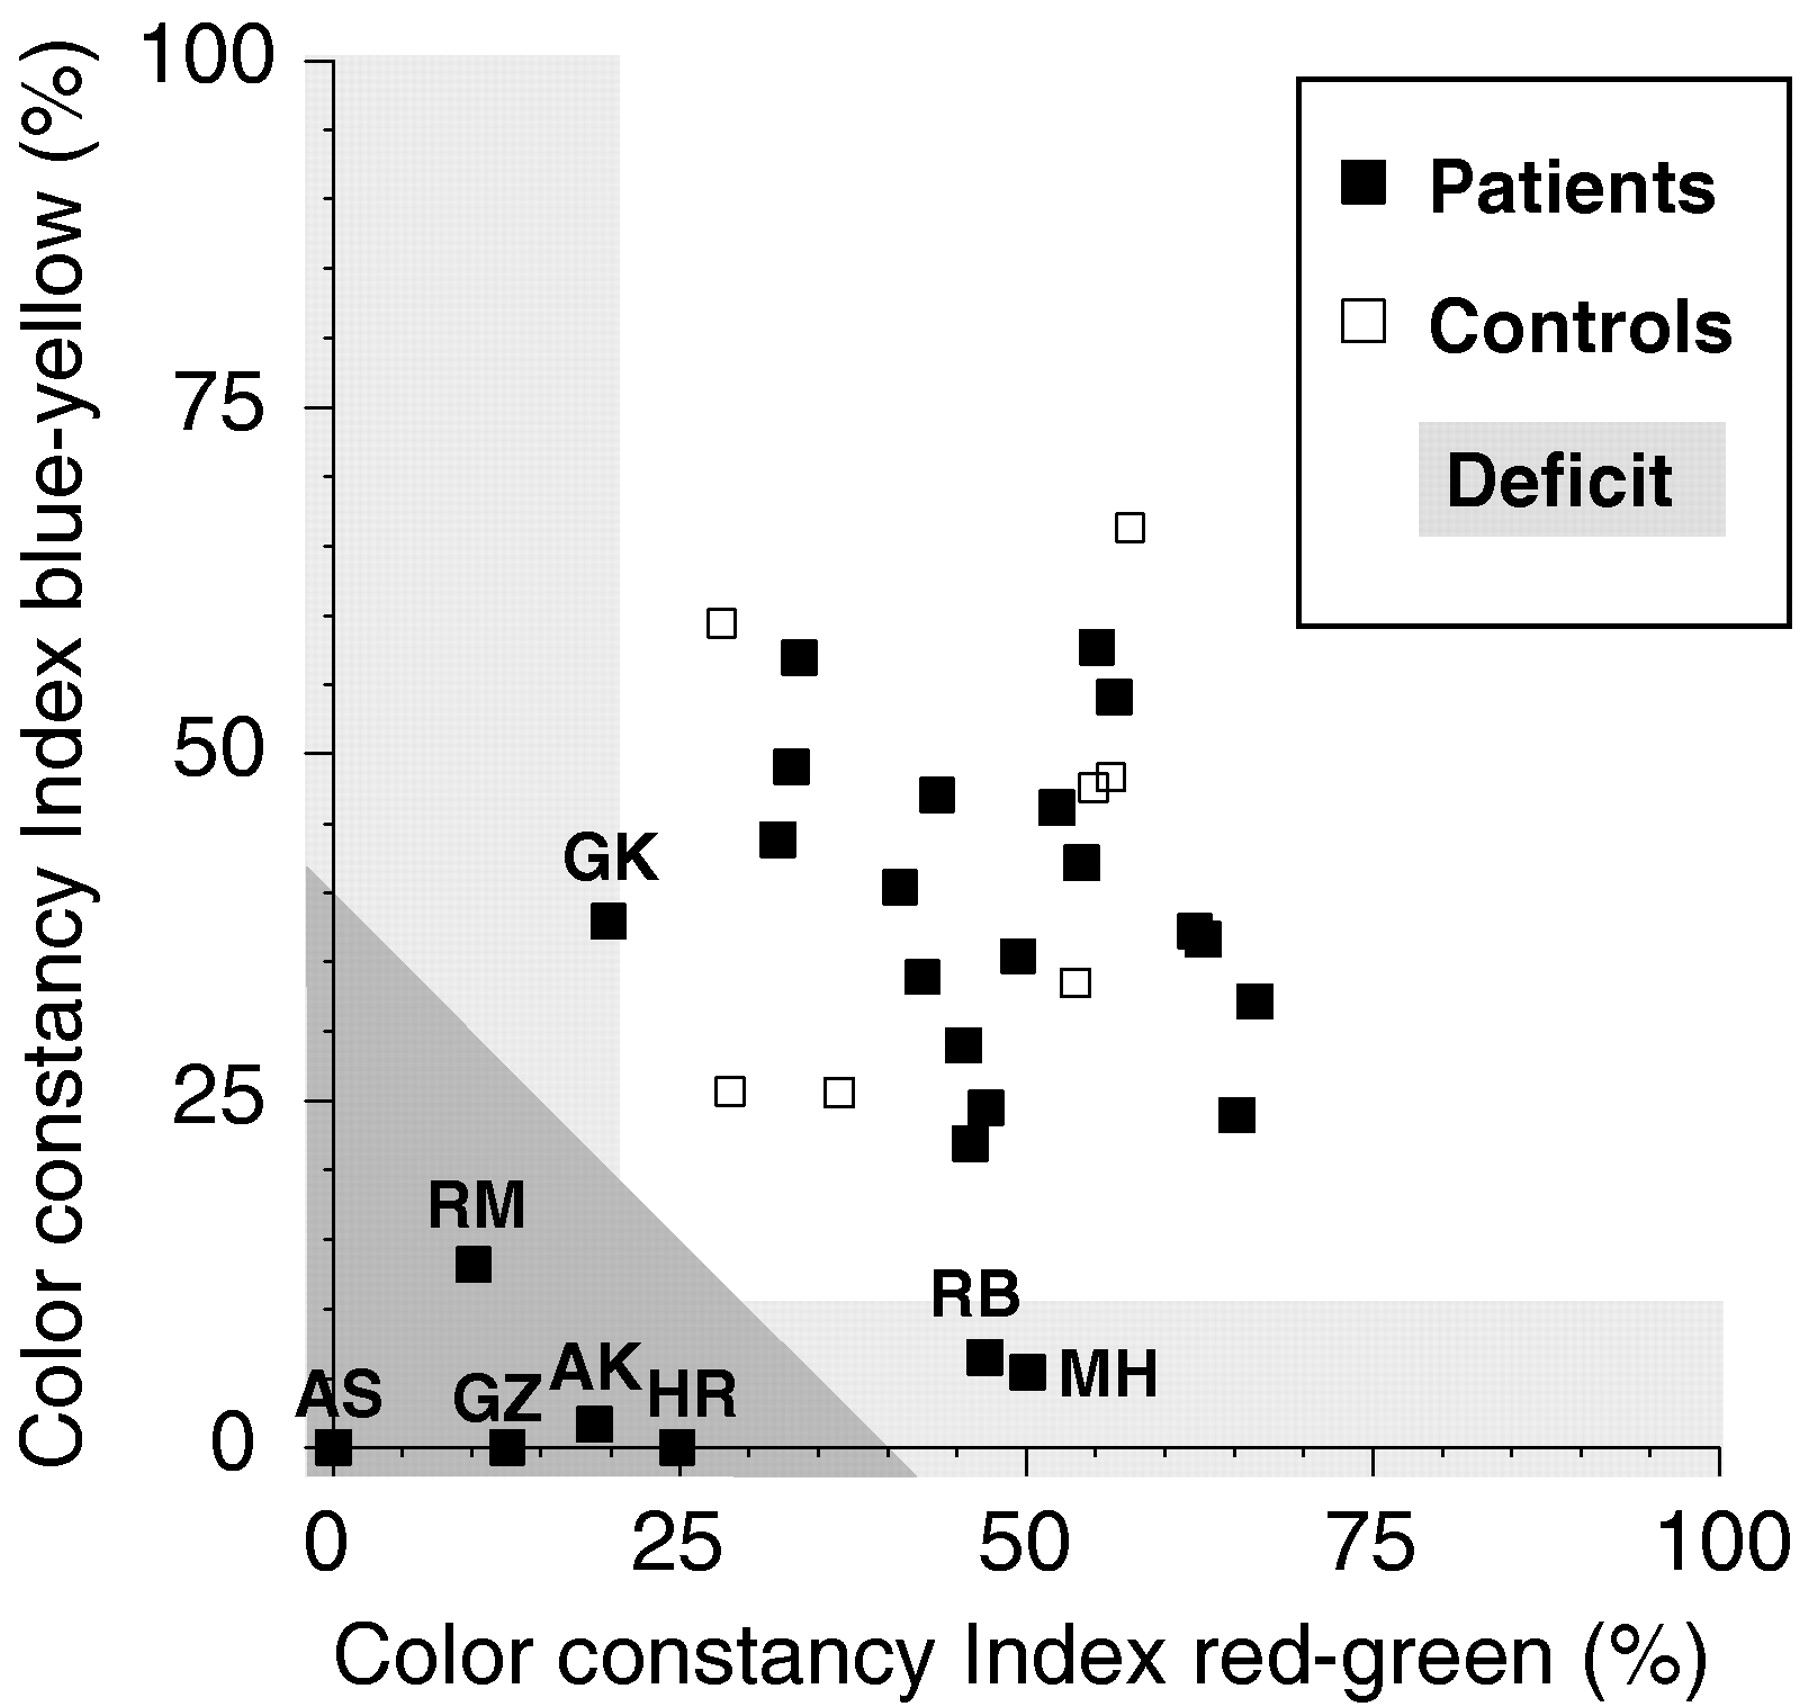
Scatterplot of the color constancy indices from Figure 4 along the red–green and blue–yellow color axes. Theshaded area indicates the range of average color constancy impairment. Slightly negative matches have been set to a value of zero. The five patients showing color constancy deficits along both color axes are AK, AS, HR, GZ, and RM. The other patients with deficits along only one color axis (GK, RB, and MH) showed normal performance along the other color axis, so that their average performance fell within the normal range.
Color discrimination
Functional color discrimination is a necessary but not a sufficient requirement for color constancy (Morland et al., 1997). If subjects are unable to discriminate lights along a certain direction in color space, they cannot reliably control for illumination changes along that axis either. None of our observers were color-deficient, as determined by conventional tests for color blindness. Nevertheless, they might have acquired, as a result of their lesions, some central deficit in color discrimination that contributed to their color constancy deficits. Before interpreting the data, we had to first rule out such effects, for to achieve constancy for lights along a particular direction in color space, it is necessary to be able to discriminate changes along that direction. We therefore tested color discrimination along the same color directions that were used in the color constancy tests and also along the luminance direction (light–dark). The results of the discrimination experiments for these three color directions are shown in the histograms of Figure6. Contrast at threshold along each color direction is plotted on the x-axis. For light–dark discrimination (Fig. 6A), the standard luminance contrast (ΔLum/Lum) is plotted. For red–green discrimination (Fig.6B), we plot the root mean squared contrast of the two cone classes modulated along this axis, the long-wavelength-sensitive (L) and middle-wavelength-sensitive (M) cones. For blue–yellow discrimination (Fig. 6C), the contrast of the short-wavelength-sensitive (S) cones is plotted, because only S cones are modulated along this axis.

Histograms of the luminance and color discrimination thresholds for 27 patients and 9 control subjects. In each histogram, the number of cases is given as a function of the discrimination threshold, specified as luminance or cone contrast. Theblack line corresponds to the distribution of thresholds for all unimpaired observers, including the control subjects; significant deviations of >2.28 SD are indicated by the shaded area. A, Luminance discrimination thresholds for stimuli differing along the light–dark axis. The discrimination threshold is given as the standard luminance contrast (ΔLum/Lum) in percent. Patients MS, KB, and GZ had significant deficits for discriminating darker or lighter stimuli. B, Color discrimination thresholds for stimuli differing along the red–green axis. The discrimination threshold is given as root mean squared L and M cone contrast in percent. Only patient MH showed a small but significant deficit for discriminating stimuli along this axis.C, Color discrimination thresholds for stimuli differing along the blue–yellow axis. The discrimination threshold is given as S cone contrast in percent. Patients IL and MS had small but significant deficits for discriminating stimuli differing along this color axis. Control subject WR had a strong deficit along that color axis, probably because of an age-related yellowing of the lens.
Only a few patients exhibited discrimination deficits. Along the light–dark discrimination axis, patient MS had a serious deficit. She required a 75% contrast difference for discrimination, compared with an average difference of 10% contrast. This was not owing to her visual field defect (hemianopia), because thresholds were similarly increased when tested in her functioning visual field only. Furthermore, her thresholds for discrimination along the red–green and blue–yellow axes were either unelevated or only mildly elevated. Other than MS, only two patients, KB and GZ, had mild deficits for light–dark discrimination.
Along the red–green and blue–yellow axes, no serious deficits were observed. Interestingly, the oldest control subject (WR, age 70 years) showed an increase in blue–yellow thresholds. This is most likely attributable to an age-related yellowing of the lens. Patient MH showed a mild deficit along the red–green axis, whereas patients MS and IL showed mild deficits along the blue–yellow axis.
We also analyzed the data with respect to the two hemifields. For patients with visual field defects, thresholds were generally increased in the nonfunctioning part of the visual field. Because we did not control fixation and eye movements in this experiment, patients were usually still able to perform the task. No hemifield asymmetries were observed for the patients without visual field defects.
In addition to the subjects presented here, we also tested, as a control, six congenitally color-deficient observers (dichromats), who have known deficits along the red–green axis. Both deuteranopes (lacking M cone function) and protanopes (lacking L cone function) showed vastly elevated thresholds along the red–green color axis, thus confirming the sensitivity of our color discrimination test.
Color constancy related to color discrimination
It is interesting to compare performance in the color constancy and color discrimination tasks, because discriminability along a color direction is an essential requirement to achieve color constancy. Figure 7 presents a scatterplot of a color constancy index versus a discrimination index. The color constancy index is the average of the color constancy indices along the red–green and blue–yellow color axes. The discrimination index is the average of the standardized discrimination thresholds along the red–green and blue–yellow axes, arbitrarily normalized to a mean of 50 and an SD of 25. There was no correlation between performance in the two tasks (ρ = −0.166; p > 0.1). The shaded areas indicate deficits in each one of these two tasks. As mentioned before, only very few patients showed reliable color discrimination deficits. Patient MS is the only patient with a strong deficit, and patients MH and IL had slightly elevated thresholds. Most notably, the performance of the patients with color constancy deficits was not impaired in the color discrimination task. Two of the patients with color constancy deficits, GZ and RM, showed excellent color discrimination, whereas the three remaining patients showed only moderately elevated discrimination thresholds.

Scatterplot of the average color constancy index versus the average color discrimination index. Thex-axis gives the average of the color constancy indices for the red–green and blue–yellow axes; the y-axis gives the average normalized (mean = 50; SD = 25) discrimination thresholds for the red–green and blue–yellow axes (the lower the index, the better the discrimination). The shaded area indicates deficits in each one of these two tasks. The five patients with deficits in color constancy (AK, AS, HR, GZ, and RM) showed normal color discrimination.
Color association
The lack of color constancy in these five patients would imply that for them objects do change in color when the illumination changes, potentially a serious problem for their vision in an ever-changing world. However, none of the five patients reported any significant deficits in everyday life. When we tested our patients in several other higher-level visuo-cognitive tasks, such as object naming, color naming, or color–object association, most performed well in the color and object naming tasks (for exceptions, see Table 2). Because the control group was able to perform the naming and association tasks without error, the statistical analysis was not applicable to the results of these tasks. Outright deficits in color naming occurred with patients MM, RF, and IL, and marginal deficits occurred with patients HR and MH. Outright deficits in object naming occurred with patients MM, KB, and IL, and marginal deficits occurred with patients HR, RF, and EL. Outright deficits in assigning typical colors to objects occurred with patients RF and IL, and marginal deficits occurred with patients HR and MM. All these patients had left-sided brain lesions. Because some of the patients with deficits in the above tasks showed signs of mild aphasia, it is instructive to look at the results of the color association task. Here, all subjects were >75% correct, and only subjects MM, RF, MH, KB, and EL were <90% correct. It seems that the deficits of subjects HR (94% correct in color association) and IL (91% correct in color association) in the color- and object-naming tasks are attributable mostly to their aphasic disorders. Subjects MM and RF showed serious deficits in all tasks, and subject KB had problems with the object-naming task only.
Anatomical data
For 22 of the 27 patients, we could determine the location and extent of the lesion, the details of which are summarized in Table 2. Figure 8 shows the lesion locations of the five patients with color constancy deficits. Although the lesions of three of these patients (AK, AS, and HR) were quite extensive and covered large parts of fronto-parieto-temporal cortex, those of the other two (GZ and RM) were relatively small. Interestingly, the two patients with small lesions showed excellent color discrimination and were considerably different from the other three patients in the nature of their color vision deficits (see Fig. 7). The lesion of patient GZ is difficult to interpret, but there is some evidence that extensive damage to nerve fibers in the inner capsule might have occurred. His lesion will, therefore, not be considered in the subsequent anatomical evaluation.

Axial lesion template reconstructions and tilt planes of the five patients with color constancy deficits: AK, AS, HR, GZ, and RM. The chosen tilt plane is indicated above each row. The templates are shown from the top (left) to the bottom (right) of the brain. The lesioned brain tissue is depicted in black. Note that according to current convention in neuroradiology, the left brain hemisphere is plotted on the right.
Figure 9 shows the superimposed lesions of patients AK, AS, and HR (magenta) and the lesion of RM (yellow), who all had selective deficits in color constancy. Because we did not find any evidence for a hemispheric specificity of color constancy, we mirrored the lesions of patient ASK to the left hemisphere. The lesion of patient GZ is not shown for the reasons given above. Also indicated in Figure 9 in red is the region near the fusiform and lingual gyri (human V4) that is frequently identified with cerebral achromatopsia in humans (Damasio et al., 1980; Lueck et al., 1989; Zeki, 1990; Heywood et al., 1995). The lesion of patient RM (yellow) was quite close to that region, although he had excellent color discrimination. The other three patients (AK, AS, and HR) had overlapping lesions mainly in fronto-parieto-temporal cortex. The region of overlap (magenta) included parts of the superior temporal gyrus and the medial temporal gyrus, which contain higher-order visual association areas (Brodman area 21). Five of the other 22 patients without color constancy deficits (MM, RF, WD, GK, and IH) had lesions covering part but not all of this intersection area. Of these 22 patients without color constancy deficits, 3 (MS, KH, and KB) had lesions completely covering V4, and 2 other patients (MM and MH) had lesions including at least parts of area V4. Interestingly, MS did have some color discrimination problems (see Figs. 6, 7), but her most pronounced deficit was clearly in luminance discrimination (Fig.6A).

Comparison of the lesion locations (overlap) of patients AK, AS, and HR (magenta) and RM (yellow) with the approximate location of lesions reported to cause achromatopsia (red squares). Sagittal, axial, and coronal views are shown in a Talairach coordinate frame (Talairach and Tournoux, 1988). The large, green area indicates the union of the lesions of patients AK, AS, and HR after lateralizing them all to the left hemisphere;blue, overlap of the lesions for any two of the patients; magenta, intersection of the lesions of all three, centered at Talairach coordinates ±c, E1, and 9 (±50, 7, and −8 mm for the standard Talairach brain). The yellow region occipitally shows the lesion of patient RM, which was centered on area V2. The red regions associated with achromatopsia have been termed the “color center” of the brain (Lueck et al., 1989). Most likely, they correspond to area TEO in monkeys (Heywood and Cowey, 1998).
DISCUSSION
Deficits of color perception after cortical lesions, with preservation of primary visual function, are rare and are mainly described after bilateral lesions (for review, see Zeki, 1990). In our clinical study we found that color constancy can be selectively impaired after circumscribed unilateral cortical lesions. Of the 27 patients that we investigated, 5 exhibited significant deficits in a color constancy task. None of these five showed deficits in color discrimination, and only one of them (HR) had deficits in another higher-level visual task, the association of colors with familiar objects. Therefore it seems likely that, in addition to retinal gain control mechanisms (von Kries, 1902; Pöppel, 1986; Foster and Nascimento, 1994), specific cortical circuitry is essential for the computations necessary to achieve color constancy.
Evaluating color constancy poses some difficult problems. We deliberately used a task, achromatic matching, that had been widely used in psychophysics with healthy subjects (Helson and Michels, 1948;Arend, 1993; Bäuml, 1994; Brainard, 1998). The average value of color constancy that we observed in our normal group fell within the range of values observed in these other studies, in which values of 40–60% have been reported for surface matches. When observers are instructed to make “appearance matches,” or if adaptation is insufficient, then much lower values of color constancy (at ∼20%) can be observed (Arend and Reeves, 1986; Bäuml, 1994). However, even these values are clearly above the color constancy indices we observed for the five patients who had deficiencies. Therefore, we are quite confident that the lack of color constancy for these patients was not attributable to insufficient adaptation and/or the wrong matching strategy of the observers (surface vs appearance match).
Partial or “complete” loss of the sensation of color, achromatopsia, is often reported in humans after (bilateral) damage to the area of the fusiform and lingual gyri. The exact locus of the cortical damage producing cerebral achromatopsia remains unknown, but there is agreement that it is generally localized on the ventro-medial part of the occipital cortex within the lingual and fusiform (occipito-temporal) gyri. In all cases reported so far, there is probably damage to part of Brodman’s areas 19, 21, 36, and 37 (for review, see Critchley, 1965; Meadows, 1974; Damasio et al., 1980;Dubois-Poulsen, 1982). However, the visual deficits occurring in these patients are not as color-selective as is frequently assumed, because cerebral achromatopsia is usually associated with severe object and pattern recognition disorders.
One of our five patients with color constancy deficits, patient RM, had a lesion that was close to the fusiform and lingual gyri. In this respect, our study confirms the single case study by Kennard et al. (1995) reporting color constancy deficits. The color vision deficits of their subject B.L. were caused by a viral encephalic illness resulting in macroscopic bilateral infarctions predominantly involving the fusiform gyrus, parts of the lingual gyrus, and the parahippocampal gyrus in addition to multiple small lesions. Although the color perception of this patient recovered slightly over time, his color discrimination for differences in hue and saturation and his color naming remained impaired. Color constancy was tested by asking the patient to name the color of eight test samples at the center of a Mondrian display, alternately illuminated by white, red, green, and blue light. In contrast to control subjects, this patient changed the naming categories of eight test samples with the change of the illuminant. Eight of the 16 changes in color names were consistent with the changes in the chromaticity coordinates of the test colors under the new illuminant. Another seven changes corresponded to an intermediate chromaticity change, suggesting that a color constancy deficit might have led to the color-naming problems.
Little is known about the function of other cortical areas with regard to higher-order tasks such as color constancy. Three of our patients, who displayed deficits in color constancy, had circumscribed unilateral lesions located significantly anterior and temporal to the fusiform and lingual gyri. Although the intersection of their lesions was relatively large and included nonvisual areas, it also included parts of the superior temporal gyrus and the medial temporal gyrus, which contain higher-order visual association areas (Brodman area 21). This is most likely responsible for their color constancy deficits. Patients with deficits in color constancy had lesions in the right (AK) or left (AS and AR) hemisphere. Therefore, our results do not indicate a hemispheric specificity for color constancy.
None of our 27 patients with unilateral lesions showed a severe loss of color discriminability, indicating that the intact hemisphere might enable full color discrimination. Why then is color constancy impaired after unilateral lesions? The answer may lie in the fact that, to achieve color constancy, information needs to be integrated over large regions of the visual field. This might only be possible when both hemispheres interact (Land et al., 1983).
It is remarkable that none of the five patients reported any significant deficits in everyday life. They did not seem to have any obvious disadvantage in the higher-level visuo-cognitive tasks we tested, such as object naming, color naming, or color–object association. Thus, it seems that patients can circumvent their deficits in their natural environments by using other cues to color constancy such as color–object associations. In the laboratory paradigm that we used to measure color constancy, the achromatic matching task, these cognitive cues are unavailable.
The earliest evidence for a specialized area associated with color in primate cortex derives from single-cell electrophysiological recordings in primate monkey. In monkey cortex, cells tuned to wavelength are found in V1, V2, V3, VP, and V4 as well as in areas of infero-temporal cortex (Felleman and Van Essen, 1991). The postulation of a central role of monkey area V4 in color processing, and in particular in color constancy, originates from the electrophysiological recordings made byZeki (1973, 1977, 1978b). He argued that many more neurons in area V4 are tuned to color than in any other cortical area. Furthermore, he claimed that the wavelength tuning of V4 cells is narrower than in other visual areas and that a substantial proportion of V4 neurons are sensitive to perceived color (as judged by human observers) rather than to a fixed band of wavelengths (Zeki, 1980, 1983a,b). He inferred, therefore, that monkey area V4 is the “color center” of the brain, being important not only for color discrimination but also for color constancy.
In principle, area V4, with its large receptive fields and long-range interactions, has all the features necessary to support the computations underlying color constancy (Schein and Desimone, 1990;Desimone et al., 1993). In partial support of this interpretation, Wild et al. (1985) and Walsh et al. (1992), who tested color constancy in monkeys, found mild impairments after lesions to area V4. However, both of the monkeys in the study by Wild et al. (1985) were inferior in hue discrimination to control animals, and one of them was also inferior in a range of other tasks such as shape discrimination. Moreover, in both of these studies color constancy was evaluated using a color discrimination task. Monkeys with V4 lesions had an elevated error score when making color discriminations under different illuminants. Although this task undoubtedly taps certain adaptation mechanisms that might be important for color constancy, it gives, at best, a very indirect measure of color constancy.
The hypothesis of the central role of V4 in color processing has also been challenged by more recent lesion studies. Heywood et al. (1992)reported that in macaque monkeys color discrimination was only mildly affected after bilateral ablation of area V4, whereas their perceptual abilities to recognize forms were severely impaired. Schiller and Lee (1991) and Schiller (1993, 1995) found that, in monkeys, lesions of area V4 seem to affect high-level visual analysis such as object recognition, visual learning, image segmentation, and recognition of transformed objects rather than color perception. Unfortunately, the effect of bilateral V4 lesions on color constancy in monkeys was not tested by these authors. Deficits of color vision similar to those reported in human cerebral achromatopsia, however, were observed in monkeys after ablations in the temporal lobe anterior to area V4 (Heywood et al., 1995). This finding is consistent with older reports of impaired color vision in monkeys after infero-temporal lesions (Gross et al., 1971; Aggleton and Mishkin, 1990). Such results suggest that areas in the superior temporal sulcus (STS) of macaque monkeys, which are known to have large proportions of color-selective neurons (Zeki, 1977; Komatsu et al., 1992), are as important, or even more important, than V4 in determining color appearance. The lesions of our patients AK, AS, and HR almost certainly contained parts of the STS.
On the basis of human brain-imaging work, a different area has been argued to be the cortical region primarily responsible for color perception (Lueck et al., 1989). Using positron emission tomography (PET), Lueck et al. (1989) identified a color-sensitive area near the human fusiform and lingual gyri. They reported that this region was the only extrastriate area that consistently showed a significant (12–14%) increase in activity during the presentation of colored stimuli but not during the presentation of luminance stimuli. One of the underlying assumptions of the study by Lueck et al. (1989), and of many of the single-cell recordings referred to above, is that color is being processed independently of luminance (Zeki, 1978a,b; Livingstone and Hubel, 1984). Therefore, the cortical areas underlying color perception should give a large response to colored stimuli and not respond to luminance stimuli. Based on recent, quantitative single-unit recording studies, this assumption does not seem tenable anymore (Lennie et al., 1990; Gegenfurtner et al., 1996, 1997; Kiper et al., 1997). Most importantly, with respect to color constancy, it is hard to imagine that the computations necessary to achieve color constancy could be executed completely segregated from the same computations necessary to achieve lightness constancy, because most naturally occurring illuminant changes include both changes in color and luminance (Judd et al., 1964). We would expect, therefore, that the regions underlying color constancy should respond equally well to colored and luminance stimuli. Recent, more sensitive PET and functional MRI studies have revealed several cortical visual areas—the region near the fusiform and lingual gyri being just one of them—with such properties (Corbetta et al., 1991; Gulyas et al., 1994;Kleinschmidt et al., 1996; Engel et al., 1997; Wandell et al., 1999).
In summary, much controversy exists about all aspects of the human color pathways beyond the retina. Our data for the first time provide evidence for a selective impairment of color constancy, which may be the most important property of color vision involving the cortex, without any other color vision deficits. They indicate that the computations necessary to achieve color constancy are mediated by specialized cortical circuitry, which is independent of the neural substrate for color discrimination and for assigning colors to objects. In particular, color constancy may require specific cortical circuitry other than that underlying the presumed homolog of monkey area V4.
Footnotes
This work was supported by fortüne Program Grant F.1222104 (Universitätsklinikum Tübingen) and a Hermann-und-Lilly-Schilling Professur awarded to L.T.S. K.R.G. was supported by Deutsche Forschungsgemeinschaft Heisenberg Fellowship Ge 879/4-1. We thank Dorothea Welte for help with the analysis of the anatomical data, Bill Merigan and Heinz Bäuml for valuable comments on an earlier version of this manuscript, and all our subjects for their patience, interest, and support.
Correspondence should be addressed to Karl R. Gegenfurtner, Max-Planck-Institut für biologische Kybernetik, Spemannstrasse 38, 72076 Tübingen, Germany.
Dr. Rüttiger’s present address: Max-Planck-Institut für Biophysikalische Chemie, Am Faβberg, 37077 Göttingen, Germany.


