

Abstract
Permanent noise-induced damage to the inner ear is a major cause of hearing impairment, arising from exposures occurring during both work- and pleasure-related activities. Vulnerability to noise-induced hearing loss is highly variable: some have tough, whereas others have tender ears. This report documents, in an animal model, the efficacy of a simple nontraumatic assay of normal ear function in predicting vulnerability to acoustic injury. The assay measures the strength of a sound-evoked neuronal feedback pathway to the inner ear, the olivocochlear efferents, by examining otoacoustic emissions created by the normal ear, which can be measured with a microphone in the external ear. Reflex strength was inversely correlated with the degree of hearing loss after subsequent noise exposure. These data suggest that one function of the olivocochlear efferent system is to protect the ear from acoustic injury. This assay, or a simple modification of it, could be applied to human populations to screen for individuals most at risk in noisy environments.
Overexposure to intense sound can cause permanent damage to the inner ear and noise-induced hearing loss, depending on the sound pressure, duration, and frequency components of the sound (Saunders et al., 1985). Permanent noise-induced hearing loss can be produced by short-duration, intense stimuli, such as a single firearm discharge at close range, or from repeated, daily exposure to a workplace environment with a steady level of noise (Burns, 1968). More than 9,000,000 American workers have daily job-related sound exposures in excess of 85 dB, i.e., in a potentially hazardous range, where hearing conservation programs are mandated by law (EPA, 1981).
Studies of noise-induced hearing loss, in both humans and animals, document a high degree of intersubject variability: i.e., some individuals have “tough” ears whereas others have “tender” ears (Cody and Robertson, 1983). This variability has complicated the setting of damage risk criteria and acceptable noise exposure limits for the workplace. Despite considerable research, a safe and effective predictor of acoustic vulnerability has never been described. Notably, the vulnerability to minimally traumatic exposures, which produce only temporary hearing loss, does not predict vulnerability to permanent acoustic injury (Ward, 1965).
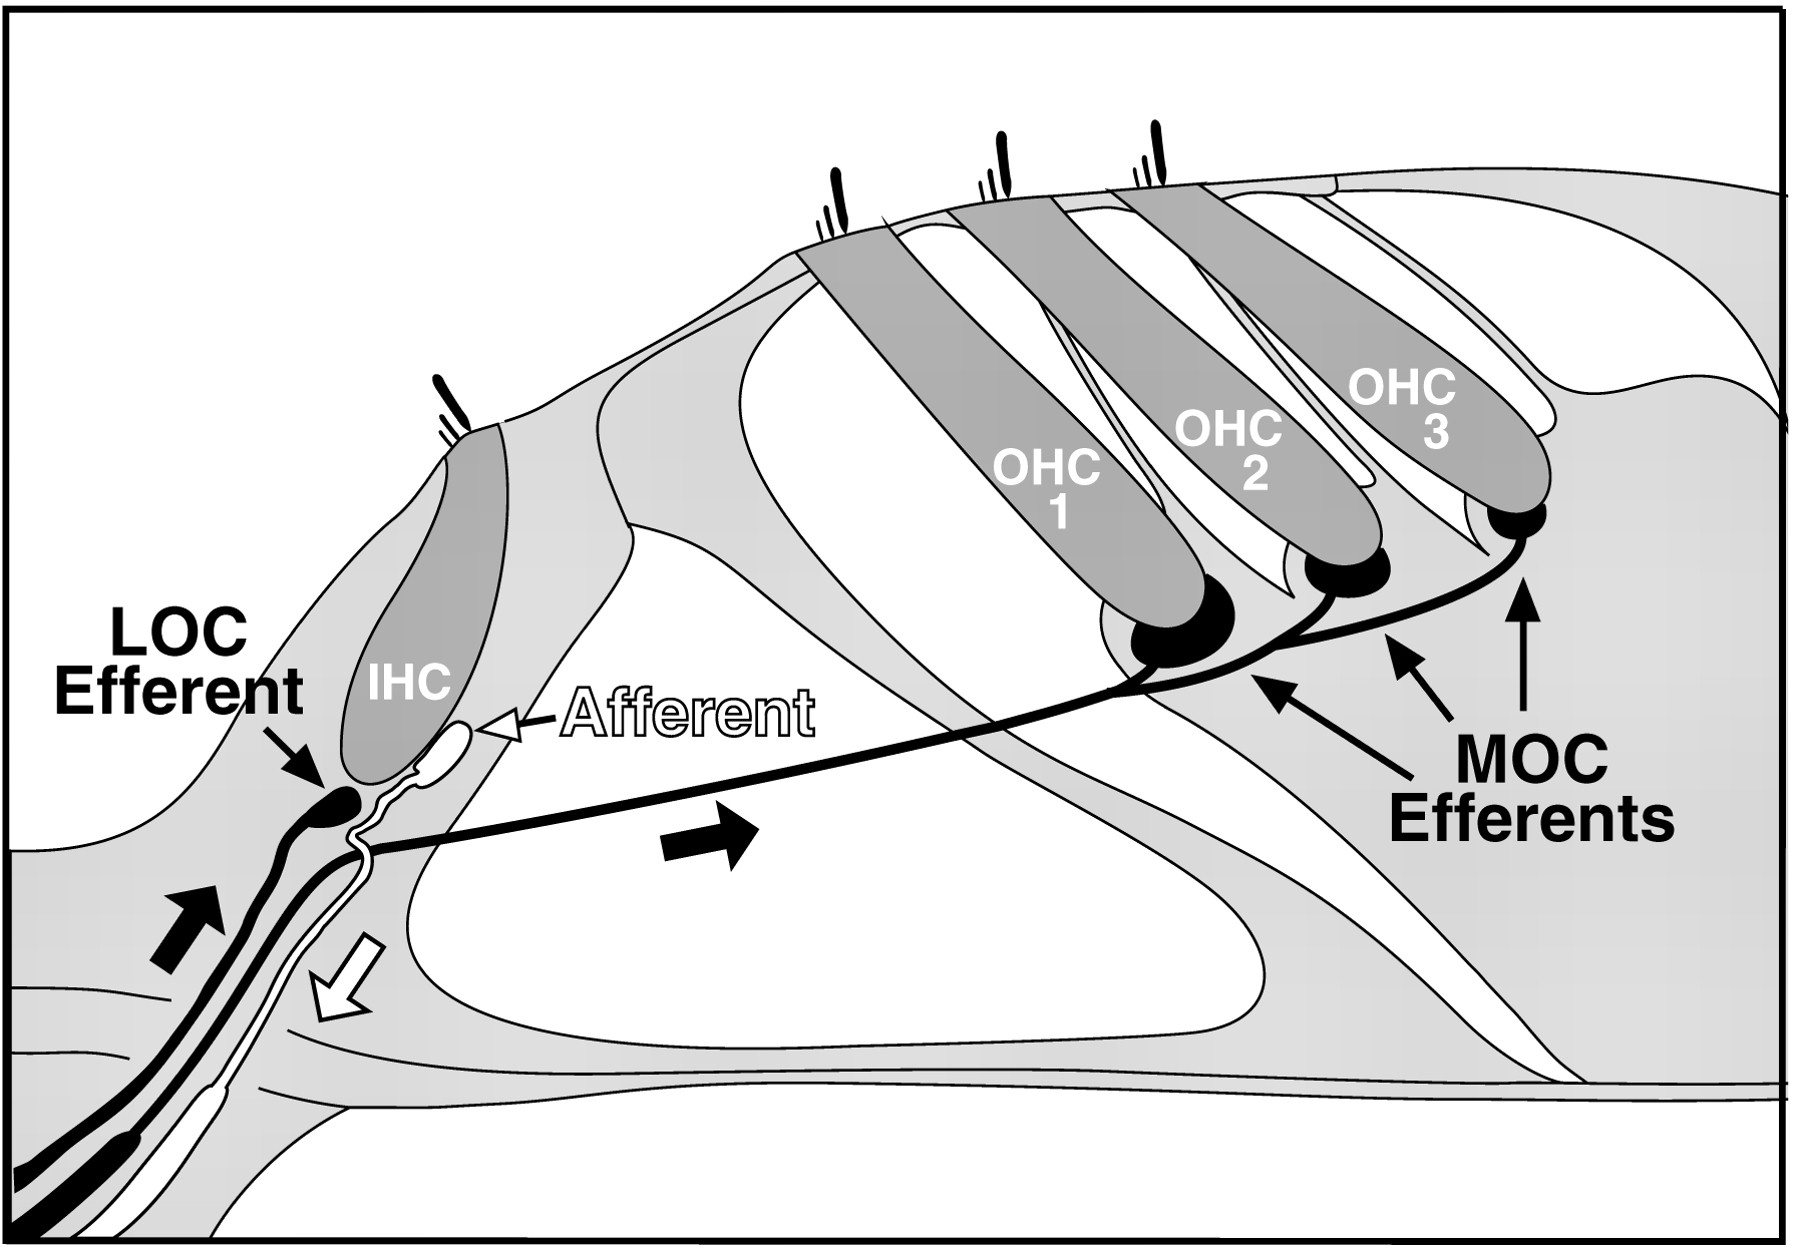
The structural changes underlying permanent noise-induced hearing loss include loss of the sensory hair cells of the inner ear and damage to their stereocilia (Saunders et al., 1985), the modified microvilli which house the mechanically sensitive ion channels that are fundamental to normal hearing. Hair cells in the normal ear form synapses with primary sensory neurons of the auditory nerve, which carry electrical activity conveying auditory information to the brain. Most of these primary afferent fibers contact inner hair cells, which are the primary mechanoelectrical transducers of the inner ear (Fig.1). The outer hair cells, on the other hand, act primarily as electromechanical transducers, or cochlear “amplifiers”, enhancing the mechanical motions inside the inner ear by virtue of their electromotility.

Schematic illustration of a cross-section through the sensory epithelium of the inner ear showing one row of inner hair cells (IHCs), three rows of outer hair cells (OHCs), a single auditory nerve afferent contacting an inner hair cell, a representative efferent fiber from the medial olivocochlear (MOC) system, contacting all three rows of outer hair cells, and an efferent fiber from the lateral olivocochlear (LOC) system contacting the peripheral terminal of an auditory nerve fiber. Bold arrows indicate direction of action potential propagation along the neurons.
In addition to an afferent innervation, the inner ear receives an efferent innervation from the olivocochlear (OC) bundle (Fig. 1). The OC system has been implicated in protecting the ear from acoustic injury: OC electrical stimulation reduces temporary thresholds shifts (TTSs) (Rajan, 1991), and chronic OC section increases permanent threshold shifts (PTSs) (Kujawa and Liberman, 1997; Zheng et al., 1997a,b). The OC bundle consists of two subsystems (Fig. 1): a medial (M) OC component projecting primarily to outer hair cells and a lateral (L) OC component primarily innervating the dendrites of cochlear nerve fibers contacting inner hair cells (Warr et al., 1986). The peripheral effects of the LOC system of unmyelinated fibers are unknown. Electrical activation of the myelinated fibers of the MOC pathway elevates cochlear thresholds (Galambos, 1956; Wiederhold, 1970) and reduces motion of the cochlear partition at low sound pressure levels (Muragasu and Russell, 1996). The functional role of this threshold-elevating feedback system remains controversial. Longstanding hypotheses include mediating selective attention (Oatman and Anderson, 1977) or improving signal detection in noise (Nieder and Nieder, 1970). More recently, protection from acoustic injury has been added to the list.
The MOC system constitutes a bilateral sound-evoked reflex, which can be assayed noninvasively through its effects on otoacoustic emissions (OAEs) (Puel and Rebillard, 1990; Veuillet et al., 1991). OAEs are sounds created within the cochlea, amplified by the action of outer hair cells, and propagated through the middle ear, back out to the ear canal where they can be measured with a microphone (Kemp, 1986). One commonly used test of MOC reflex strength, in humans as well as animals, involves measuring the degree of suppression of an ipsilateral OAE by a contralateral noise (Veuillet et al., 1991), exploiting the fact that some MOC fibers to the ipsilateral ear respond best to sound in the opposite ear (Liberman, 1988b). Studies in both animals and humans have documented the variability in MOC reflex strength among individuals (Liberman, 1988a).
The purpose of the present study was to test, in an animal model, the hypothesis that intersubject differences in MOC reflex strength underlie the differences in vulnerability to acoustic injury. If true, a noninvasive assay of MOC reflex strength assay should be applicable to human populations to screen for individuals most at risk in noisy environments.
MATERIALS AND METHODS
Experimental groups and manipulations. Male albino guinea pigs weighing between 400 and 550 gm were used in the present study. All animals were tested for normal cochlear function by measuring growth functions for distortion product otoacoustic emissions (DPOAEs) in each ear. Measurements were obtained forf2 = 10 kHz, withf2/f1= 1.2, sweeping primary levels in 5 dB steps from 15 to 65 dB sound pressure level (SPL) (with f2level 10 dB lower than f1 level). After the screening procedure, MOC reflex strength was tested on two separate days before the acoustic overexposure. One week after exposure, cochlear function was assessed by a terminal experiment in which cochlear compound action potentials were measured in both ears. All procedures were approved by the Animal Care and Use Committee of the Massachusetts Eye and Ear Infirmary.
MOC reflex strength assay. Distortion products at 2f1-f2were measured in awake guinea pigs with an Etymotics 10C acoustic system in the ear canal. The animals were gently restrained, by hand, while the acoustic system was held in place. Stimuli were generated digitally (20 μsec sampling) using an AO-6 D-A board (National Instruments) in a Macintosh computer under LabView control. Ear canal sound pressure was amplified and sampled every 20 μsec by an A-2000 analog-to-digital (A-D) board (National Instruments). FFTs were computed on successive 10.24 msec waveform segments, and 2f1-f2DPOAE amplitude was extracted to determine DPOAE amplitude versus post-onset time (Fig.2A,B). All measurements were obtained for f2 = 10 kHz;f2/f1= 1.2. At each test session, post-onset adaptation was measured at 176 different level combinations of f1 (11 levels) and f2 (16 levels). This level matrix of 11 × 16 was sampled in the following way. For one “run”, the level of f1 (call itP1) was fixed (e.g.,P1 = 75 dB SPL), whereasf2 level was varied in 1 dB steps fromP1 − 15 dB toP1 dB. Ten more runs were made: each time P1 was incremented by 1 dB (ultimately spanning the range from 75 to 85 dB SPL). These primary frequencies, and this level matrix, were chosen to maximize MOC effects, based on previous systematic work in anesthetized guinea pigs (Kujawa and Liberman, 1998). For each of the 176 level combinations, post-onset adaptation was defined as the difference between the first DPOAE value and the steady-state value (average of the last five points in the trace, corresponding to post-onset times from 475 to 500 msec). As shown in Figure 2, this value is sometimes positive and sometimes negative. A single value of MOC reflex strength was defined after each test session: (1) for each run (with fixedf1 level), the difference was taken between the maximum (positive) and minimum (negative) value of post-onset adaptation for all 16 f2levels in that run; (2) this max − min difference value was averaged across all 11 runs (11 differentf1 values) from that test session.

The noninvasive measure of MOC reflex strength is based on the degree of post-onset adaptation of the DPOAE for primary tones f1 and f2at 10 and 8.3 kHz, respectively. A–C show data from an animal with a strong reflex; D and E from an animal with a weak reflex. At each test session, post-onset adaptation was measured at each of 176 level combinations off1 and f2 (see Materials and Methods). A, B, andD each illustrate raw data, i.e., DPOAE amplitude versus post-onset-time for a single level combination (as indicated in each panel). C and E show the magnitude and sign of the adaptation for all 16 f2 levels tested with f1 = 80 dB, including those extracted from A, B, andD, as indicated by arrows. During one complete test session, data such as those in C orE would be obtained at each of 11f1 levels from 75 to 85 dB SPL (inclusive).
Acoustic overexposure. Animals were exposed, awake and unrestrained, within cages suspended inside a small reverberant sound-exposure box. Animals were assigned to one of three sound exposure groups, differing only in the frequency band of the noise stimulus: group A, a 2–4 kHz band; group B, a 4–8 kHz band; or group C, a 8–16 kHz band. The band of noise was presented at 109 dB SPL for 4 hr. The exposure stimulus was generated by a custom-made white-noise source, filtered (Brickwall Filter with a 60 dB/octave slope), amplified (Crown power amp), and delivered (JBL compression driver) through an exponential horn fitted securely to a hole in the top of a reverberant box. Sound exposure levels were measured at four positions within each cage using a ¼ inch Bruel and Kjaer condenser microphone: sound pressure was found to vary by <1 dB across these measurement positions. Sound pressure was calibrated daily by positioning the microphone at the approximate position of the animal's head.
Final testing of compound action potential. One week after the sound exposure, animals were anesthetized with pentobarbital (25 mg/kg, i.p.) and fentanyl and droperidol (0.2 and 10 mg/kg i.m., respectively). Surgical preparation involved insertion of a tracheostomy tube, exposing the bullae bilaterally and severing the ear canals near the tympanic ring. The bullae were opened by shaving the bone with a scalpel blade. Compound action potentials (CAPs) from both ears were recorded via a silver wire on the round window referred to the tongue. The response was amplified (10,000×), filtered (100 Hz-3 kHz), and averaged with an A-D board in a LabView-driven data acquisition system. CAP thresholds were measured under computer control in response to 5 msec tone pips (0.5 msec rise–fall with a cos2 onset envelope, delivered at 10/sec). At each SPL, 32 responses were averaged. Threshold was defined as the sound pressure required to produce a peak-to-peak potential of 6 μV.
RESULTS
To assay MOC reflex strength, we used a recently developed monaural assay, which measures the post-onset adaptation of distortion product (DP) OAEs (Liberman et al., 1996). When two “primary” tones, f1 andf2, are presented to a normal ear, DPOAEs are created, especially at the frequency 2f1-f2(Siegel et al., 1982). These DPOAEs (1) are created in the inner ear, (2) require normal outer hair cells for their generation and amplification, and (3) can be recorded with microphones in the ear canal. When the primary tones are turned on abruptly, DPOAE amplitude can show post-onset adaptation, with an exponential decay to steady-state (Fig. 2A,B). The time constant of this decay (∼100 msec) is consistent with other measures of peripheral OC effects (Wiederhold and Kiang, 1970; Warren and Liberman, 1989), and the adaptation disappears after cutting the OC pathway (Liberman et al., 1996). Thus, DPOAE decay must arise via OC feedback activity, evoked by the primary tones, which presumably decreases the outer hair cell contribution to cochlear amplification.
MOC reflex strength was defined as the difference (in decibels) between the onset DPOAE and the steady-state value (Fig.2A,B,D). The stronger the reflex, the larger the difference. For animals with a strong reflex (Fig.2A–C), the sign of this adaptation typically progresses from negative to positive values (Fig. 2C) as the level of f2 is swept through the range used (Kujawa and Liberman, 1998). Thus, whenf2 level is well belowf1 level, the DPOAE amplitude increases during post-onset adaptation (Fig. 2B); whereas, when f2 level is closer tof1 level, the DPOAE amplitude decreases during adaptation. This bipolar behavior of OC effects on DPOAEs is also seen when contralateral sound or electric shocks is used to activate the OC pathway (Siegel and Kim, 1982; Liberman et al., 1996): i.e., both these modes of OC activation sometimes increase and sometimes decrease DPOAE amplitudes. The bipolar behavior may arise because DPOAEs comprise the sum of two intracochlear sources (Kim, 1980), which interact constructively or destructively depending on sound pressure level, and may be differentially affected by OC activation. In assessing MOC reflex strength, we consider only the absolute values of the post-onset adaptation.
Each animal was tested in two sessions, separated by ∼1 week. As shown in Figure 3, the results on the first test session were highly correlated with the second session: i.e., some animals had reproducibly strong reflexes, whereas others were reproducibly weak. The range of test results was arbitrarily divided into equal thirds, thus defining three groups: “weak”, “intermediate”, or “strong” reflex.

Repeatability of the DPOAE-based test of MOC reflex strength over two test sessions separated by a week. As shown, the range of test results can be used to arbitrarily divide these 36 experimental animals into those with “weak”, “intermediate”, or “strong” MOC reflex. Reflex strength was tested in only one ear of each animal. Data from all 176 level combination in one test session are combined into a single metric as described in Materials and Methods.
After the second reflex test session, each animal was exposed for 4 hr to an octave band of noise (2–4, 4–8, or 8–16 kHz) at 109 dB SPL. After exposure, each animal survived for 1 week, allowing recovery of temporary noise-induced hearing loss. Then, each animal was anesthetized, and cochlear function was objectively assessed via CAPs. The CAP, the summed neural activity in the auditory nerve, can be evoked by short tone pips. By varying tone-pip frequency, cochlear condition can be assessed along its length from base to apex. PTS was assessed by comparing absolute CAP thresholds in each animal with average normal values in a separate group of unexposed controls (n = 7).
For each exposure condition, the range of PTSs was large, as expected. As shown in Figure 4, for example, among the group exposed at 2–4 kHz, peak PTS in individual animals ranged from <5 dB (a tough-eared individual) to >60 dB (a tender-eared individual). This intersubject variability is greatly reduced when animals are grouped according to the pre-exposure MOC reflex strength (Fig. 5). For each condition, mean PTS was largest among the weak-reflex animals and smallest among the strong-reflex animals. Indeed, in animals with the strongest MOC reflex, mean PTS was <15 dB, whereas those with the weakest reflexes showed >50 dB peak PTS for each of the noise exposure groups. Animals with intermediate reflex strength exhibited intermediate degrees of injury. These intergroup differences in PTS were statistically significant (p = 0.03, by two-way ANOVA) for all pairwise group comparisons in the 2–4 and 4–8 kHz exposure conditions (i.e., weak vs intermediate, as well as intermediate vs strong) if test frequencies >12 kHz were excluded. For the 8–16 kHz group, differences between the strong reflex group and the other two groups were also significant (p = 0.03, test frequencies >12 kHz excluded), although differences between weak and intermediate reflex groups were not.

Variability in PTSs in 12 guinea pigs identically exposed to the 2–4 kHz noise band at 109 dB for 4 hr. PTS is computed by subtracting the average CAP thresholds in seven control (unexposed animals) from the CAP thresholds in each of the 12 animals in this group. Threshold shift curves for two of the 12 animals are highlighted: one particularly vulnerable is shown by the open symbols, and one particularly resistant is shown by thefilled symbols. All others are shown ingray.

Mean values of noise-induced permanent threshold shift in three sets of animals, when grouped according to the pre-exposure strength of their MOC reflex: animals with the strongest reflexes suffer the least threshold shift. The three panels show results from different sets of animals exposed to different noise bands: 12 animals exposed at 2–4 kHz (A), 12 animals exposed at 4–8 kHz (B), and 12 animals exposed at 8–16 kHz (C). Error bars indicate SEM. CAP data were obtained from both ears of each experimental animal.
The correlations between MOC reflex strength and PTS are examined more directly in Figure 6. For this analysis, we first computed the correlation coefficient, at each test frequency, for each of the exposure groups, between PTS and reflex strength: one example (test frequency = 4.02 kHz for group A exposed to the 2–4 kHz noise band) is shown at the left. Then, the correlation coefficients were plotted versus test frequency for each exposure group. The data show (1) for each exposure group, the correlation was strongest for test frequencies near the peak of the PTS and (2) the correlation was equally strong for each of the three exposure groups. These data suggest that OC-mediated protection is present over the full range of exposure frequencies from 2 to 12 kHz.

Correlation between MOC reflex strength and noise-induced PTS is strongest at test frequencies near the peak PTS.A shows the derivation of a correlation coefficient at one CAP test frequency (4.02 kHz) for one group of animals (group A).B shows the correlation coefficient at each test frequency for each of the three exposure groups. Arrowsindicate the test frequency showing peak PTS for each group (from Fig.5).
DISCUSSION
The present study provides compelling evidence that activity in the OC system protects the ear from permanent acoustic injury over a significant portion of the audible frequency range for guinea pig. It also provides an answer to the longstanding question in acoustic injury research as to why some individuals have tough ears while others have tender ears. Our results clearly suggest that differences in the strength of the MOC reflex are a major contributor to these differences in vulnerability.
This result is consistent with previous work showing that chronic cochlear de-efferentation increases the vulnerability to permanent acoustic injury in awake animals (Kujawa and Liberman, 1997; Zheng et al., 1997a,b), presumably because of the lack of normal sound-evoked activity in that pathway. It is also consistent with earlier studies showing that artificial electrical stimulation of the efferent pathway reduced temporary acoustic injury in anesthetized animals (Rajan, 1988,1995).
Nevertheless, it is not yet clear which component or components of this anatomically and neurochemically complex OC system contribute to this protective effect. Existing evidence is, at least partially, contradictory. However, some of the apparent contradiction may arise because some studies have investigated TTSs whereas others measure PTSs. The mechanisms underlying the generation of, and protection from, PTS versus TTS may differ in fundamental ways (Liberman and Mulroy, 1982).
The OC system comprises an MOC component, which is largely cholinergic and projects mainly to the outer hair cells, and an LOC component, which has both GABAergic and cholinergic subsystems, and targets mainly the dendrites of afferent fibers under the inner hair cells (Eybalin, 1993; Guinan, 1996). Efferent suppression, of the type measured in our DPOAE-based assay, is probably mediated by the cholinergic MOC component of the efferent system, directed to the outer hair cells, rather than the LOC component. The most compelling evidence for this is the disappearance of all OC-induced suppressive effects (including those on DPOAEs), in a mouse lacking the α9 cholinergic receptor. This receptor is expressed in outer hair cells, the target of MOC cholinergic fibers, but not in afferent neurons, the main target of LOC cholinergic fibers (Vetter et al., 1999). This result in genetically altered mice is corroborated by a series of studies in guinea pigs (Kujawa et al., 1994; Sridhar et al., 1995), showing that the pharmacological profile for in vivo blockade of OC peripheral effects is identical to that seen in vitro for α9 receptors expressed in oocytes (Elgoyhen et al., 1994), i.e., strychnine is the most potent blocker of both. Strychnine blockade also eliminates the protective effects of OC stimulation in reducing TTS in guinea pigs (Rajan, 1991).
The peripheral effects of MOC activation include elevation of cochlear thresholds and a decrease in the motion of the cochlear duct (Muragasu and Russell, 1996), presumably because of effects on outer hair cell motility of acetylcholine released from MOC synapses. However, such mechanical suppression is only significant at low sound pressures. At high sound pressures, even well below those used here to traumatize the ear, the active contribution of outer hair cells to cochlear motion is swamped by the passive components. Thus, OC-mediated protection is unlikely to be a simple mechanical damping of cochlear motion by the OC system.
Some insight into the peripheral mechanisms underlying OC-mediated TTS protection was suggested by the recent discovery that MOC suppressive effects consist of a fast effect, with onset and decay time constants of ∼100 msec, and a slow effect, with a time constant of tens of seconds (Sridhar et al., 1995). Circumstantial evidence suggested that the slow effect is more likely to underlie OC-mediated TTS protection than the fast effect (Reiter and Liberman, 1995). If true, then TTS protection, like the slow effect, is initiated by a spark of calcium-induced calcium release within the outer hair cells, set off by an initial interaction of acetylcholine with the α9 receptor, thus requiring the MOC system (Sridhar et al., 1997).
On the other hand, there are two pieces of evidence that argue against a key role for the α9 cholinergic system in OC-mediated PTS protection. The first is that knock-out mice lacking the α9 cholinergic receptor do not appear to be more vulnerable to PTSs than their wild-type littermate controls (Yoshida et al., 1999). The strength of these results is tempered by the fact that (1) the strain in which the knock-out was made is exceptionally resistant to acoustic injury and (2) OC-mediated protection from TTS or PTS has never been demonstrated in the mouse. Nevertheless, it is not the result expected from the guinea pig TTS work discussed above. The second piece of evidence is that, whereas completely de-efferented guinea pigs are more vulnerable to PTS, midline lesions of the OC bundle do not increase vulnerability (Kujawa and Liberman, 1997). This result argues against an MOC role, in favor of an LOC role, because midline lesions eliminate 2/3 of the MOC system, while sparing virtually all of the LOC system.
As discussed above, the lack of agreement as to the role of the cholinergic MOC system in cochlear protections may reflect fundamental differences in PTS versus TTS mechanisms. If α9 cholinergic receptors are not necessary for the PTS protective effects, a number of possibilities remain. First, it may be that release of acetylcholine from MOC efferent terminals affects outer hair cells through other, as yet undiscovered, receptors. Second, it may be that the LOC system, either its cholinergic or GABAergic components, underlie the protective effects and that increased MOC reflex strength (as assayed by DPOAE post-onset adaptation) correlates with increased LOC activity. Indeed, indirect evidence suggests that high MOC feedback activity may be correlated with high LOC feedback activity, i.e., that a high MOC reflex strength is indicative of a generally hyper-reflexic state. Although the peripheral effects of activating the LOC system are not clear, the argument for correlation between MOC and LOC activity is as follows. The first piece is that a single-fiber study reported that animals with high levels of sound-evoked MOC activity (i.e., strong MOC reflex) also showed high spontaneous discharge rates in afferents and vice versa (Liberman, 1988a). The second piece is that loss of LOC input to the cochlea appears to result in lower spontaneous activity in auditory afferents (Liberman, 1990). Thus, high MOC activity is correlated with high afferent spontaneous rates, and high spontaneous rates imply high LOC activity.
Regardless of the mechanisms underlying OC-mediated protection, the correlation between MOC reflex strength and vulnerability provides a powerful noninvasive screen for individuals with “tough” versus “tender” ears. MOC reflex strength can be measured in human subjects, based on OAE suppression by contralateral sounds (Veuillet et al., 1991). Furthermore, MOC reflex strength varies among human subjects. Thus, an OAE-based test should also work in human populations. Although there are likely to be a variety of other risk factors in determining the vulnerability to acoustic injury, the present results suggest that OC reflex strength may be the single most important indicator. If true, the ability to identify those most at risk for noise-induced hearing impairment provides a strategy for reducing future injury and compensation claims in the population at large.
Footnotes
This work was supported by the National Institute on Deafness and Other Communication Disorders Grant RO1 DC-0188, The Philippe Foundation, and The Singer-Polignac Foundation. S.F.M. received a Long-Term Fellowship of the Human Frontier Science Program Organization. The skillful assistance of S. J. Hequembourg is gratefully acknowledged.
Correspondence should be addressed to M. Charles Liberman, Eaton-Peabody Laboratory, Massachusetts Eye and Ear Infirmary, 243 Charles Street, Boston, MA 02114-3096. E-mail:mcl{at}epl.meei.harvard.edu.


