

Abstract
Interconnections between orbitofrontal cortex (OFC) and basolateral amygdala (ABL) are critical for encoding and using associative information about the motivational significance of stimuli. Previously, we reported that neurons in OFC and ABL fired selectively to cues during odor discrimination learning and reversal training. Here we conducted an analysis of correlated firing in the cell pairs recorded in the previous study. Correlated firing during the intertrial intervals was compared across task phases during different phases of acquisition and reversal learning. Changes in correlated activity during initial learning and subsequent accurate performance on the discrimination problems closely resembled the changes in odor selectivity in OFC and ABL reported earlier. Increased correlated firing was most pronounced in OFC during accurate go, no-go performance in the postcriterion phase of performance, whereas correlated firing in ABL increased primarily during an earlier phase of learning. In contrast, findings during subsequent reversal training diverged from our earlier report in which odor selectivity diminished in OFC and reversed in ABL. When the reinforcement contingencies of the odors were reversed after the rat had learned the original associations, correlated firing further increased significantly in OFC but remained stable in ABL. This evidence that associative encoding increments with reversal learning in OFC suggests that the original associations, although not expressed as stimulus driven activity, may be maintained within the network as new associations are acquired.
- orbitofrontal
- basolateral amygdala
- prefrontal
- agranular insular
- olfactory
- cross-correlation
- functional connectivity
- electrophysiology
- learning and memory
Electrophysiological studies of neural activity in behaving animals have demonstrated that associative learning alters functional connectivity in the mammalian brain (Segal et al., 1972). Much of this research has used pavlovian conditioning procedures to detect changes in the responses of individual cells to explicit cues that predict biologically significant events (for review, see Davis, 1992; LeDoux, 1996; Thompson et al., 1998). In such investigations, stimulus-evoked neural activity is presumed to provide an index of plasticity that reflects functional connections within neural circuits.
Advances in recording methods now allow simultaneous recordings from small ensembles of individual neurons within a brain region. The use of such methods has shown not only changes in the phasic responses of individual neurons to informative cues but has also revealed more tonic changes in the correlated activity of neurons within networks (Wilson and McNaughton, 1993; Quirk et al., 1995; Vaadia et al., 1995; Skaggs and McNaughton, 1996; Hatsopoulos et al., 1998; Kubota et al., 1999). For example, Quirk et al. (1995) examined correlated firing in lateral amygdala during intervals in the home cage between different phases of a fear-conditioning task. They reported that functional connectivity changed as a result of training and suggested that these changes reflected alterations in the network supporting conditioned neural responses. Similarly, McNaughton and colleagues (Wilson and McNaughton, 1993; Skaggs and McNaugton, 1996) used correlated firing during sleep periods to gain insight into experience-dependent changes in networks of hippocampal neurons. Like studies of stimulus-evoked single unit activity, these studies have used correlated activity as an index of the connectional properties of neural networks.
In the current report, the activity of 1080 pairs of neurons in the orbitofrontal cortex (OFC) and 359 pairs of neurons in the basolateral amygdala (ABL) was examined over the course of learning. During discrimination and reversal training, rats learned that presentations of distinct odors predicted different outcomes, signaling either access to an appetitive (sucrose) or an aversive (quinine) fluid. Previous analysis of the odor-evoked activity in these neurons revealed that 29% of neurons in OFC (96 of 328 cells) and 26% of neurons in ABL (60 of 229 cells) developed responses during sampling of the odors that correlated with the informative significance of the odor cues (Schoenbaum et al., 1999). Neural responses to odor presentation emerged rapidly at a very early phase of training in ABL and later in OFC; the later emergence of discriminative neural correlates in OFC was closely linked to the adoption of a behavioral strategy based on the predictive information provided by the cues. In both OFC and ABL, marked changes in the encoding properties of neurons also occurred when the significance of the odor cues was altered during reversal training. Here we ask whether experience-dependent changes in network properties in OFC and ABL are limited to changes in single unit activity in response to explicit cues or whether alterations in the connectional properties may also be evident in correlated firing outside of the learning trials.
MATERIALS AND METHODS
Subjects. Eight adult male Long–Evans rats served as subjects. The rats were housed individually, maintained on a 12 hr light/dark cycle, and given ad libitum access to food. Water access was restricted during the 24 hr proceeding behavioral testing to motivate performance in the task. During testing periods, the rats received fluid during the performance of the task, amounting to ∼5–10 ml/session, and were given ad libitum access to water in a holding cage after the session was finished. During this time, food was also available.
Electrodes, surgery, and histology. Recordings of extracellular activity were obtained using a driveable bundle of 10 25-μm-diameter NiCrFe microwires (modified from Kubie, 1984). Electrodes were implanted before any training. Rats weighed 325–375 gm at the time of surgery to implant the electrode bundle. Surgical procedures were similar to those described previously (Schoenbaum and Eichenbaum, 1995a). A single bundle was implanted in the left hemisphere in orbitofrontal cortex of four rats (3.0 mm anterior to bregma, 3.2 mm lateral, 4.0 mm ventral) and basolateral complex of amygdala of four rats (3.0 mm posterior to bregma, 5.0 mm lateral, 7.5 mm ventral). The rats were allowed 2 weeks to recover, during which each animal received cephalexin (40 mg · kg−1 · d−1) to guard against infection. Once recording began, the electrode bundle was advanced in 40 μm increments to acquire activity from new cells for the following day. Recording was stopped in a given rat when the estimated position of the electrode bundle was consistent with passage beyond the region of interest. The rats were then deeply anesthetized with sodium pentobarbital in preparation for perfusion. Immediately before perfusion, the final electrode position was marked by passage of a 15 μA current through each microwire for ∼10 sec to create a small iron deposit. The rats were then perfused transcardially using physiological saline, followed by 10% formalin, followed by 100 ml of 10% formalin–3% potassium ferrocyanide solution to visualize the iron deposit. The brains were then removed from the skulls and stored in a 10% formalin–20% sucrose–3% potassium ferrocyanide solution for several days before sectioning. Brains were cut into 30 μm sections surrounding the electrode tracks and stained with thionin, and the electrode tracks were reconstructed to determine approximate recording sites using the marks left by the iron at the tips of the electrodes.
Behavioral methods. Behavioral testing was performed in an operant chamber using a go, no-go olfactory discrimination task. The operant chamber was constructed of aluminum and measured ∼45 cm in height, depth, and width. An odor port and a fluid well were located on the right wall of the chamber, and two panel lights were located above the odor port. A photograph of the ports removed from the training chamber is shown in Figure 1, along with schematics depicting their use in the task. All events and data collection were controlled and monitored by computer as described previously (Schoenbaum et al., 1998, 1999).

Photograph and schematic drawings illustrating the apparatus and behavior in the odor discrimination task.A, Photograph of the Plexiglas insert removed from the operant chamber showing the odor port and the fluid delivery well. The opening of the odor port was ∼2.5 cm in diameter (white circle). Behind the opening was a hemicylinder into which odors were delivered by a computer-controlled system of solenoids and flow meters. Odors were isolated and precisely controlled to provide an onset latency of <40 msec from activation of the solenoid valve controlling delivery. Air flow from the training chamber and into the odor sampling port was maintained at a rate of at least 0.5 l/min to prevent any diffusion of odors from the port into the chamber. The fluid well consisted of a conical depression (black circle) in a 1-inch-deep (front–back) polycarbonate ledge. The depression could easily hold a 0.05 ml bolus of fluid. Four concealed lines entered a central opening in the bottom of the depression to allow the delivery of the two fluid reinforcers, water to flush the well, and attachment of a vacuum-assisted drain line. Fluid delivery and the vacuum drain were controlled by activation of solenoid valves. Infrared photodetectors mounted in the opening to the odor port and in the blocks on either side of the fluid well signaled behavioral responses. B, Schematic drawings illustrating the sequence of behaviors in the go, no-go olfactory discrimination task. On each trial, the rat had to sample an odor presented to an enclosed hemicylinder behind an odor port (Odor Sampling). Nose-poke into the odor port triggered odor delivery. Based on the identity of that odor, the rat then had to decide whether to respond (Go Response) at a nearby fluid well. A go response resulted in delivery of a rewarding sucrose solution, after presentation of a “positive” odor, or an aversive quinine solution, after presentation of a “negative” odor. Novel odors were presented each day, and the rats began each session by responding rapidly after sampling of each odor. Learning was evident in changes in the rat's latency to respond at the fluid well and also in the shift to an adaptive strategy of only responding on positive trails and of withholding responses on negative trials (No-Go). These two measures of learning emerged at different rates (see Fig. 8). Figure adapted from Schoenbaum et al. (1999).
Before the start of the recording phase of the experiment, each rat received several sessions of shaping to perform the basic behaviors required. In these sessions, the rat was trained to poke its nose into the odor port for progressively longer intervals to receive a water reward at the fluid well located on the ledge below the port. Over the course of ∼300 trials, each rat was trained to nose-poke after light onset, wait with its nose in the port through a brief interval for odor delivery, and then hold for another 500 msec during odor presentation. In addition, the response to the well was required to be progressively more rapid for reward to be delivered. By the end of shaping, a response was required within 3000 msec after withdrawal from the odor sampling port. The rats typically made a response to the well in <500 msec. A single demonstrator odor was used during shaping, and no nonreinforced or negative trials were given.
After shaping, each rat was trained on several discrimination problems in which sucrose and quinine were presented. In these sessions, one odor (positive odor) signaled the availability of a 10% sucrose solution, whereas the other odor (negative odor) signaled the availability of a 0.03 m quinine solution. Rats were trained on each problem until they met a criterion of 90% performance in a moving block of 20 trials. In this manner, the rats were introduced to the outcomes associated with the odors and became adept at solving new odor discrimination problems, ensuring a reasonable probability of successful learning during each subsequent recording session.
During recording, a new odor discrimination problem was presented in each session. These discrimination problems involved either two or four novel odors. In the four-odor task, two distinct odors were associated with sucrose and two with quinine. The rats began each session by responding after odor sampling on every trial. Typically, rats would start to withhold responses after sampling the negative odor(s) within the first 20–30 trials. In all sessions analyzed, the rats reached a behavioral criterion defined as 90% accurate performance in a moving block of 20 trials, usually within 60–100 trials. The precriterion phase was then followed by a period of postcriterion training of ∼100 trials, characterized by highly accurate performance (∼85%). Reversal training was conducted in the sessions involving two-odor discrimination problems, and in these sessions, reversal followed a period of postcriterion training.
During all phases of a session, trials were separated by a short intertrial interval. Illumination of two panel lights above the odor port signaled the occurrence of a trial. These lights remained on until the completion of each trial, which occurred when the rat left the fluid well after reinforcement was delivered or when a no-go response was recorded 3 sec after the end of odor sampling. The panel lights were then extinguished for the duration of the intertrial interval. Intertrial intervals were 4 sec after a correct trial and 9 sec after trials in which an error was made. Activity during the final 2 sec of each intertrial interval was used in the current analysis of correlated activity. Thus, this period of analysis does not correspond to the delivery of any signaling event (e.g., house-light dimming, odors, reinforcers) or any behavioral response.
Electrophysiological methods. At the start of each recording session, each wire of the microelectrode bundle was screened for neural activity. If no activity was evident, the bundle of wires was advanced 40 or 80 μm to acquire cells for the following day. If neural activity (S/N ratio > 2½:1) was present on any of the wires, a recording session was conducted. Neural activity on each microwire was passed through a high-impedance JFET head stage, and then differential activity up to eight microwires was filtered at 300–3000 Hz, amplified 5000× using Grass Instruments (Quincy, MA) P5 Series Pre-Amplifiers, and recorded on analog tape along with computer-generated TTL pulses to mark behavioral events using a Vetter Model 400 PCM Data Recorder (AR Vetter, Rebersburg, PA). Later, neural signals were digitized at 25 kHz, and then individual units were discriminated using a template matching algorithm (Cambridge Electronic Design Cambridge, UK) in concert with examination of the oscilloscope tracing. Typically one to three neurons could be discriminated on an active electrode wire. After each session, the electrode bundle was advanced 40 or 80 μm and allowed to stabilize at least 24 hr before the next session. Data were analyzed from 55 sessions in the eight rats. Typically, these sessions were not from consecutive days; thus, neurons were usually isolated from sites separated by at least 80 μm and frequently by larger distances.
Analysis of correlated activity. Correlated activity in simultaneously recorded neuron pairs was examined during the intertrial intervals throughout each session. We analyzed correlated activity within the different phases of training as described previously (Schoenbaum et al., 1999). Briefly, performance in each session was separated into four phases: an early phase comprised of trials before the sixth negative trial (approximating the first no-go), a late phase including the remaining trials before the rat met the behavioral criterion, a postcriterion phase including trials after the criterion was met but before any reversal training, and a reversal training phase including all trials after the reinforcement contingencies of the odors had been reversed. Correlated activity was quantified as the effectiveness (Levick et al., 1972) of the reference cell on the target cell, considering activity within 10 msec of a spike in the reference cell. Effectiveness refers to the probability of firing in the target neuron after a spike in the reference neuron. This value (E) was calculated, within a given region of interest (ROI), as:
 where τ is the number of spikes in the target neuron in the ROI, m is the upper confidence limit of the expected number of target neuron spikes within the ROI, and ρ is the number of spikes in the reference neuron that contributed to the cross-correlogram. Normalization by the reference neuron firing rate assumes a linear relationship between excitability and firing rate. Neurons exhibiting either very low or very high rates of activity may violate this assumption (Melssen and Epping, 1987). As reported previously, the firing rates of neurons recorded in OFC and ABL during intertrial intervals were 3.73 and 1.08 spikes/sec, respectively. To avoid inclusion of cells with very low rates and to provide adequate events for analysis, neurons in the correlational analysis were required to fire at a rate of 1 Hz or greater. At the same time, firing rates for the cells included in the analysis were far below the activity levels reached during stimulus presentation (Schoenbaum et al., 1999).
ROIs included the overall interval from 0 to 10 msec, and intervals from 0 to 2 msec, and 2 to 10 msec in subsequent analyses. The expected number of spikes within the ROI (τx) was calculated as:
 where λτ is the firing rate of the target neuron in the given training phase, ρ is the number of spikes in the reference neuron contributing to the cross-correlogram, and ROI is the region of interest in seconds. We determined the confidence limits by modeling the expected number of target spikes (τx) as an independent Poisson process (Abeles, 1982), so the upper confidence limit was the number of spikes (m) for which:
 Where P is the Poisson formula:

A meaningful interaction was defined as an effectiveness of at least 0.01, indicating that the target cell fired in excess of chance after at least 1 in 100 spikes in the reference cell.
Neuron pairs that exhibited effectiveness in excess of chance of at least 0.01 from 0 to 10 msec during initial training were further examined. Excess effectiveness was calculated in these neuron pairs within time intervals from 0 to 2 msec and from 2 to 10 msec, and the degree of correlated activity in each structure was compared between the previously defined initial training phases (early and late precriterion and postcriterion) by ANOVA for repeated measures, followed by post hoc testing (Tukey's honestly significant difference, p < 0.05). ANOVA for repeated measures was also performed to evaluate the change in correlated activity during reversal training, comparing the effectiveness of interactions during postcriterion trials and reversal trials in the specific pairs recorded during sessions in which reversal occurred.
Finally, changes in correlated activity across these training phases were compared with changes in single unit selectivity described previously for these neurons (Schoenbaum et al., 1998, 1999) and with changes in performance and response latency presented here. Performance accuracy was calculated as the percent of correct trials within each phase. Response times were represented as the difference in average response times between negative and positive trials, measured from the time the rat left the odor port until the rat entered the fluid well. No-go trials were not considered in the calculation of response times.
RESULTS
Figure 2 illustrates the electrode placement in a representative photomicrograph from a rat in which recordings were made in each structure. The schematic drawings in that figure depict the area within which recordings were obtained in each region. Cells were recorded in the ventrolateral and lateral orbital regions and the ventral agranular insular region in the OFC group and in the basolateral nucleus in three rats and the lateral nucleus in one rat in the ABL group. A total of 328 neurons in OFC and 229 neurons in ABL were recorded in rats as they learned novel two-odor (22 sessions) and four-odor (33 sessions) discrimination problems, yielding a total of 1080 pairs in OFC and 359 pairs in ABL that met the criterion for correlational analysis. This population comprised 43% of the available pairs in OFC and 23% of the available pairs in ABL. As documented in the description of our results, the neurons in these pairs were representative of the data obtained from all cells; proportions of neurons with neural correlates in the task were highly similar to the proportions in the total sample. It is also important to note that that average firing rates during intertrial intervals in these cell pairs was relatively stable, changing little across the phases of training. For example, average rates for OFC neurons during intertrial intervals in the three phases of initial training were 8.67, 8.27, and 7.87 spikes/sec; those rates for ABL neurons were 8.88, 8.04, and 7.85 spikes/sec. Although firing rats changes overall were minimal, calculation of efficacy in each phase only considered those events above the number expected by chance given the firing rate of the target cell in the particular phase, and the resultant values were normalized by the phase-specific firing rate of the reference neuron.

Electrode recording sites. Photomicrographs of histological sections showing the reconstruction of recording sites in representative subjects in OFC (A) and ABL (B). In each photomicrograph, a vertical line represents the dorsoventral range along the electrode track from which neurons were recorded in the case shown. To the right of each photomicrograph is a drawing that shows the approximate area in which recordings were obtained in each group. The OFC encompasses the orbital regions and agranular insular cortex. Recordings were localized to ventrolateral and lateral orbital regions (VLO/LO) and ventral agranular insular cortex (AIv) in the four rats in the OFC group. In the ABL group, recordings were localized to the basolateral nucleus in three of the rats (pictured in photomicrograph and as BLAn in drawing) and lateral nucleus in the fourth rat (LAn). Figure adapted from Schoenbaum et al. (1998, 1999), and drawings adapted from Swanson (1992).PIR, piriform cortex; Ald, dorsal agranular insular cortex; int capsule, internal capsule.
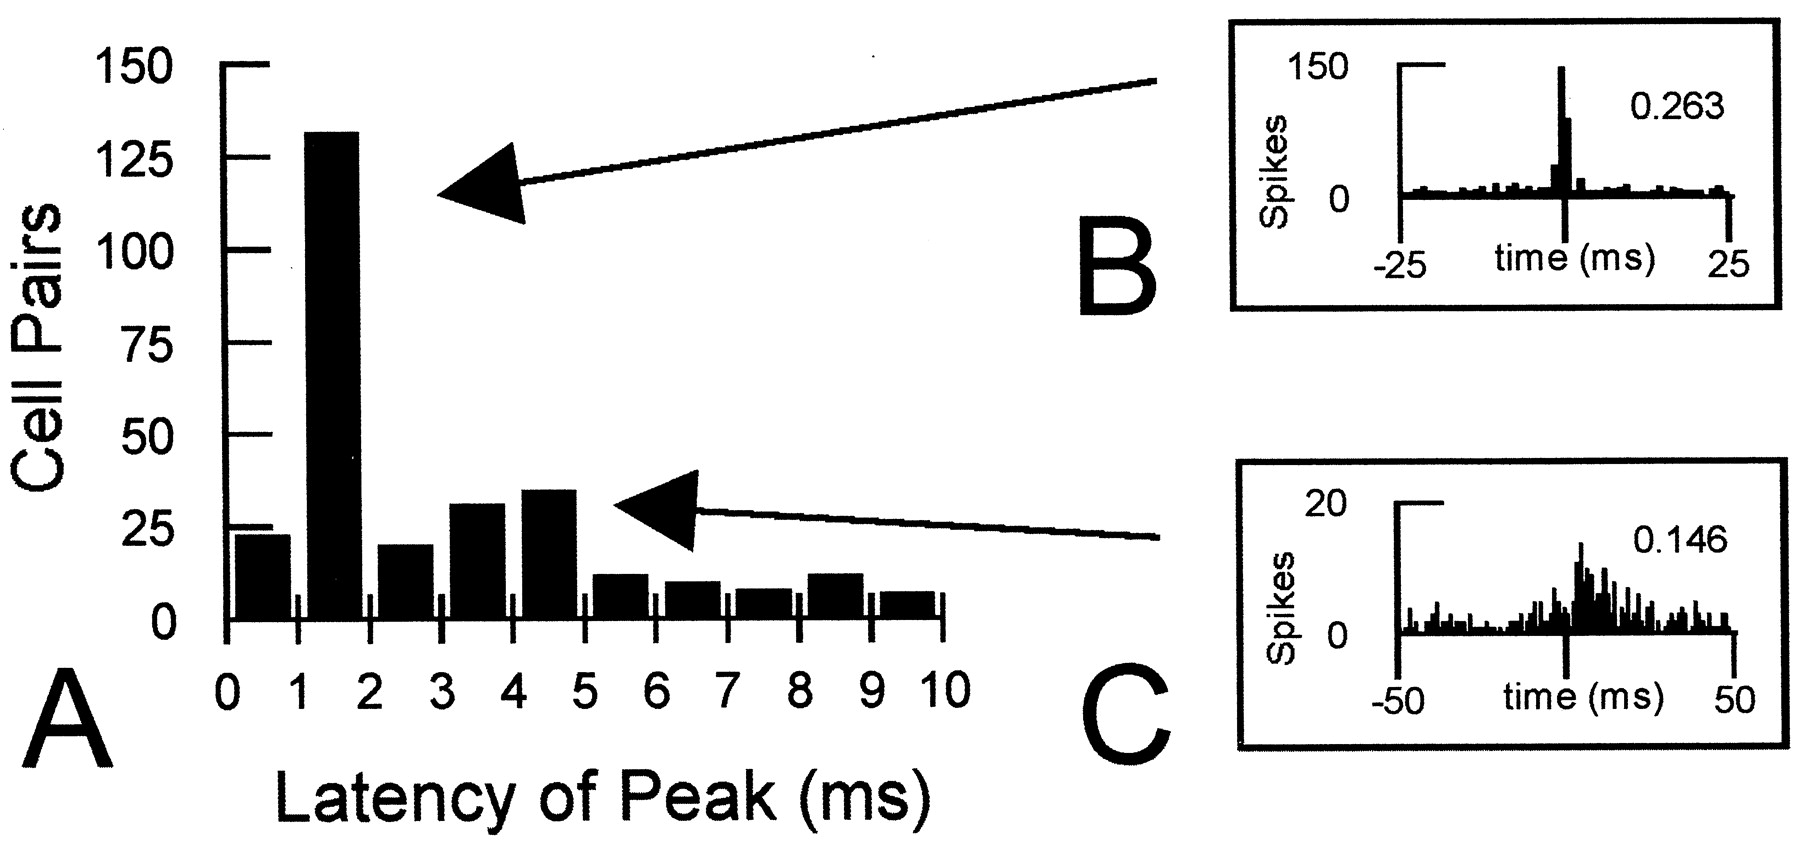
Correlated firing activity was observed during initial training and subsequent reversal training. Overall, the correlational analysis revealed that a population comprised of 250 of 1080 pairs in OFC and 40 of 359 pairs in ABL had an excess effectiveness of at least 0.01 during the phases of initial training. Correlated firing in these neuron pairs was considered with reference to two temporal categories of responses similar to categories identified previously in rat cochlear nucleus (Gochin et al., 1989), cat visual cortex (Hata et al., 1991), and more recently in rat lateral amygdala (Quirk et al., 1995). These reports identified short latency responses, exhibiting a peak within 1 or 2 msec of time 0 on the cross-correlogram, and also longer latency responses, typically with a peak further displaced from time 0. Analysis of pairs with significant interactions during initial training revealed similar peaks to be present in the current data. Figure3A shows the distribution of peak responses within 10 msec of time 0 for the cell pairs considered in this analysis. Note the sharp peak in firing of target neurons that occurs at a latency of 1–2 msec and a less pronounced peak occurring 3–5 msec after spikes in the reference cell. This pattern corresponds to those in earlier reports and appears to reflect the presence of two types of pairs similar to the examples shown in Figure 3, Band C. Some pairs exhibited a restricted peak of correlated activity close to time 0 (Fig. 3B). Other pairs had peaks that were more broadly distributed and displaced from time 0 (Fig.3C). As described below, somewhat different patterns were evident for short and longer latency responses in relation to phases of the task for OFC and ABL pairs.

Correlated firing patterns in OFC and ABL. A, Latency of correlated firing in the cell pairs analyzed for OFC and ABL. Cross-correlograms with a bin size of 1 msec were constructed for cell pairs recorded simultaneously in either OFC or ABL using activity during the intertrial interval of postcriterion training. The latency of the response in each cell pair was designated as the bin within 10 msec of time 0 with the highest spike count on the cross-correlogram. The graph (A) reveals a large peak for cell pairs centered at 1–2 msec and an additional smaller peak at 3–5 msec after activity in the reference neuron. B, Cross-correlogram showing correlated firing in a neuron pair exhibiting a short latency interaction; the effectiveness of the interaction above chance is shown in the top right. The short latency interactions appeared to reflect the presence of pairs with restricted peaks close to time 0. C, Cross-correlogram showing correlated firing in a neuron pair exhibiting a longer latency interaction. The longer latency interactions were typically weaker and reflected cell pairs with a more displaced and broader pattern of correlated activity.
Correlated firing in OFC increased during accurate performance and after reversal
Figure 4 shows the effect of initial training on correlated activity in OFC neuron pairs partitioned into short and longer latency windows based on the two types of responses illustrated in Figure 3. The strength of the interactions increased significantly with training in both the short (Fig.4A) and longer (Fig. 4B) latency windows. These increases came primarily during the postcriterion phase of training when reliable discrimination performance was established (see Fig. 8) and when the individual neurons developed differential firing during odor sampling (Schoenbaum et al., 1999). It is important to note that average firing rates changed little in the pairs of neurons represented in Figure 4. Average rates for these cell pairs, shown in Figure 4C, were 8.54, 8.02, and 7.55 spikes/sec in the early, late, and postcriterion phases, respectively. These small changes stand in contrast to the large differences in correlated activity observed.

Changes in correlated activity in OFC during intertrial intervals in the early (white bars) and late (black bars) phases of precriterion training, during postcriterion performance (gray bars), and after reversal (striped bars). A, Correlated activity at short latency (within 2 msec of a spike in the reference cell) increased significantly during initial training (F(2,498) = 13.0; p< 0.001). Post hoc comparisons revealed no significant difference between the early and late phases of precriterion training (p = 0.183). However, correlated activity in the postcriterion phase differed significantly from each of the precriterion phases (p < 0.001 andp = 0.003 for early and late, respectively). A separate analysis of neuron pairs recorded during reversals revealed that efficacy of correlated firing within the short latency interval increased further after reversal (F(1,140) = 14.5; p< 0.001). B, Correlated activity at longer latency (2–10 msec after a spike in the reference cell) also increased significantly during initial training (F(2,498) = 90.1; p< 0.001). Efficacy in OFC differed between the early and late precriterion phases (p = 0.0386), and a significant increase in the postcriterion phase was also evident compared with each of the precriterion phases (p < 0.001 for both comparisons). Efficacy of correlated firing within the longer latency interval increased further after reversal (F(1,140) = 58.3; p < 0.001). C, Activity in cell pairs with correlated activity in OFC. Average firing rate is shown for both neurons within each pair that was included in the analyses presented in A and B. Note the difference in both pattern and magnitude between the minimal changes in activity and the changes in correlated firing across the training phases.
Correlated firing increased further in OFC cell pairs between the postcriterion phase and reversal training when the pairs recorded during reversals were analyzed. An increase was seen for both the short (Fig. 4A) and the longer (Fig. 4B) latency interactions. The increase observed in correlated activity here differs markedly from the disruptive effect that reversal had on selectivity during odor sampling reported previously for these neurons (Schoenbaum et al., 1999). Again, changes in correlated firing were observed in neuron pairs that exhibited little or no change in overall activity (Fig. 4C). The cells in these pairs fired at a rate of 7.84 spikes/sec before reversal, and after reversal the average firing rate was essentially unchanged at 7.87 spikes/sec.
Examples of interactions between neuron pairs in OFC are illustrated in Figure 5. The neuron pairs in thetop panels of Figure 5, A and B, show increases in short latency and longer latency interactions, respectively, during postcriterion training that were not present in earlier training phases. Similarly, the neuron pairs in thebottom panels of Figure 5, A and B, developed significant interactions that increased greatly after reversal.
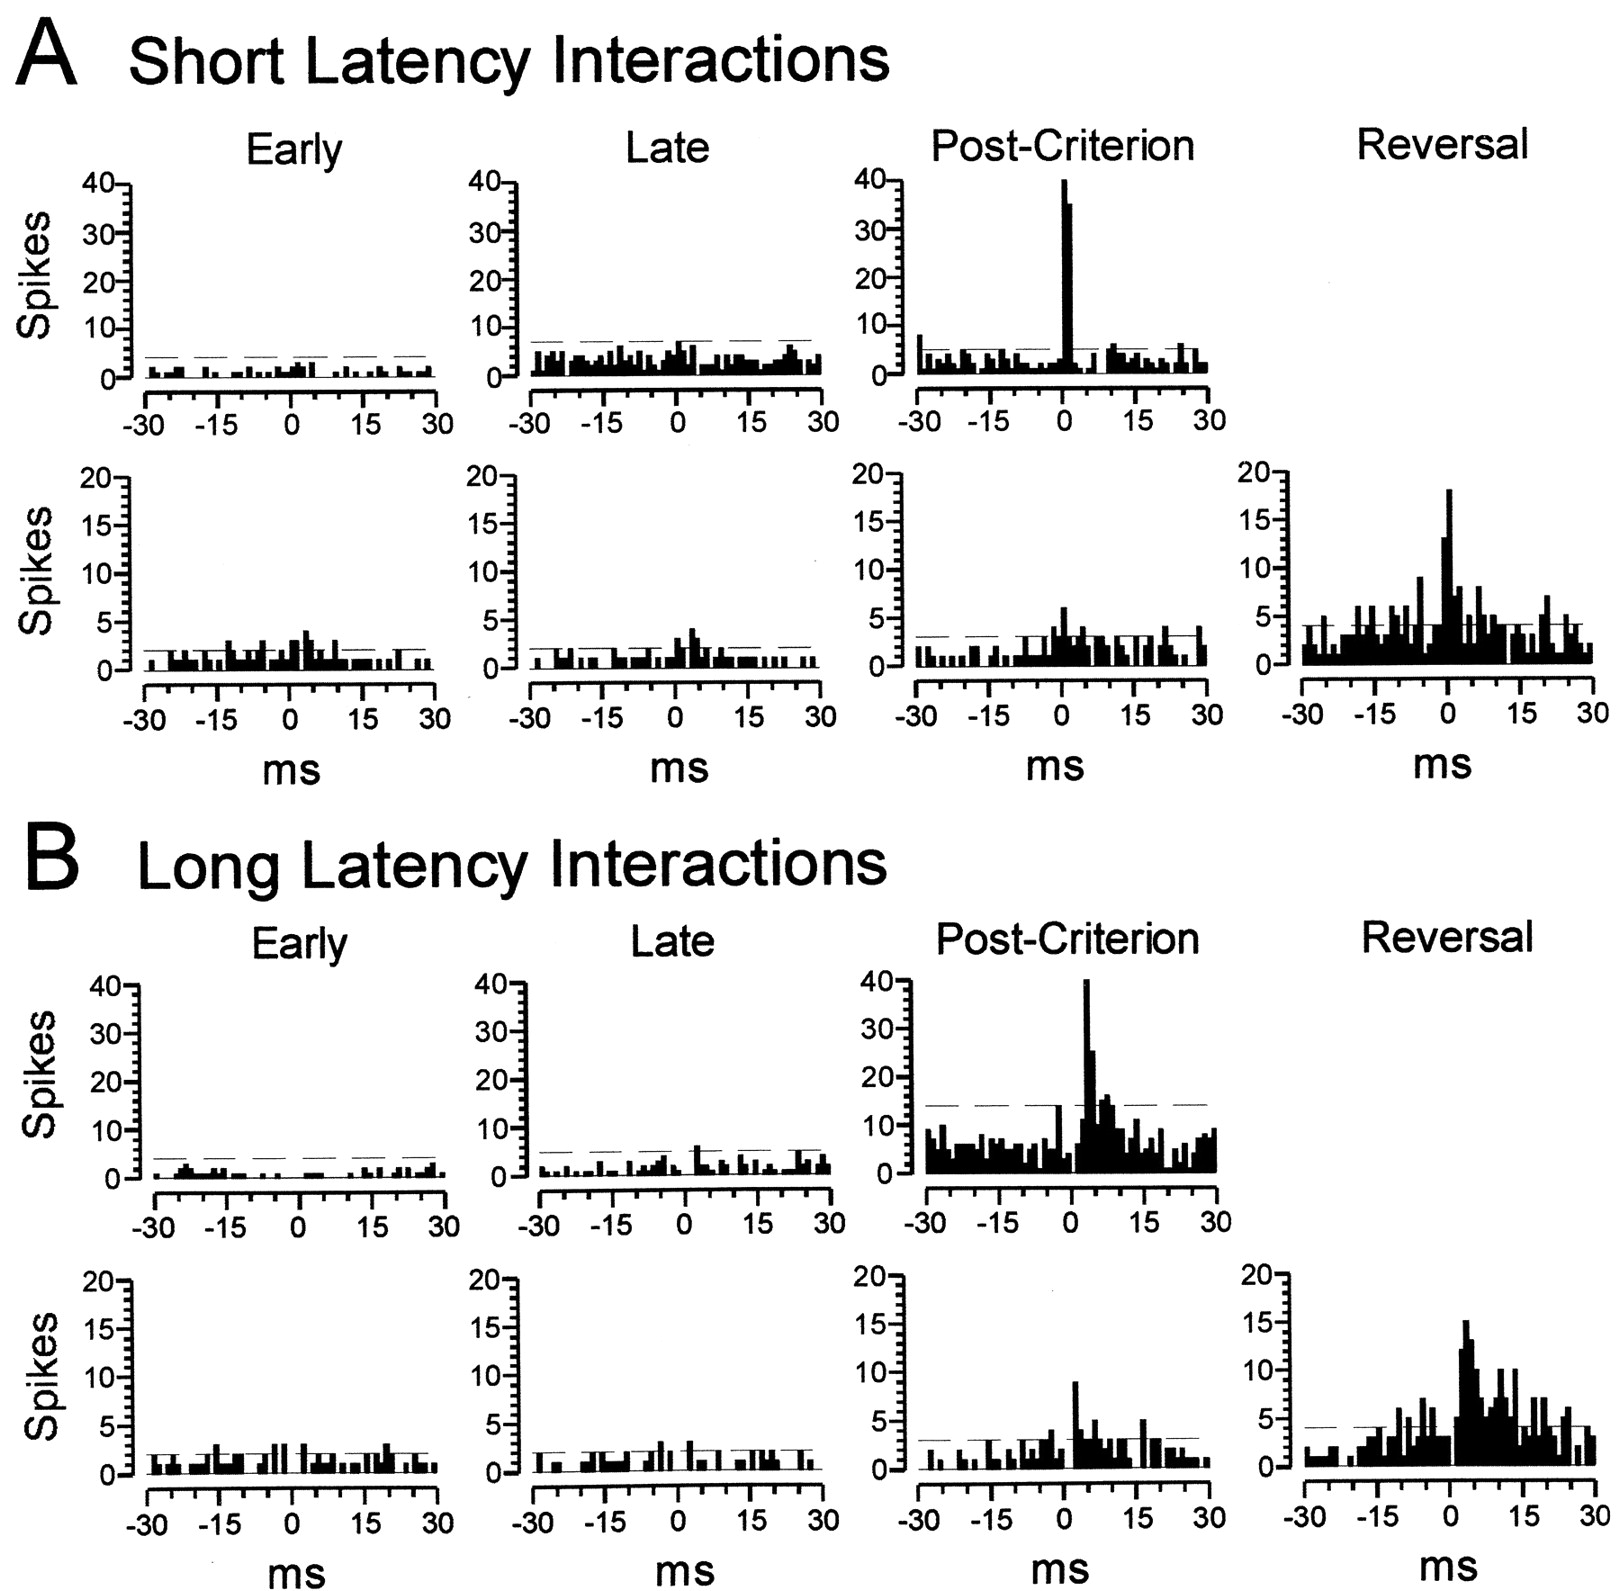
Cross-correlograms for neuron pairs in OFC showing correlated activity within the intertrial intervals during the early and late phases of precriterion training, during postcriterion performance, and after reversal. A, Typical examples of neuron pairs with short latency interactions (0–2 msec).B, Typical examples of neuron pairs with longer latency interactions (2–10 msec). Values are shown in spikes per 1 msec bin, and the horizontal dashed lines on each correlogram designate the upper confidence limit (p < 0.01) for the interactions (see Materials and Methods). Precriterion training is divided into an early and late phase as described in Materials and Methods, and data from reversal training are shown for neuron pairs recorded during reversal sessions. Note that the confidence limit varies somewhat between graphs in some cases, reflecting small changes in firing rate. Although these changes were minimal, they were incorporated into the calculations of efficacy.
Correlated firing in ABL increased rapidly during initial training but showed no further increase after reversal
In contrast to findings in OFC, correlated activity in ABL increased more rapidly during initial training, before criterion performance was achieved. Figure 6 shows the effect of training on correlated activity in ABL neuron pairs partitioned into short and longer latency windows. Although no significant effect of training was evident in the short latency interactions, the longer latency interactions increased significantly, and post hoc analyses showed that this increase occurred between the early and late phases of precriterion training when the rats first began to respond differently to the odors (see Fig. 8). The late phase was also the period when the individual neurons in ABL developed differential firing during odor sampling (Schoenbaum et al., 1999). Note again that firing rates remained relatively stable in the neuron pairs represented in Figure 6. Average firing rates, shown in Figure 6C, were 7.90, 7.44, and 7.00 spikes/sec during the early, late, and postcriterion phases, respectively.

Changes in correlated activity in ABL during intertrial intervals in the early (white bars) and late (black bars) phases of precriterion training, during postcriterion performance (gray bars), and after reversal (striped bars). A, Correlated activity at short latency (within 2 msec of a spike in the reference cell) did not change significantly during training in ABL (F(2,78) = 0.48; p= 0.62). A separate analysis of neuron pairs recorded during reversals also revealed no change in correlated activity at this latency (F(1,19) = 2.31; p= 0.14). B, Changes in correlated activity at longer latency (2–10 msec after a spike in the reference cell) increased significantly during initial training (F(2,78) = 6.29; p= 0.0029). Post hoc comparisons revealed that efficacy increased between the early and late precriterion phases (p = 0.0147) but did not increase in the postcriterion phase relative to the late precriterion phase (p = 0.924). Efficacy of correlated firing within the longer latency interval did not change further after reversal (F(1,19) = 2.3;p = 0.14). C, Activity in cell pairs with correlated activity in ABL. Average firing rate is shown for both neurons within each pair that was included in the analyses presented inA and B. Note the difference in both pattern and magnitude between the minimal changes in activity and the changes in correlated firing across the training phases.
Correlated firing in ABL also did not change significantly during reversal training in either the short or the longer latency time interval (Fig. 6). This pattern is in marked contrast to the results of the analysis in OFC (Fig. 4) and also differs from changes in odor selectivity reported to occur after reversal in ABL neurons (Schoenbaum et al., 1999). Instead of increasing, as correlated activity did in OFC, correlated firing remained primarily unchanged in these ABL cell pairs after reversal. As in the previous comparisons, the average rates of the neuron pairs in this analysis remained relatively stable (Fig. 6C). The neurons in these pairs fired at 6.04 spikes/sec during the postcriterion phase and at 5.60 spikes/sec during reversal training.
Examples of correlated firing in individual pairs of ABL neurons are shown in Figure 7. These examples illustrate the patterns depicted in Figure 6. For example, both neuron pairs showing short latency interactions in Figure 7Aexhibited correlated firing across all initial training phases. Moreover, the effectiveness of the interactions in the top panel did not increase after reversal and, in fact, appeared to decrease somewhat. In contrast, the neuron pair showing longer latency interactions in Figure 7B developed significant interactions during the late portion of precriterion training that were not present during early training. The efficacy of this interaction was then maintained primarily unchanged during postcriterion training and after reversal.

Cross-correlograms for neuron pairs in ABL showing correlated activity within the intertrial intervals during the early and late phases of precriterion training, during postcriterion performance, and after reversal. A, Examples of neuron pairs with short latency interactions (0–2 msec).B, Example of neuron pair with longer latency interactions (2–10 msec). Values are shown in spikes per 1 msec bin, and the horizontal dashed lines on each correlogram designate the upper confidence limit (p < 0.01) for the interactions (see Materials and Methods). Precriterion training is divided into an early and late phase, and data from reversal training are shown for neuron pairs recorded during reversal sessions. Note that the confidence limit varies somewhat between graphs in some cases, reflecting small changes in firing rate. Although these changes were minimal, they were incorporated into the calculations of efficacy.
Correspondence between learning, performance, and selective firing to cues within the trial and correlated firing during intertrial intervals
In our previous analysis of this data set (Schoenbaum et al., 1999), we reported that a substantial proportion of neurons in OFC and ABL developed differential activity during odor sampling that depended on the significance of the cue presented on the trial, i.e., whether it signaled sucrose or quinine. Among neurons recorded in OFC, 29% exhibited significant odor selectivity that was present during postcriterion training but not evident earlier in the training sessions (Fig. 8A). In contrast, many neurons in ABL that exhibited selectivity postcriterion (26% of recorded cells) developed this property by the late phase of precriterion training (Fig. 8B). As has been noted in the presentation of the results, the development of odor-selective firing activity and the changes in correlated firing during the intertrial intervals followed very similar courses during initial acquisition. The development of selectivity in OFC neurons coincided with the acquisition of accurate go, no-go performance (Fig.8C), whereas the development of selectivity in ABL neurons coincided with the earlier emergence of a response latency difference between trials with positive and negative outcomes (Fig.8D). The same relationship is evident between the emergence of correlated activity in the two regions and the measures of learning.

Changes in neural activity during odor sampling and behavioral measures of learning during initial training. Contrast in activity of neurons in OFC (A) and in ABL (B) during odor sampling in the early (white bars) and late (black bars) phases of precriterion training and during postcriterion performance (gray bars). The activity contrast was calculated as the difference in firing rate during sampling of positive and negative odors divided by the sum of those rates, expressed with reference to the preferred odor during postcriterion trials. Activity between trials was used to calculate a baseline contrast of 0.04 for OFC and −0.01 for ABL. ANOVA with post hoc testing showed that selectivity in OFC differed significantly from baseline only during postcriterion training, whereas selectivity in ABL differed in the late and postcriterion phases (*p < 0.05).C, Go, no-go performance in the early and late precriterion and the postcriterion phases (chance, 50%).D, Changes in differential response latency in the early and late precriterion and the postcriterion phases. The latency difference increased significantly (F(2,156) = 6.69; p= 0.0016) from the early to the late phase of precriterion training (*p < 0.05). Latency to respond on positive trials remained near 350 msec across training; thus, the increase was primarily attributable to increases in latency to respond on negative trials. The increase in selectivity in OFC neurons postcriterion (A) coincided with improved accuracy in go, no-go performance (C). Changes in selectivity in ABL neurons (B) coincided more closely with changes in the differential response latency across the training phases (D). A andB were adapted from Schoenbaum et al. (1999).
We examined whether pairs of neurons that showed increased correlated firing during the intertrial intervals might preferentially involve those neurons that also encode the significance of the odor cues during training trials. Neuron pairs with significant correlated activity included 186 cells in OFC (Fig. 4) and 45 cells in ABL (Fig. 6). Of these neurons, 30% (56 cells) in OFC and 37% (17 cells) in ABL had significant odor selectivity in the discrimination task, proportions that approximate the prevalence of odor-selective neurons in the total sample of neurons recorded in each region (Schoenbaum et al., 1999). Thus, correlated activity does not disproportionately involve those neurons that exhibit changes in firing activity during odor sampling as a result of training.
We also know that neurons in OFC and other prefrontal regions can encode an expectancy for upcoming events (Schoenbaum and Eichenbaum, 1995a; Watanabe, 1996; Lipton et al., 1999; Tremblay and Schultz, 1999). Cells in amygdala show similar correlates in some circumstances (Quirk et al., 1997). In fact, an earlier account of these data found that some neurons in each structure developed differential activity related to the rats' expectation of reinforcement within the trial (Schoenbaum et al., 1998). Approximately 22% of neurons in OFC and 36% of neurons in ABL fired differently during a brief delay after each response depending on which reinforcer had been signaled by the odor on the trial. The majority of those neurons only fired differentially after the rats had learned to distinguish between positive and negative odors based on their associative significance; thus, the differential firing appeared to reflect expectancy for reinforcement.
Although the rats had no basis for forming expectancies regarding the upcoming trial during the intertrial intervals, changes in expectations within the trial as a result of learning might have also accounted for the changes in correlated firing observed in this report. We examined whether pairs of neurons that showed increased correlated firing during the intertrial intervals might preferentially involve those neurons that developed differential firing during the trials based on the rats expectation of reinforcement. Only 24% (45 cells) of the 186 neurons analyzed in Figure 4 and 40% (18 cells) of the 45 neurons analyzed in Figure 6 developed differential activity in our earlier study. Again, these proportions are similar to the prevalence of such correlates in the total sample from which recordings were made (Schoenbaum et al., 1998), so correlated activity does not disproportionately involve neurons that develop anticipatory firing as a result of training in the discrimination task.
DISCUSSION
Changes in correlated activity may reflect neural plasticity that alters functional interactions between neurons (Perkel et al., 1967;Abeles, 1982; Aertsen et al., 1989; Hata et al., 1991; Quirk et al., 1995; Hatsopoulos et al., 1998). In the present report, correlated activity in OFC and ABL was examined in intertrial intervals across phases of a learning task. Previous analysis of these neurons revealed the development of encoding in both OFC and ABL for informative cues during training trials (Schoenbaum, 1998; Schoenbaum et al., 1998, 1999). The current analysis revealed that correlated firing within the intertrial intervals also changed over the course of training in a partially nonoverlapping population of neurons. In interpreting these findings, two separate questions must be addressed. One question concerns whether the changes in correlated firing reflect functional connectivity rather than other potentially confounding factors. A second and more interesting question concerns what information is represented by the changes in neural interactions observed.
Correlated firing as an index of functional connectivity
As others have noted (Melssen and Epping, 1987; Palm et al., 1988;Aertsen et al., 1989; Fetz and Schupe, 1994; Brody; 1999), peaks in the cross-correlogram for any pair of neurons may represent factors independent of neural plasticity or functional interactions between cells. Specifically, such sources include covariations in excitability or changes in activity in cells that are concurrently driven by some stimulus. These sources do not appear to account for the current results. Average rates changed little across phases of the task, even within the neural pairs that formed the basis of our findings (Figs. 4,6). Such changes that occurred were also considered in the analysis by incorporation of the phase-specific firing rates of the neurons in the equations used to calculate “excess” efficacy (see Materials and Methods for description of procedure). Stimulus-driven effects are also unlikely to be a source for changes in correlated activity in our analysis primarily because our analysis was confined to a segment of the intertrial intervals when no controlled stimuli were presented. Moreover, the narrow peaks observed in the cross-correlograms differ greatly in time scale from the stimulus-driven responses reported previously (Schoenbaum et al., 1999), conforming to a criterion for excluding such effects (Brody, 1999). Excluding those sources, changes in correlated firing during the intertrial intervals are likely to reflect alterations in functional connectivity.
Changes in functional connectivity as an index of learning
Although many different variables might be represented in the neural interactions observed during the intertrial intervals in the task, the changes in functional connectivity were closely related to learning and changes in behavioral performance in the task. Correlated activity in OFC changed most markedly between the early precriterion phase, when the rats first encountered novel odors, and the postcriterion phase, when those odors had become the basis for reliable performance of an adaptive response strategy. In contrast, an increase in correlated activity in ABL was confined to a late phase of initial training before rats achieved criterion. These patterns bear a striking resemblance to the patterns in both the single cell responses and behavioral measures illustrated in Figure 8. Firing characteristics of OFC neurons during odor sampling reflect odor significance as a function of the go, no-go performance in the task, whereas characteristics of ABL neurons during sampling appear to be independent of this behavioral measure, reflecting instead an earlier index of learning evident in the rats' response latencies after sampling odor cues. It is particularly noteworthy that, although changes in both correlated activity during the intertrial intervals and stimulus-driven firing selectivity appear to map onto behavioral measures (Fig. 8), there was not a disproportionate representation of the odor-selective neurons in the population of cells involved in correlated activity. This observation suggests that the analysis of correlated firing reveals changes in functional connectivity that are not readily apparent in traditional approaches to the study of learning-induced synaptic change. A substantial proportion of neurons involved in changes in correlated activity do not exhibit selective firing during stimulus presentations in the task but nonetheless may participate in alterations in networks that are important for the learning that occurs.
Although learning processes appear to be a likely basis for the changes reported here, other factors that might conceivably have influenced functional connectivity during training deserve comment. Such factors may include changes in motivational state or arousal. Although such variables may well be represented in the correlated firing, they are unlikely to provide an account for the changes that were observed between phases of the task. Motivation remained at a high level across the phases in which changes in correlated activity were observed as indicated by latencies to respond after odor sampling. For example, responding after sampling the odor that signaled the positive outcome of a sucrose solution occurred equally rapidly in the precriterion and postcriterion phases (370 ± 18.1 and 366 ± 16.2 msec, respectively). Another index of motivational state across sessions is provided by the relative ease of reversal learning when contingencies were altered at the end of the postcriterion phase. In addition, generalized changes in motivational state or arousal might be expected to yield similar patterns of change in correlated firing in the two brain systems. This was clearly not the case. Rather, the changes differed between OFC and ABL and coincided more closely to the patterns observed in the behavioral measures of learning and in the neural correlates of task-relevant cues in each region.
Similar arguments may be made for contextual cues, such as the house lights or features of the box interior. These cues remained constant throughout each session and, therefore, are unlikely to account for changes in correlated firing between phases, particularly because the rats were well experienced in the training environment before recording began. One exception to this rule was the length of the intertrial intervals. These intervals varied between 4 and 9 sec depending on whether the previous trial had been completed correctly. Because the rats made fewer errors as each session progressed, the proportion of 9 sec intervals decreased across the phases of initial training. A difference in correlated firing related to the duration of the intertrial interval might have thereby led to a change in efficacy across these phases, as we have reported. Two factors, however, argue against this explanation for our findings. First, correlated activity increased in OFC and remained stable in ABL after reversal, despite the fact that the proportion of 9 sec intertrial intervals increased substantially during the reversal phase, representing a proportion similar to the early and late phases of precriterion training. Second, there is no readily apparent reason to expect any effect of interval length to differ between OFC and ABL, yet correlated firing did change differently in the two regions.
The changes in correlated activity in OFC and ABL can be viewed in the context of other evidence that these areas are important in adaptive behaviors based on associative learning. The integrity of orbitofrontal cortex is particularly important for the use of motivational information in decision-making (Harlow, 1868; Jones and Mishkin, 1972;Bechara et al., 1997; DeCoteau et al., 1997; Gallagher et al., 1999), a role supported by functional neuroimaging studies with humans (Rogers et al., 1999) and recording studies with laboratory animals (Thorpe et al., 1983; Schoenbaum et al., 1995; Rolls et al., 1996; Schoenbaum et al., 1998, 1999; Lipton et al., 1999; Tremblay and Schultz, 1999). ABL, too, is crucial to certain behaviors based on associative learning (Kluver and Bucy, 1939; Jones and Mishkin, 1972; Tranel and Hyman, 1990; LeDoux, 1996; Hatfield et al., 1996; Killcross et al., 1997), and cells there encode the associative significance of stimuli (Fuster and Uyeda, 1971; Sanghera et al., 1979; Nishijo et al., 1988;Muramoto et al., 1993; Quirk et al., 1995; Schoenbaum et al., 1999). Interconnections between OFC and ABL (Krettek and Price, 1977;Kolb, 1984; Price et al., 1987; McDonald, 1991) appear to be critical for encoding and using associative information about the motivational significance of stimuli (Baxter et al., 2000).
By recording from each of these regions in the same behavioral task, the analyses presented here and in two earlier studies (Schoenbaum et al., 1998, 1999) help to define the different contributions of these structures in learning and the organization of behavior. The current results, like our earlier findings, indicate that associative encoding occurs first in ABL and emerges subsequently in OFC when accurate performance is established. The close correspondence between experience-dependent plasticity in OFC and the development of accurate responding in the go, no-go task supports the role of this structure in discrimination performance in a number species and paradigms (Jones and Mishkin, 1972; Eichenbaum et al., 1983; Rolls et al., 1994; Diaz et al., 1996; DeCoteau et al., 1997). This prefrontal structure, like others, represents information when it is relevant to the behavior at hand (Schoenbaum and Eichenbaum, 1995b; Miller et al., 1996;Rainer et al., 1998; Tremblay and Schultz, 1999). In contrast, encoding in ABL appears to be more generally related to the significance of the cues and is not tightly coupled to the go, no-go decision in the discrimination task. These findings are consistent with behavioral studies that show initial learning in many discrimination paradigms to be unaffected by amygdala lesions (Jones and Mishkin, 1972;Slotnick, 1985; Eichenbaum et al., 1986). Nevertheless, changes in response latencies that parallel experience-dependent plasticity in ABL suggest that some aspects of behavior in the task may depend on these networks. Thus, these structures may cooperate in guiding behavior within a domain based on motivational and incentive information (Schoenbaum et al., 1999) in much the same way that other prefrontal networks have been proposed to function in cooperation with specialized systems in other informational domains (Goldman-Rakic, 1987; Wilson et al., 1993; Miller et al., 1996).
Changes in functional connectivity persist more strongly in OFC networks after reversal
Notable differences were evident in comparing the analysis of correlated activity during the reversal phase with the characteristics of individual neurons responsive to odor cues (Schoenbaum et al., 1999). The majority of neurons in OFC that developed encoding during odor sampling over the course of initial learning stopped firing selectively to the odor cues when contingencies were altered during reversal training. At the same time, a population of previously nonselective OFC neurons began to fire selectively to the odor cues after reversal. This pattern is consistent with the notion that encoding in OFC is strongly influenced by conjunctions between specific stimuli and their associated motivational significance. In contrast, the majority of neurons with odor-selective encoding in ABL reversed their firing selectivity when the reinforcement contingencies of the odors were reversed. Such neurons appear to encode motivational significance independent of the specific stimulus properties of the odor cues. Within that framework, the further increase in correlated activity in OFC, but not in ABL, during reversal training is of interest. Indeed, if encoding of contingencies in ABL involved many of the same connections engaged in the original associative encoding, no further increase in correlated activity would be expected. Encoding of new conjunctions between events in OFC after reversal of contingencies, on the other hand, might produce further increases in correlated activity, particularly if new connections were recruited, as was the case for the individual neurons during odor sampling in OFC (Schoenbaum et al., 1999). An overall increase in functional connectivity in OFC during reversal training suggests that encoding of the original conjunctions, although no longer expressed in response to the odors, nonetheless must be maintained within the network during this time period.
Persistence of encoding in OFC, indicated by the cumulative increase in correlated activity after reversal, is particularly noteworthy given past reports concerning the effects of lesions in OFC during reversal training (Jones and Mishkin, 1972; Eichenbaum et al., 1983; Rolls et al., 1994; Diaz et al., 1996; Meunier et al., 1997). Although OFC-lesioned subjects are able to learn the original discrimination, they are unable to shift their behavior to reflect new information regarding the cues. OFC lesions in particular appear to promote perseverative errors in which the subject is unable to withhold prepotent responses based on the original associations (Jones and Mishkin, 1972; Eichenbaum et al., 1983). These behavioral findings suggest that the role of OFC in discrimination tasks is not limited to encoding the associations between cues and reinforcers but rather is critical for guiding the selection of the appropriate behavioral responses in the context of changing task contingencies and context, provided by both internal and external signals. Neurophysiological findings support this hypothesis (Schoenbaum and Eichenbaum, 1995b;Critchley and Rolls, 1996; Schoenbaum et al., 1999, Tremblay and Schultz, 1999). Persistent encoding of the original associations in networks in OFC after reversal would facilitate the comparison of new information and old, permitting the processing and output to be adaptively biased by current context. In the absence of this contribution from OFC, the original encoding is more difficult to alter and exerts a stronger control over behavior. In other words, behavior becomes more rigid and less amenable to control by changing contingencies and more subtle contextual features of the environment. It is also interesting to note that the increased correlated activity appears not to persist across sessions. The decline between sessions may reflect the limited value of these representations in a task in which rats were accustomed to encountering new odor problems each day.
In summary, our observation of altered functional connectivity over the course of learning lends support to the emerging concept that analysis of interactions between simultaneously recorded neurons can reveal changes that occur as a function of experience and episodes of learning (Wilson and McNaughton, 1993; Quirk et al., 1995; Skaggs and McNaughton, 1996; Kubota et al., 1999). Use of these methods in concert with a traditional analysis of the firing characteristics of the individual neurons to cues in the task may provide additional information about the performance of neural networks.
Footnotes
This work was supported by National Institutes of Health Grants RO1 MH53667 and KO5-MH01149 to M.G. and K08-AG00882 to G.S.
Correspondence should be addressed to Dr. Geoffrey Schoenbaum, Department of Psychology, Johns Hopkins University, 3400 North Charles Street, Room 25, Ames Hall, Baltimore, MD 21218. E-mail:schoenbg{at}jhu.edu.


