

Abstract
Intracellular Ca2+ mobilization and release into mammal CSF plays a fundamental role in the etiogenesis of fever induced by the proinflammatory cytokine interleukin-1β (IL-1β) and other pyrogens. The source and mechanism of IL-1β-induced intracellular Ca2+ mobilization was investigated using two experimental models. IL-1β (10 ng/ml) treatment of rat striatal slices preloaded with 45Ca2+elicited a delayed (30 min) and sustained increase (125–150%) in spontaneous 45Ca2+ release that was potentiated by l-arginine (300 μm) and counteracted by N-ω-nitro-l-arginine methyl ester (l-NAME) (1 and 3 mm). The nitric oxide (NO) donors diethylamine/NO complex (sodium salt) (0.3 and 1 mm) and spermine/NO (0.1 and 0.3 mm) mimicked the effect of IL-1β on Ca2+ release. IL-1β stimulated tissue cGMP concentration, and dibutyryl cGMP enhanced Ca2+ release. The guanyl cyclase inhibitors 1H-[1,2,4]oxadiazole[4,3-a] quinoxalin-1-one (100 μm) and 6-[phenylamino]-5,8 quinolinedione (50 μm) counteracted Ca2+ release induced by 2.5 but not 10 ng/ml IL-1β. Ruthenium red (50 μm) and, to a lesser extent, heparin (3 mg/ml) antagonized IL-1β-induced Ca2+ release, and both compounds administered together completely abolished this response. Similar results were obtained in human astrocytoma cells in which IL-1β elicited a delayed (30 min) increase in intracellular Ca2+concentration ([Ca2+]i) (402 ± 71.2% of baseline), which was abolished by 1 mml-NAME. These data indicate that the NO/cGMP-signaling pathway is part of the intracellular mechanism transducing IL-1β-evoked Ca2+ mobilization in glial and striatal cells and that the ryanodine and the inositol-(1,4,5)-trisphosphate-sensitive Ca2+stores are involved.
- interleukin-1β
- nitric oxide
- Ca2+release
- human astrocytoma cells
- rat striatum
- cGMP
- Ca2+ stores
- fever
- neurotoxicity
Our previous work on the mechanisms underlying the fever process showed that administration of interleukin-1β (IL-1β) and other pyrogens into the lateral ventricle of rabbits was always accompanied by an increase in [Ca2+] in the CSF. The antipyretic acetylsalicylic acid counteracted this effect and the increase in body temperature evoked by IL-1β (Palmi et al., 1992). The changes in brain [Ca2+] were later shown to be strictly correlated with the temperature gain and with the increase in prostaglandin E2 in CSF of these animals, whereas the antipyretic–anti-inflammatory agent dexamethasone antagonized both the fever and the increase in CSF [Ca2+] induced by IL-1β (Palmi et al., 1994). The pyrogenic effect of IL-1β was also antagonized by lipocortin 5-(204–212) peptide, a member of the annexin family that possesses the anti-inflammatory effects of glucocorticoids (Palmi et al., 1995) as well as by ventricular-cisternal perfusion with EGTA-enriched artificial CSF (Palmi et al., 1994).
Together, these findings corroborated the involvement of Ca2+ in thermoregulation (Myers and Veale, 1970; Palmi and Sgaragli, 1989), establishing the role of this ion in the intracellular signaling pathways that control the pyrogenic response to IL-1β. Additional in vitro studies showed increased Ca2+ efflux from rat striatum treated with IL-1β and antagonism of this effect by a specific IL-1 receptor antagonist protein. This explained the mechanism responsible for the increased Ca2+observed in CSF in vivo and also provided evidence that a specific receptor mediates Ca2+ response (Palmi et al., 1996).
The lag phase of the Ca2+ response to IL-1β and the kinetic pattern of Ca2+release in these experiments were reminiscent of those of nitric oxide (NO) production by IL-1β in neurons (Bredt et al., 1991) and other cells (Inoue et al., 1993), suggesting that NO could be the intermediate messenger responsible for this effect. Additional support for this hypothesis is provided by reports showing that NO is involved in functions and molecular mechanisms controlling Ca2+ homeostasis in many different cell systems (for review, see Clementi, 1998) and by the observation of increased synthesis–release of nitrite and nitrate, the breakdown products of NO in patients with fever (Leaf et al., 1990) or septic shock (Ochoa et al., 1991). Another relevant finding is that dexamethasone inhibits the induction of nitric oxide synthase (NOS) (Palmer et al., 1992) and antagonizes both the fever and the increase in CSF [Ca2+] induced by IL-1β (Palmi et al., 1992).
The aim of the present study was to investigate the involvement of NO in IL-1β-induced Ca2+release and the source of this increased Ca2+ release. Our data showed that IL-1β, via NO production, possesses a modulatory role on cytosolic Ca2+ concentrations. Because IL-1 plays a fundamental role in diverse neurological and vascular disorders, a modulation of cytosolic Ca2+ concentrations by NO may be part of the intracellular signaling cascade responsible for multiple functions of this cytokine in mammals.
MATERIALS AND METHODS
Chemicals. Stock solutions of human recombinant IL-1β (specific activity, 1.0 × 10⁹ U/mg protein), which was kindly donated by Chiron Vaccines S.p.A. (Siena, Italy) were prepared by dissolving the compound in double-distilled pyrogen-free water. The solutions were divided into aliquots and stored under nitrogen. Each solution was thawed and diluted before use. Lipopolysaccharide contamination of IL-1β was <1.2 pg/μg as measured by the limulus amebocyte lysate chromogenic assay.45Ca2+(6.02 × 10⁻⁶m) (specific activity, 532 mCi/mmol) was obtained from DuPont NEN (Cologno Monzese, Milano, Italy). Fura-2 AM in anhydrous dimethylsulfoxide (DMSO) from Calbiochem (Milano, Italy) was stored in aliquots at −80°C and thawed before use. 1H-[1,2,4] oxadiazole [4,3-a] quinoxalin-1-one (ODQ) from Tocris Cookson (Bristol, UK) and 6[phenylamino]-5,8 quinoline dione (LY-83,583) from Alexis Corporation (Laufelfingen, Switzerland) were dissolved in 3% DMSO. 2-(N,N-Diethylamino)-diazenolate-2-oxide [sodium salt (Dea/NO)] and [(z)-1–123N-[3-aminopropyl]-N-[4-(3-aminopropylammonio)butyl]-amino 125-diazen-1-ium-1,2-diodate] (Sper/NO) were from Alexis Biochemicals (Vinci, Italy). 4-Bromocalcimycin (4Br-A23187) and digitonin from Merck (Darmstadt, Germany) were dissolved in DMSO. Pluronic acid F-127 was from Molecular Probes (Eugene, OR). DMEM and fetal calf serum were from Seromed (Biochrom KG, Berlin, Germany). Human astrocytoma U-373 MG cells were obtained courtesy of Prof. Chieco Bianchi (Institute of Oncology, Padua University, Padua, Italy). Low molecular weight heparin (∼3000 Da) and all other chemicals were from Sigma (St. Louis, MO).
Solutions. Physiological salt solution (PSS) contained (in mm): 160 NaCl, 10 glucose, 5 HEPES, 4.6 KCl, and 1 MgCl2, pH 7.2. Ca-EGTA PSS contained (in mm): 135 NaCl, 10d-glucose, 5 HEPES, 4.6 KCl, and 1 MgCl2, pH 7.2, calibrated (Maxchelator; Dr. C. Patton, Stanford University, Stanford, CA) with CaCl2 and EGTA to give a final free [Ca2+] of 0.5 × 1.0−3 or 6.2 × 10⁻⁷m (a nominally Ca2+-free solution), depending on the experiment. To accurately measure cellular Ca2+ efflux, Ca-EGTA was used in the perfusion solution to chelate the radioactive isotope released. This, while maintaining constant the concentration of free extracellular Ca2+, minimizes the amount of45Ca2+ that remains bound in the extracellular space, thus reducing the potential for its backflux into the cell (Breemen and Casteels, 1974). HEPES-buffered saline (HBS) contained (in mm): 145 NaCl, 1 MgCl2, 5 KCl, 10 HEPES, 10 glucose, and 1 CaCl2, pH 7.4.
Tissue preparation. Tissue preparation followed the method described previously (Palmi et al., 1996). Briefly, male albino Sprague Dawley rats weighing 300 ± 50 gm were killed by decapitation and rapidly decerebrated. The striatum was excised, placed in oxygenated (95% O2–5% CO2) PSS, cut into 350 μm slices, washed in ice-cold PSS at a low (0.2 mm) [Ca2+], and incubated at 37°C under 95% O2–5% CO2 bubbling in the same solution supplemented with 4 μCi of45Ca2+.
The optimum loading time for the labeled Ca2+ was determined by calculating the45Ca2+ ratio between tissue and incubation medium (T/M ratio) at different times (0, 10, 20, 30, 40, 50,60,120, and 180 min) after the addition of45Ca2+. Maximum loading occurred at 25–30 min when the mean T/M ratio was 14.7 ± 2.3 (n = 20, range of 11.8–15.6). After the 30 min point, the T/M ratio either remained constant or slightly decreased; therefore, all Ca2+ release experiments were started after loading time of 30 min.
Batches of three to five slices were placed in microperfusion chambers and superfused throughout the experimental session with oxygenated Ca-EGTA-buffered PSS at 37°C at a constant rate of 0.5 ml/min. After the release had stabilized at 25 min (preperfusion) (see scheme below), the perfusion fluid was continuously collected in 1.5 ml (3 min) samples for 100 min. At the end of the experiment, the radioactivity present in each fraction and that remained in tissues were determined.
Scheme of the experimental protocol.

Release was expressed as the percentage of residual radioactivity present in the tissue at each sampling interval [fractional release (FR)] using the following equation:
 where Xi
is the radioactivity released at the i fraction, with i = 1, 2, 3… n, and Tcont is the residual radioactivity remaining in the tissue at the end of the experimental period (Palmi et al., 1996).
where Xi
is the radioactivity released at the i fraction, with i = 1, 2, 3… n, and Tcont is the residual radioactivity remaining in the tissue at the end of the experimental period (Palmi et al., 1996).
Baseline spontaneous FR were taken as the FR values of 10 fractions collected during the 30 min of the period preceding drug administration (the “predrug” perfusion period). Their mean ± SEM values provided a benchmark for the effects of different substances on Ca2+ efflux. The possible influence ofl-arginine,N-ω-nitro-l-arginine methyl ester (l-NAME), ODQ, LY-83,583, ruthenium red (RR), and heparin on Ca2+ efflux was assessed in parallel experiments in which each compound was perfused separately.
Intracellular Ca2+stores. To investigate on intracellular stores involved in IL-1β-induced Ca2+ release, we tested the effect of RR, a specific inhibitor of the ryanodine (RY)-sensitive receptors and heparin, which inhibits the inositol-(1,4,5)-trisphosphate (IP3)-sensitive receptors, as well as the mitochondrial uniport for calcium. Tissues pretreated with saponin (1.5 mg/ml) during the 30 min of the “45Ca2+loading period” were then perfused with a Ca2+-free solution in the presence of RR (50 μm), heparin (3 mg/ml), or RR plus heparin.
Nitric oxide assay. To estimate the amount of NO released by the NO donors, concentrations of nitrite and nitrate after enzymatic reduction, the end-products of NO, were measured by the Griess reaction by using a commercial colorimetric assay kit (detection limit, 2.0 μm; Cayman Chemical, Ann Arbor, MI). Amounts of NO released were determined in the absence of tissue under the same experimental conditions. After addition of NO donors to 0.2 mm Ca-EGTA buffer, pH 7.4 (37°C), to initiate the reaction, samples of 1.5 ml were collected through the perfusion apparatus at 3 min intervals. The samples were collected in tubes containing 0.1 N NaOH to stop the reaction, and the samples were immediately frozen and analyzed at the end of the experiment. Indicated amounts of solution (see the instructions of the manufacturer) were then run in duplicate wells, and the mean values were used.
cGMP assay. A commercial cGMP enzyme immunoassay (EIA) kit using mouse monoclonal anti-rabbit antibody (Cayman Chemical) was used to measure the tissue cGMP concentrations. After perfusing with IL-1β (10 ng/ml) or Dea/NO (1 mm) for different times (0, 15, 30, 45, and 75 min), the tissues were immediately frozen in liquid nitrogen until use for assay.
Following the instructions of the manufacturer, the frozen tissues were immediately put in concentrated trichloroacetic acid, homogenized, and briefly centrifuged. Indicated amounts of supernatants submitted previously to the acetylation procedure (see the instructions of the manufacturer) to increase the assay sensitivity (<1 pmol/ml) were then run in duplicate wells for EIA, and the mean values were used.
Cell isolation and culture. Cells of the human astrocytoma U-373 MG cells were cultured in DMEM supplemented with 10% fetal calf serum, 100 U/ml penicillin, 100 μg/ml streptomycin, and 2 mml-glutamine. Cell number was determined by light-microscope count, and viability was assayed by the trypan blue dye exclusion technique.
Cell suspension (3 ml) containing 2.5 × 10⁵ viable cells per milliliter was placed in 35 mm Petri dishes containing two 12-mm-diameter circular glass coverslips and incubated at 37°C for 24 hr in 95% air–5% CO2 until confluence. After this period, the glasses carrying adhering cells were removed from the Petri dishes and washed twice with HBS containing 0.03% pluronic acid F-127 before the Ca2+ measurements were performed.
Measurement and calculation of [Ca2+]i. The astrocytes on the glass coverslips were incubated for 75 min at 25°C in the dark with 10 μm fura-2 AM in DMSO. They were then washed three times with HBS. In experiments with IL-1β, the cytokine, at a final concentration of 10 ng/ml, was added to the fura-2 AM solution 0, 30, 45, and 60 min after the beginning of the incubation. Each coverslip was placed in the fluorimeter cuvette containing 2 ml of HBS at 30°C. Fluorescence was recorded at excitation and emission wavelengths of 340 and 505 nm, respectively, by using a single excitation fluorimetry (RF-5000; Shimadzu, Tokyo, Japan). Immediately afterward, each sample was calibrated to evaluate [Ca2+]i.
Fura-2 leakage was estimated by adding 0.2 mmMnCl2 and 0.5 mmN,N-bis[2-(bis[carboxymethyl]amino)ethyl]glycine pentetic acid calcium salt. To obtain maximum fluorescence (Fmax), 10 mmCaCl2, 2.3 μm 4Br-A23187, and 100 μm digitonin were added sequentially, followed by 20 mm MnCl2 to record the autofluorescence of the system. Intracellular Ca2+ values were obtained from the observed fluorescence (F) as described by Tsien et al. (1982), after correction of F,Fmax, andFmin for autofluorescence (i.e., fluorescence variations of astrocytes not loaded with fura-2).
Statistical analysis. Unless otherwise indicated, means ± SEM of triplicate determinations were obtained in three to five separate experiments, and the data were compared statistically by one-way ANOVA followed by Barlett's test. Group data of fractional45Ca2+release were compared across all treatments: IL-1β (10 ng/ml) alone; IL-1β (10 ng/ml) plus l-arginine; IL-1β(10 ng/ml) plus l-NAME (1 and 3 mm); IL-1β (2.5 and 10 ng/ml) plus ODQ; IL-1β (2.5 and 10 ng/ml) plus LY-83,583; Sper/NO (0.1, 0.3, and 1 mm); Dea/NO (0.3 and 1 mm); dibutyryl cGMP (di-cGMP) (30 and 100 μm); RR plus IL-1β (10 ng/ml); heparin plus IL-1β (10 ng/ml); and RR plus heparin plus IL-1β (10 ng/ml). For all experiments, p< 0.05 was considered significant.
RESULTS
Effects of IL-β, IL-β plus l-arginine, Sper/NO, and Dea/NO on Ca2+ release
Baseline spontaneous FR of45Ca2+ from slices of rat striatum in the absence of stimulation was constant over the entire sampling period (Fig. 1,inset) corresponding to FR = 6.52 ± 0.51. Addition of IL-1β (10 ng/ml) to the perfusion liquid for 33 min induced a slow and delayed increase in the rate of spontaneous Ca2+ efflux that started ∼30 min after cytokine addition and continued to increase after interleukin washout (Fig. 1). At the end of the experiment, the rate of Ca2+ release was 125 ± 18% above the basal value (FR = 6.14 ± 0.31).l-Arginine (300 μm) alone did not significantly modify spontaneous Ca2+ efflux (110.6 ± 5.2% of basal release; n = 4) (data not shown), but when perfused with IL-1β, it potentiated the effect of the cytokine on Ca2+ efflux, as indicated by the increased rate (40.9 ± 12.4% above IL-1β alone) and the faster onset (15 min after IL-1β addition) of the effect.
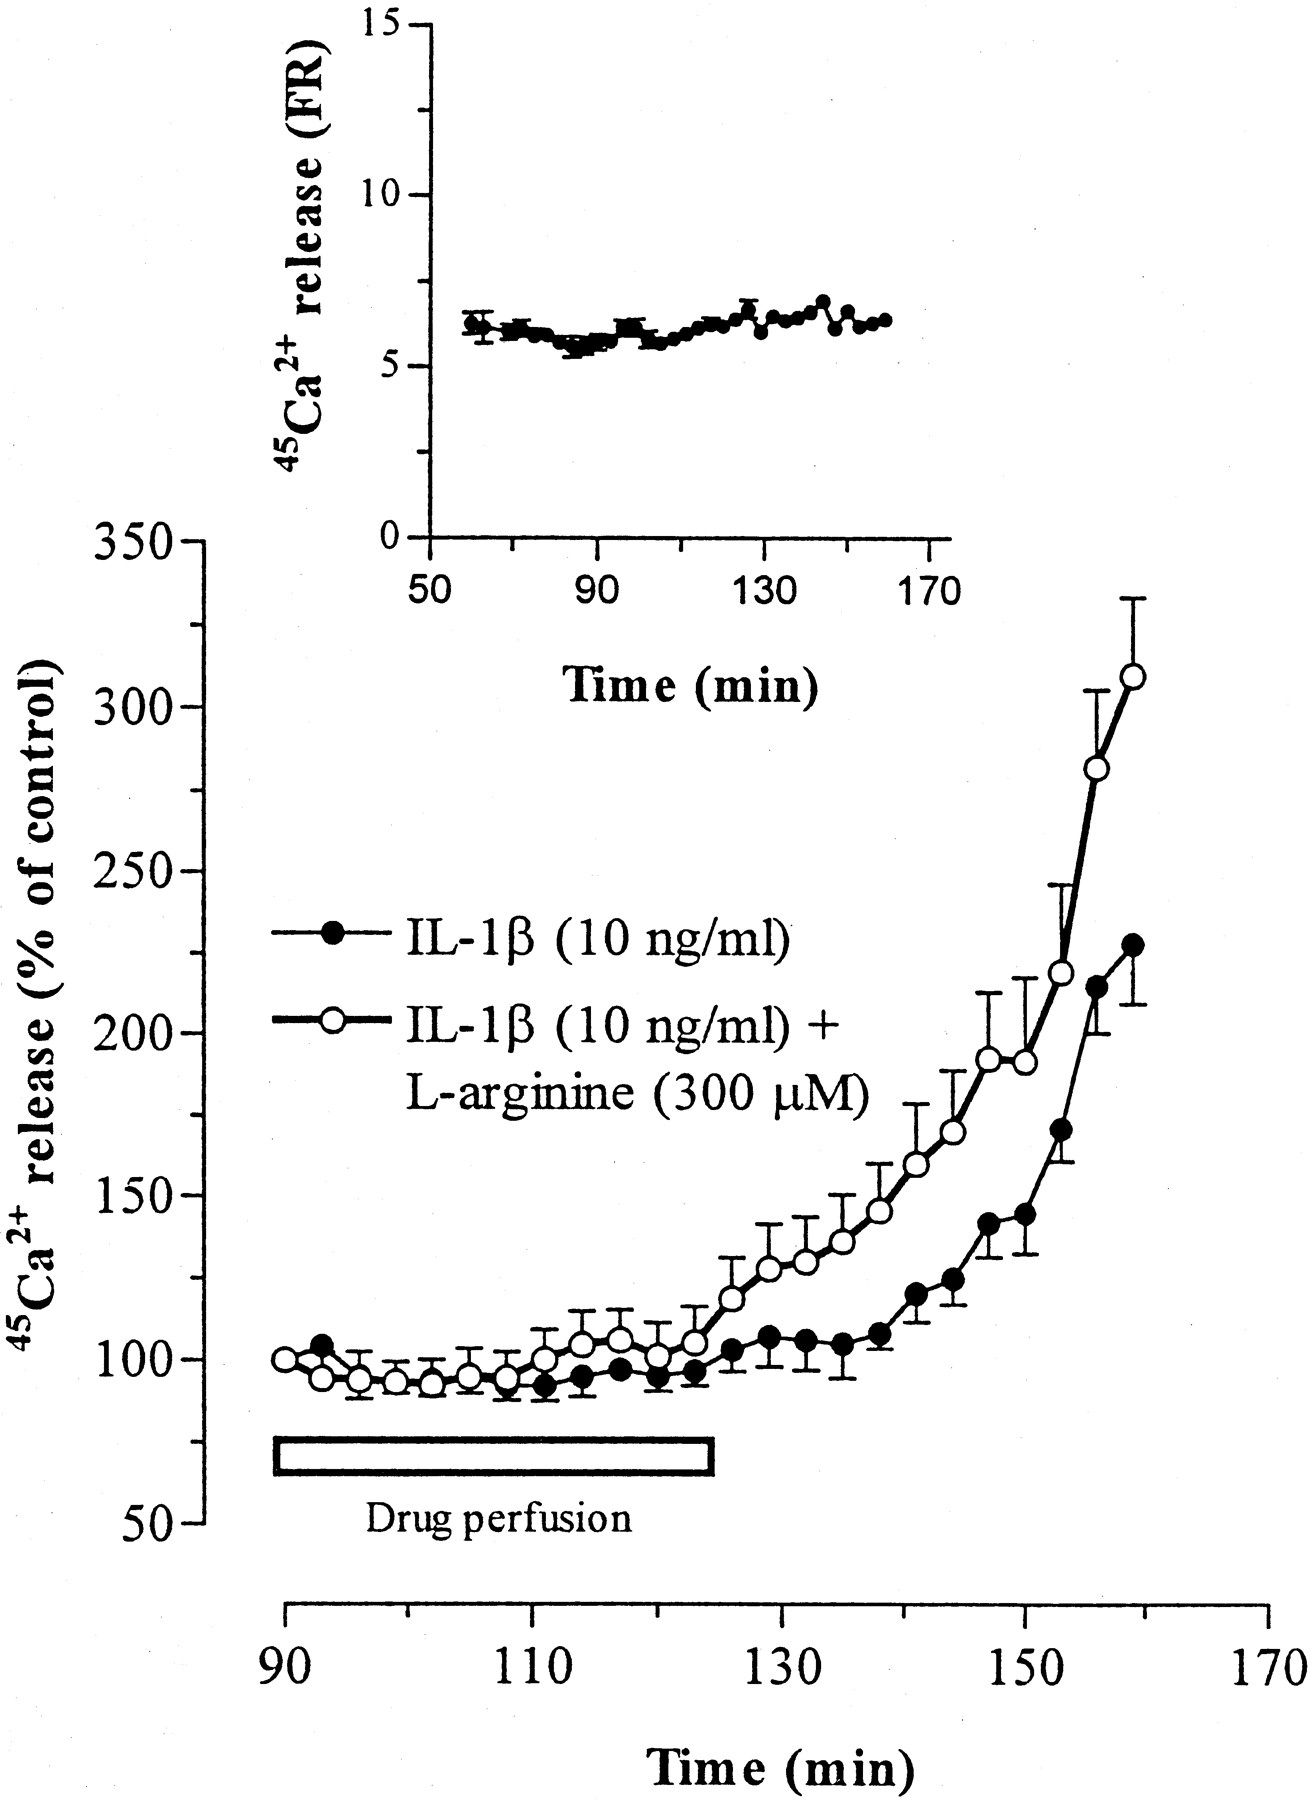
Effect of perfusion of IL-1β alone and in combination with l-arginine on release of45Ca2+ from rat striatal brain slices. Release is expressed as a percentage of the residual radioactivity present in the tissue at each sampling interval (FR; see Materials and Methods). Values, which represent percentage deviations in 45Ca2+ efflux above baseline release, are the means ± SEM of triplicate determination from three to five separate experiments. Baseline release (100%) is the mean release in 10 fractions collected in the 60–90 min interval preceding drug perfusion (predrug perfusion; see scheme in Materials and Methods). The inset shows spontaneous45Ca2+ efflux in the 60–160 min sample collection period (see scheme in Materials and Methods). Group data of IL-1β and IL-1β plus l-arginine were compared by ANOVA; FR of p < 0.01 for IL-1β versus IL-1β plusl-arginine.
When the effect of exogenous NO, supplied by the NO donors, was investigated, it was found that, similar to IL-1β, both Dea/NO (at 0.3 and 1 mm) and Sper/NO (at 0.1 and 0.3 mm) induced a concentration-related increase in the rate of Ca2+ release (Fig.2). However, when the highest Sper/NO concentration (1 mm) was tested, we observed inhibition of Ca2+ mobilization (Fig.2A). Furthermore, Dea/NO induced a prolonged and progressive elevation of Ca2+ release, similar to that induced by IL-1β, whereas Sper/NO promoted a transient elevation of Ca2+ release. Consistent with differences in kinetic profiles of Ca2+ mobilization, we observed differences in the NO release of the two NONOate-type NO donors. As shown in Figure3 in which the decomposition profiles of these compounds are shown, a much greater fraction of NO is released by Dea/NO than by Sper/NO during the first 6 min, whereas the opposite occurs later. Concentration peaks of NO for corresponding doses were also higher for Dea/NO than for Sper/NO.
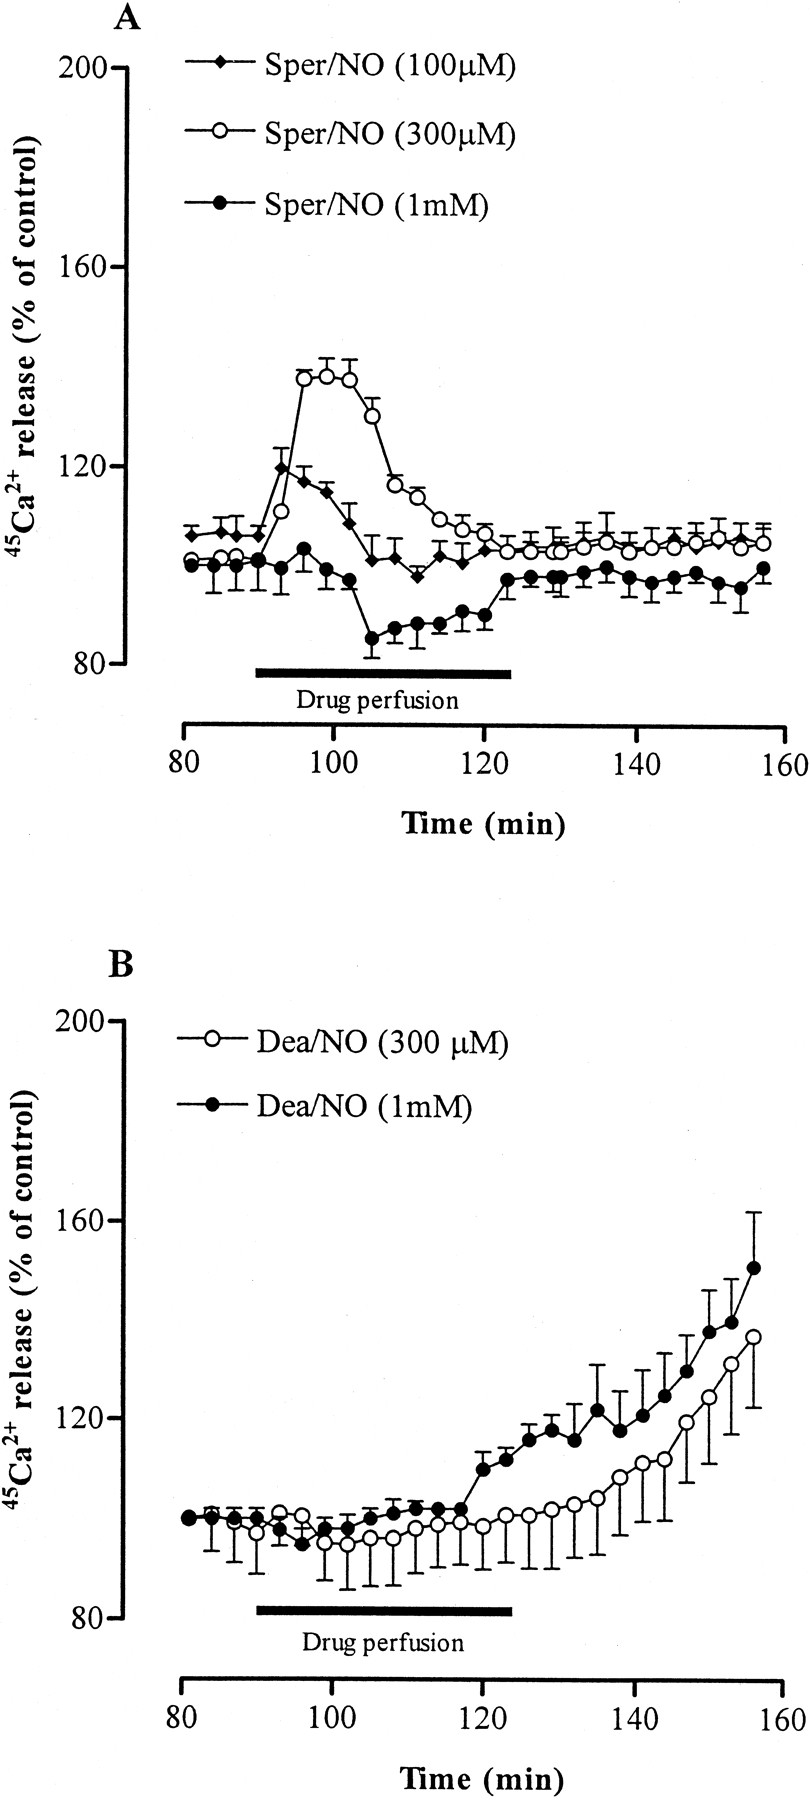
Effect of Sper/NO (A) and Dea/NO (B) on release of45Ca2+ from rat striatal brain slices. For details, see legend to Figure 1. Group data of45Ca2+ release were compared statistically by ANOVA for the following treatments: Sper/NO (100 μm) versus Sper/NO (300 μm), FR ofp < 0.05; Sper/NO (300 μm) versus Sper/NO (1 mm), FR of p < 0.01; Sper/NO (100 μm) versus Sper/NO (300 μm) versus Sper/NO (1 mm), FR of p < 0.01; Dea/NO (300 μm) versus Dea/NO (1 mm), FR of p < 0.05.

Concentration–time profiles of NO release from different NO donors at pH 7.4 and 37°C. NO released from Dea/NO (300 μm and 1 mm) and Sper/NO (100 μm, 300 μm, and 1 mm) was measured in the absence of tissues by the nitrite/nitrate colorimetric assay method. Values (mean ± SEM of duplicate determinations from 3 separate experiments) represent average nitrite/nitrate concentrations released within each 3 min perfusion interval (see Materials and Methods).
Effects of l-NAME on IL-1β-induced Ca2+ release
l-NAME, a well known inhibitor of NOS given alone, weakly inhibited Ca2+ release by 18 ± 5% (p < 0.05) of baseline (data not shown). However, when administered with IL-1β, it antagonized the effect of the cytokine at a concentration of 1 mm and completely reversed Ca2+ release at 3 mm (Fig. 4). The enantiomer d-NAME (3 mm), which is not an inhibitor of NOS, did not antagonize the effect of IL-1β on Ca2+ release (data not shown).

Effect of different concentrations ofl-NAME on IL-1β-induced release of45Ca2+ from rat striatal brain slices. For details, see legend to Figure 1. Group data of45Ca2+ release were compared statistically by ANOVA for the following treatments: IL-1β versus IL-1β plus l-NAME (1 mm), FR ofp < 0.05; IL-1β versus IL-1β plusl-NAME (3 mm), FR of p < 0.01; IL-1β versus IL-1β plus l-NAME (1 mm) versus IL-1β plus l-NAME (3 mm), FR ofp < 0.01.
Effect of IL-1β and Dea/NO on tissue cGMP concentrations and effect of di-cGMP on Ca2+ release
Many of the actions of NO in different tissues are elicited through activation of soluble guanylate cyclase, with the resultant production of cGMP. To check whether cGMP was involved in NO-mediated Ca2+ release, the tissue concentrations of cGMP were determined after either IL-1β or Dea/NO treatments. The effects of the membrane-permeable analog of cGMP, di-cGMP, on the rate of Ca2+ release from the tissue was also studied. As shown in Figure 5, both IL-1β and Dea/NO increased cGMP concentrations by two to three times over the basal tissue concentration. These effects were transient with peaks at 15 and 30 min for IL-1β and Dea/NO, respectively. di-cGMP behaved similarly to IL-1β, inducing a progressive and sustained increase of Ca2+ release that was delayed and dose-dependent (Fig.6).

Effect of IL-1β and Dea/NO on cGMP levels in rat striatal brain slices. Values (means ± SEM of duplicate determinations from 3 to 5 separate experiments) represent the tissue cGMP concentration at various perfusion intervals. Each value was compared statistically with control (0 perfusion time in figure) by Student's t test followed by Welch's ttest. *p < 0.05; **p < 0.01.

Effect of different concentrations of di-cGMP on release of 45Ca2+ from rat brain slices. For details, see legend to Figure 1. Group data of 30 μmdi-cGMP and 100 μm di-cGMP were compared statistically by ANOVA; 30 μm di-cGMP versus 100 μm di-cGMP, FR of p < 0.001.
Effects of ODQ and LY-83,583 on IL-1β-induced Ca2+ release
If cGMP mediates the effect of NO on Ca2+ efflux, then inhibitors of guanylate cyclase would be expected to antagonize the effect of IL-1β. Two inhibitors of cGMP synthesis, namely ODQ (Garthwaite et al., 1995) and LY-83,583 (Mülsch et al., 1988), were perfused in combination with two different (2.5 and 10 ng/ml) concentrations of IL-1β. As shown in Figure 7, with the higher IL-1β concentration, neither compounds counteracted the effect of IL-1β on Ca2+ release, whereas with the lower cytokine dose, we observed inhibition of the response. The baseline Ca2+ release was unaffected by treatment with ODQ and LY-83,583 (97.8 ± 9.5 and 97.6 ± 13.2% of basal release, respectively).

Effect of LY-83,583 (A) and ODQ (B) on release of45Ca2+ induced by different (2.5 and 10 ng/ml) concentrations of IL-1β in rat striatal brain slices. For details, see legend to Figure 1. Group data of IL-1β versus IL-1β plus LY-83,583 and IL-1β versus IL-1β plus ODQ for each IL-1β concentration were compared statistically by ANOVA. IL-1β (2.5 ng/ml) versus IL-1β plus LY-83,583, FR of p < 0.05; IL-1β (2.5 ng/ml) versus IL-1β plus ODQ, FR ofp < 0.05; and IL-1β (10 ng/ml) versus IL-1β plus LY-83,583 and IL-1β (10 ng/ml) versus IL-1β plus ODQ showed no statistically significant differences.
Effects of RR and heparin on IL-1β-induced Ca2+ release
Cells have two principal intracellular calcium channels responsible for mobilizing stored calcium and IP3- and RY-sensitive receptors. In many cells, including neurons, these occupy specialized compartments of the endoplasmic reticulum (ER). To determine whether they were involved in Ca2+ response, we investigated the effect of inhibitors of the IP3- and RY-sensitive receptors, heparin and RR, respectively, on IL-1β-induced Ca2+ release. As shown in Figure8, treatment with heparin (3 mg/ml) did not antagonize Ca2+ release with respect to controls, whereas treatment with RR (50 μm) did antagonize the release, reducing the response observed over the 148–160 min interval by 70%. The combined administration of 50 μm RR and 3 mg/ml heparin completely abolished elevation of Ca2+ release induced by IL-1β.

Effect of heparin and RR on IL-1β-induced45Ca2+ release. Permeabilized striatal slices were perfused with a Ca2+-free medium in the presence of heparin or RR or heparin plus RR. For details, see legend to Figure 1. Group data of 45Ca2+ FR were compared statistically by ANOVA for the following treatments: IL-1β plus heparin versus IL-1β, FR was NS; RR plus IL-1β versus IL-1β, FR of p < 0.001; heparin plus RR plus IL-1β versus IL-1β, FR of p < 0.001.
Effects of IL-1β alone and in combination with l-NAME on [Ca2+]i in astroglial cells
Because production of NO in response to IL-1β stimulation has been demonstrated in human and rodent astrocytes (Lee et al., 1993), human astrocytoma U-373 MG cells were used as an additional model to investigate the involvement of NO in IL-1β-induced Ca2+ release. The relationships between duration of IL-1β stimuli and [Ca2+]i changes are shown in Figure 9. Astrocytes responded to the cytokine with an increase in [Ca2+]i. This response was negligible after 15 min of stimulation with IL-1β but reached a maximum after 30 min, returning to basal after 75 min of stimulation. This effect was completely abolished by coadministration of 1 mml-NAME with IL-1β.

Effect of IL-1β alone or in combination withl-NAME on [Ca2+]ivariations in human astrocytoma U-373 MG cells determined by fura-2 analysis. Values represent the mean ± SEM value from 15 independent determinations. Student's t test for statistical analysis was applied at each single time point for significance between IL-1β and IL-1β plus L-NAME treatments. **p < 0.01.
DISCUSSION
The results obtained in this work, using different techniques and models, show that NO mediates the Ca2+response elicited by IL-1β. Thus, in rat striatum, in which a population of NOS-containing neurons has been demonstrated (Vincent and Johansson, 1983; Strijbos et al., 1996), an increase of substrate (l-arginine) availability for NOS potentiated the effect of IL-1β on Ca2+ release, whereas the competitive NOS inhibitor l-NAME antagonized this effect. Furthermore, two different nucleophile (amine)/NO complexes (Dea/NO and Sper/NO), which decompose with generation of NO at physiological pH values (Maragos et al., 1991; Diodati et al., 1993), both caused Ca2+ efflux in the absence of added IL-1β.
The kinetic profiles of NO release from these two NO donors showed that, soon after administration, Dea/NO released a much greater fraction of its bound NO than Sper/NO, which gave a slower and delayed release.
These differences in the NO kinetic profiles resulted in differences in their relative effects on tissues. However, as shown in Figure 2, soon after administration, 300 μm Sper/NO induced a rapid release of Ca2+, whereas an equivalent concentration of Dea/NO gave rise to delayed (15–20 min) responses. This apparent discrepancy might be reconciled by assuming that NO concentrations are crucial in determining the response. Thus, whereas a moderate amount stimulates, excessive NO might inhibit Ca2+ release. In line with our results, at early post-administration times, when the NO released by Sper/NO is low, Ca2+ release was stimulated. A process of this type is also consistent with the inhibition of Ca2+ release by high (1 mm) concentrations of Sper/NO at which the higher concentrations of NO generated is inhibitory. In contrast to Sper/NO, Dea/NO released a much greater fraction of NO soon after administration. The lag phase in Ca2+ response observed before stimulation was apparent may reflect the progressive decrease of NO from concentrations that were initially inhibitory. The effects of NO have been reported to differ in different cell systems. Thus, it inhibits Ca2+ release in smooth muscle cells (Felbel et al., 1988), platelets (Nguyen et al., 1991), and neurosecretory PC12 cells (Clementi et al., 1995), but it enhances Ca2+ efflux in hepatocytes (Rooney et al., 1996) and sea urchin oocytes (for review, see Clementi, 1998). Similarly, NO appears to promote or inhibit a range of physiopathological processes, including inflammation, angiogenesis, and cancer. It is possible that these contrasting actions of NO might, at least in part, be attributed to concentration-dependent effects, such as those discussed above. Such behavior is known in blood vessels and neurons, in which low NO concentrations transduce signals (Lowenstein et al., 1994) but high concentrations can damage cells (Dugas et al., 1995).
The increased cytosolic Ca2+ concentration after IL-1β-induced NO production may, in turn, activate constitutive NOS and hence increase de novo NO synthesis, which might lead to a positive feedback loop resulting in tissue damage. This might be relevant in ischemia-induced brain injury in which an upregulation of both neuronal-type NOS and Ca2+concentrations, via activation of NMDA receptors, occur in focal ischemic areas (Garthwaite et al., 1988; Patneau and Mayer, 1990;Dawson et al., 1993; Burgard and Hablitz, 1995; Iadecola, 1997).
Astroglial cells have been reported to express a constitutively expressed isoform of NOS (Aoki et al., 1991; Lee et al., 1993) and high concentrations of l-arginine, suggesting that they may represent a suitable model to investigate the role of NO in IL-1β-induced Ca2+ release. The results obtained with the human astrocytoma cells were similar to those obtained in the tissue slices and demonstrate, for the first time, an increased concentration of intracellular Ca2+ stimulated by IL-1β. In contrast to the sustained effects observed in tissue slices from striatum, the Ca2+ response in astroglial cells was transient, dropping to basal value after 75 min of IL-1β stimulation. In terms of the concentration-dependent effects of NO discussed above, it is possible that, in the cell preparations, the longer stimulation period used (75 min) compared with tissue slices (30 min) could have resulted in sufficiently high steady-state NO concentrations to inhibit the Ca2+ response. Alternatively, it is possible that a process might be activated resulting in the inhibition of NO production in the glial cells. A neurotrophic factor that markedly reduces NO release in glial cells and protects against ischemia-induced infarction in cerebral rat cortex has indeed been reported (Wang et al., 1997).
The finding, that RR but not heparin antagonized IL-1β-induced Ca2+ release is unlikely to result from differences in the Ca2+-loading kinetics between the RY- and IP3-sensitive pools, because the time course of tissue45Ca2+loading showed 30 min to be sufficient to load the cells to equilibrium. Because we used permeabilized tissues and reports showed low molecular weight heparin passing through different cell membrane systems (Watanabe et al., 1995; Brayden et al., 1997; Leveugle et al., 1998), we can rule out the possibility that problems related to cell permeation account for the lack of heparin effect. Under the conditions used in this study, it would therefore appear that the RY-sensitive Ca2+ pool and to a lesser extent the IP3-sensitive pools contribute to the IL-1β response. Furthermore, comparison of the results obtained with RR and RR plus heparin shown in Figure 8 suggests that a calcium-induced calcium release mechanism is indeed operating, with the RY receptor-released calcium as the priming event. Alternatively, it is possible that the two pools can be regarded as independent Ca2+ stores with different intracellular locations (for a detailed review, see Pozzan et al., 1994), as shown in sea urchin eggs in which the RY receptors are mostly concentrated in ER areas of the subplasmalemma cytoplasm and the IP3receptors in the deep cytoplasm (Parys et al., 1992). The much slower time course of Ca2+ release in the presence of RR (Fig. 8) would be consistent with a lower accessibility of the heparin-sensitive receptors.
NO plays a key role in modulating intracellular Ca2+ release from both the RY- and IP3-sensitive Ca2+pools (Clementi, 1998). Although the signaling pathways involved are still primarily unknown, NO-mediated generation of cGMP and activation of a G kinase are generally accepted as being parts of the overall mechanism (Galione et al., 1993). The present results showed that both IL-1β and the NO donor Dea/NO raised the striatal cGMP, between two and three times above the basal concentration. Furthermore, the membrane-permeant analog of cGMP, di-cGMP, gave a concentration-dependent increase in Ca2+release. Comparison of time courses of Ca2+ release and cGMP elevation shows that there was a 15 min delay in the changes of Ca2+ compared with those of cGMP and suggests cGMP synthesis to be upstream of the Ca2+ response. Finally, inhibitors of guanyl cyclase, LY-83,583 and ODQ (Garthwaite et al., 1995; Vigne et al., 1995; Schrammel et al., 1996), antagonize Ca2+ release in striatum induced by the lower concentration of IL-1β. Collectively, these results are strong support for the involvement of cGMP in NO-induced Ca2+ release, whereas the data showing failure of ODQ and LY-83,583 to inhibit this response with the higher IL-1β concentration is contradictory. In an attempt to reconcile this data, it is possible to postulate that the effect of NO on Ca2+ release in the striatum may be mediated by both cGMP-dependent and cGMP-independent pathways in which there are direct interactions of NO with cellular and extracellular proteins or nitrosylation of receptors or production of peroxynitrite (Brune et al., 1996; Elliot, 1996; Stoyanovsky et al., 1997). Accordingly, if the higher IL-1β concentration was able to induce maximal Ca2+ release by either pathway, then inhibiting the cGMP-dependent pathway with guanyl cyclase inhibitors would not modify the response.
However, considering the concentration-dependent effect of NO on Ca2+ release discussed above and a recent report showing ODQ and LY-83,583 to interfere with NO production and reduce its effective concentration (Mülsch et al., 1988; Feelisch et al., 1999), it is possible that the higher dose of IL-1β might have produced inhibitory amounts of NO and that ODQ and LY-83,583 have lowered them to values that may become stimulatory. Indeed, the shorter lag phase of Ca2+ release shown in Figure7 with the higher cytokine concentration would corroborate this hypothesis.
NO signaling system in Ca2+ homeostasis plays a crucial role in vascular cell physiology and other physiological and pathological processes (for review, see Moncada and Higgs, 1993), including solid tumor progression and angiogenesis (Gallo et al., 1998). This work has demonstrated that NO/cGMP signaling is a part of the intracellular mechanism transducing IL-1β-mediated Ca2+ release in the pyrogenic response. Besides being an endogenous pyrogen, IL-1 contributes to many neurological responses, such as those in multiple sclerosis, acquired immunodeficiency syndrome, dementia complex, stroke, and Alzheimer's disease (for review, see Rothwell, 1991). The present results may indicate that the NO-dependent modulation of [Ca2+]i is part of the signaling cascade subserving some of the multiple functions of IL-1β.
Footnotes
This study was supported by contributions from the Ministero dell'Università della Ricerca Scientifica e Tecnologica (Cofin '99) and the Consiglio Nazionale delle Ricerche (Roma, Italy). This article is part of the work of A.M. for the degree in Chemistry and Pharmaceutical Technologies. An abstract of this work was presented at the meeting of the Italian Society of Pharmacology, May 1997 (Bari, Italy). We warmly thank Prof. S. Nicosia (Institute of Pharmaceutical Sciences, University of Milan, Milan, Italy) for her helpful suggestions in performing Ca2+ experiments with fura-2.
Correspondence should be addressed to Dr. Mitri Palmi, Istituto di Scienze Farmacologiche, Università di Siena, via Piccolomini 170, 53100 Siena, Italy. E-mail: palmi{at}unisi.it.


