

Abstract
Many well characterized central pattern generators (CPGs) underlie behaviors (e.g., swimming, flight, heartbeat) that require regular rhythmicity and strict phase relationships. Here, we examine the organization of a CPG for leech crawling, a behavior whose success depends more on its flexibility than on its precise coordination. We examined the organization of this CPG by first characterizing the kinematics of crawling steps in normal and surgically manipulated animals, then by exploring its features in a simple neuronal model. The behavioral observations revealed the following. (1) Intersegmental coordination varied considerably with step duration, whereas the rates of elongation and contraction within individual segments were relatively constant. (2) Steps were generated in the absence of both head and tail brains, implying that midbody ganglia contain a CPG for step production. (3) Removal of sensory feedback did not affect step coordination or timing. (4) Imposed stretch greatly lengthened transitions between elongation and contraction, indicating that sensory pathways feed back onto the CPG. A simple model reproduced essential features of the observed kinematics. This model consisted of an oscillator that initiates propagating segmental waves of activity in excitatory neuronal chains, along with a parallel descending projection; together, these pathways could produce the observed intersegmental lags, coordination between phases, and step duration. We suggest that the proposed model is well suited to be modified on a step-by-step basis and that crawling may differ substantially from other described CPGs, such as that for swimming in segmented animals, where individual segments produce oscillations that are strongly phase-locked to one another.
Many rhythmic motor patterns are generated by central pattern generators (CPGs) that do not require peripheral feedback (Delcomyn, 1980). In many cases, however, sensory feedback is necessary to produce a normal motor pattern (Pearson and Ramirez, 1997). The majority of CPGs that have been well characterized on the neuronal level underlie very stereotyped behaviors that require strict phase relationships and regular rhythmicity: for example, swimming in lamprey (Grillner et al., 1991), tadpole (Roberts et al., 1997), leech (Friesen, 1989; Brodfuehrer et al., 1995), andClione (Arshavsky et al., 1985; Satterlie, 1985), chewing in crustacea (Selverston and Moulins, 1987), feeding in mollusks (Gillette and Davis, 1977), as well as leech heartbeat (Calabrese et al., 1995). Similarities in the neuronal architecture underlying these behaviors across phyla have become evident. For instance, CPGs for swimming in segmented animals consist of independent oscillators in each segment, which are rigidly phase-coordinated to ensure that intersegmental phase lags are a fixed percentage of the body length to maximize propulsive forces while minimizing head movement [for a review of lamprey, tadpole, and leech swimming, see Skinner and Mulloney (1998)].
Crawling and stepping behaviors must constantly adapt to a highly variable terrain, both to establish appropriate foot placement and to avoid obstacles (Grillner, 1981; Lavoie et al., 1995). When leeches crawl over uneven terrain, they make exploratory movements and use resulting tactile cues to determine appropriate sucker placement (Gray et al., 1938; Baader and Kristan, 1995). The circuit underlying crawling, known to be a CPG (Eisenhart et al., 1995), must therefore be capable of stopping the rhythm in midstep, permitting searching movements, then continuing from a number of different positions. In addition to this flexibility, the leech crawling CPG differs from those of swimming in that precise intersegmental coordination is not important. To make forward progress, segments need only elongate at some point in the interval between front sucker release and placement and contract sometime between rear sucker release and placement. The present study addresses whether a CPG that requires flexibility but not precise timing might be different from those described that require regularity and precise phasing.
When crawling on a uniform, smooth surface, leeches typically produce stereotyped crawling steps that vary in duration from 2 to 10 sec. Each stereotyped step consists of elongation followed by contraction movements that are coordinated with sucker attachment and release to propel the leech forward (Fig. 1) (Stern-Tomlinson et al., 1986). The elongations and contractions result from waves of segmental lengthenings and shortenings that propagate from the anterior to the posterior end of the animal. The propagation rate of the waves, as well as other aspects of step coordination (e.g., sucker placement and pauses between the waves) vary in proportion to the step-cycle period (Stern-Tomlinson et al., 1986). To date, the location and identity of the neurons that comprise the CPG have not been determined.

Sequence of events in a vermiform crawling step of a medicinal leech. The step begins with front sucker release and the commencement of a front-to-back wave of segmental elongations (indicated by the top gray bar). Some time later, the front sucker attaches and a front-to-back wave of contraction ensues (bottom bar). Note that in the step shown there is overlap between contraction of anterior segments and elongation of posterior segments, as indicated by the overlap of the bars. During the contraction wave the rear sucker releases and later attaches after the animal has fully shortened, completing the step.
In this study, we examined the organization of this CPG by first characterizing kinematics of steps in normal and surgically manipulated animals and then by exploring features in a simple neuronal model, inspired by this kinematic study and previous phenomenological models (Stern-Tomlinson et al., 1986; Baader and Kristan, 1995). We show that an architecture that differs from swimming in this and other species can robustly reproduce the kinematics of crawling.
MATERIALS AND METHODS
Animals. The leech nervous system consists of 21 midbody ganglia, one per segment, each containing approximately 400 neurons, and a head and tail brain composed of four and seven fused ganglia, respectively. We used adult 2–4 g Hirudo medicinalis that were obtained commercially from Leeches USA (Westbury, NY) and maintained in artificial pond water at 15° C.
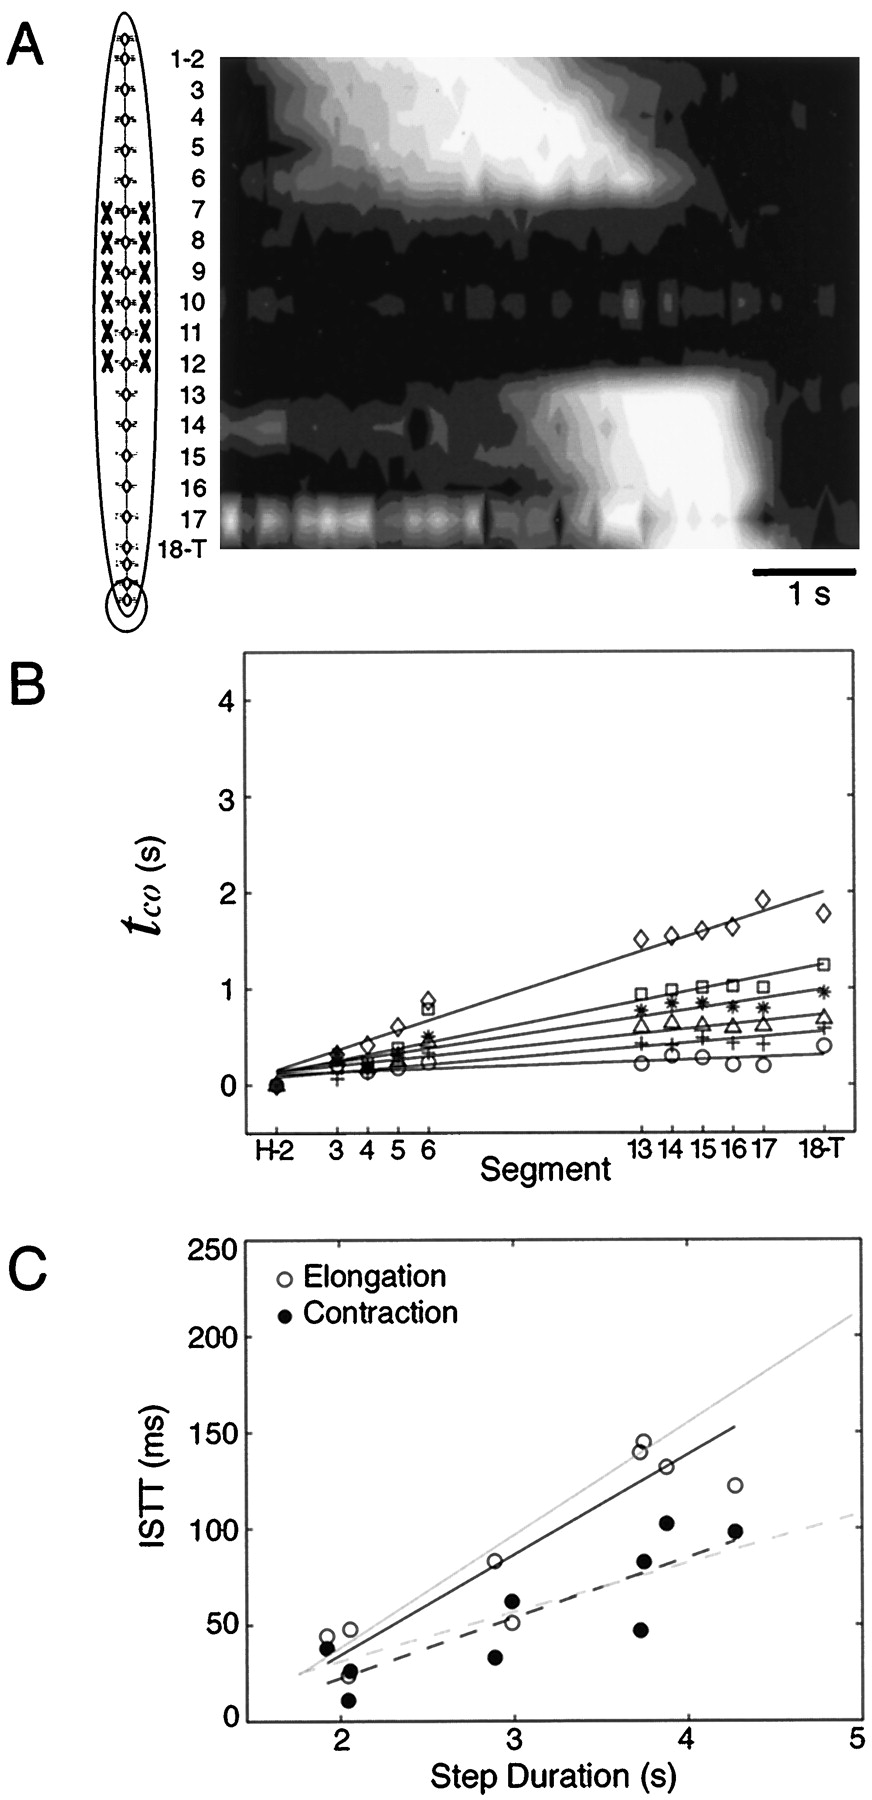
Markers. To characterize crawling steps, we measured the lengths of individual segments by analyzing digitized videotapes of animals implanted with markers of segmental boundaries. The markers were knots of white sewing thread attached with fine surgical sutures to the dorsal midline at every segmental boundary from the posterior border of segment 2 to the anterior border of segment 18. These markers defined segments 3–17 individually as well as two larger sections, the first (H-2) from the head end to the first maker in segment 2 and the second (18-T) from segment 18 to the tail end (Fig.2A). To attach the markers, we anesthetized leeches in leech saline containing 8% ethanol for 30 min before and throughout the surgery. After surgery, we put the leeches back into artificial pond water and allowed them to recover for 1–3 d before we videotaped their behavior.

Quantification of crawling steps.A, Digitized video image of a leech during a crawling step, just after placement of the front sucker and the onset of the contraction wave in anterior segments. White spots are the markers sewn into the body wall to delimit the boundaries between segments. The lengths of three regions are shown for each video frame over the course of the step (segments H-2, top; segment 10, middle; and segments 18-T, bottom; correspondence to body regions indicated by the dashed lines). Both the absolute lengths and normalized lengths are given and the corresponding curve fits by two sigmoid functions (see Materials and Methods) are superimposed (segments H-2,R2 = 0.98; segment 10,R2 = 0.96; segments 18-T,R2 = 0.92). By definition, all regions begin the step in a shortened state, become longer during elongation, and then shorter during contraction. Note that both the absolute times of elongation and contraction as well as their rates differ in the three regions. B, Illustration of curve fit parameters. The normalized length is shown for a single segment with the curve fit superimposed as in A. The times of elongation and contraction correspond to the time of half-maximal elongation and contraction (i.e., normalized length = 0.5) as indicated by thedashed lines (in this exampletel = 1.9 sec andtco = 4.0 sec). The rates of elongation and contraction are equivalent to the slope of the curve fit (in fraction per second) at tel andtco, respectively (in this examplemel = 0.7/sec;mco = −1.4/sec). Thebar at the top corresponds to the gray scale depiction of length used in the contour plots in subsequent figures: black = maximally contracted (i.e., length = 0), white = maximally elongated (i.e., length = 1).
Behavior. Animals were placed in a 0.5 m square Plexiglas chamber that was moistened with artificial pond water. A grid was attached to the bottom of the chamber that was visible from above for calibration of digitized images. Leeches were placed in the chamber and videotaped from ∼1 m above using a CCD camera (Sanyo model VDC 3825) with a zoom lens; the magnification was selected to image a region that was ∼10 cm across. The placement of the chamber was occasionally translated between steps to ensure that leeches remained in the region that was imaged. A digital time stamp (Horita model TRG-50, Mission Viejo, CA) was used to calibrate the time base.
Leeches produced two variants of crawling: vermiform and inchworm steps (Stern-Tomlinson et al., 1986). These variants differ primarily during contraction. In vermiform steps the midbody remains close to the substrate throughout the step (Fig. 1), whereas in inchworm steps the midbody is lifted, forming a loop above the substrate during rear sucker placement. Because this looping behavior would not permit accurate measurement of distances between segments when videotaped from above, we analyzed only vermiform steps in this study. In addition, we ignored all steps that included searching movements, i.e., repeated side-to-side or front-to-back movements of the anterior end without attachment of the front sucker.
Most animals crawled readily except for those with their head brains removed. When necessary, we initiated crawling bouts by briefly stimulating the body wall electrically (5 V, 10 Hz) or by prodding the posterior sucker with a blunt rod. We did not analyze step cycles that included such stimulation.
Measurement. Video images were digitized using NIH Image at frame rates of 4–10 frames/sec, depending on step duration. At least 25 images were taken per step. The positions of markers were determined manually in each frame by selecting a pixel at the estimated center of each marker, then zooming in severalfold if necessary to determine reliably the most central pixel of each marker. Care was taken to identify the same location on each marker across frames. Distances between neighboring markers were then measured and calibrated using the grid present in each frame. The reliability of length measurements was determined by making repeated measurements of the same data. The SD of the relative positions between markers was 0.2 mm (six frames, 75 measurements); during a step the segments changed length an average of 5 mm, yielding an SD of ∼5%.
Analysis. To compare movements of a segment across steps, we normalized each step, assigning its minimum length a value of 0 and its maximum length a value of 1. We defined the segmental participation in a single step as the movements starting from rest (length = 0), going to maximal length (= 1), then returning to length = 0 (Fig.2A). The trajectories of individual steps were well described by the sum of two sigmoidal functions (R2was typically >0.90), each of which was characterized by four parameters (Fig. 2B):
 Equation 1where tel = the time of half-maximal elongation, tco = the time of half-maximal contraction, mel= the maximal rate of elongation (= slope at t =tel ) > 0, andmco = the maximal rate of contraction (= slope at t = tco ) < 0.
Because of the constraints on mel andmco, the first term in the equation describes the segmental increase in length during elongation, and the second term describes the decrease in length during contraction. In addition, tel was always less thantco because by definition segments always elongated before they contracted. Note that a “minimal time” of elongation or contraction is the inverse ofmel ormco; e.g., a value ofmel = 0.5/sec indicates that at its maximum elongation rate, the segment would elongate fully in 2 sec (= 1/mel). Note that these interpretations of parameters require that the first term is near 1 att = tco and the second term is near 1 at t =tel, which is assured by the data normalization and because tel ≪tco within a segment.
To plot the elongations and contractions in all the segments of a crawling animal, it proved convenient to express segmental lengths as a gray scale, with minimal length (0) shown as black and maximal length (1) shown as white (Fig. 2B). Combining the 17 length measurements, and applying standard smoothing procedures, produces a contour plot (Fig. 3). In these plots of segmental number versus time, each segment first elongates, as indicated by transitions from black through shades of gray to white, then contracts, as indicated by the transition from white to black running horizontally to the right across the diagram. It is apparent that there is a general trend for both contraction and elongation to occur later in more posterior segments, i.e., both elongation and contraction waves move front to back. Other measurements (e.g., the rate of movement of these waves, the durations of individual components) were also obtained from these plots; they are described as they are encountered in Results.
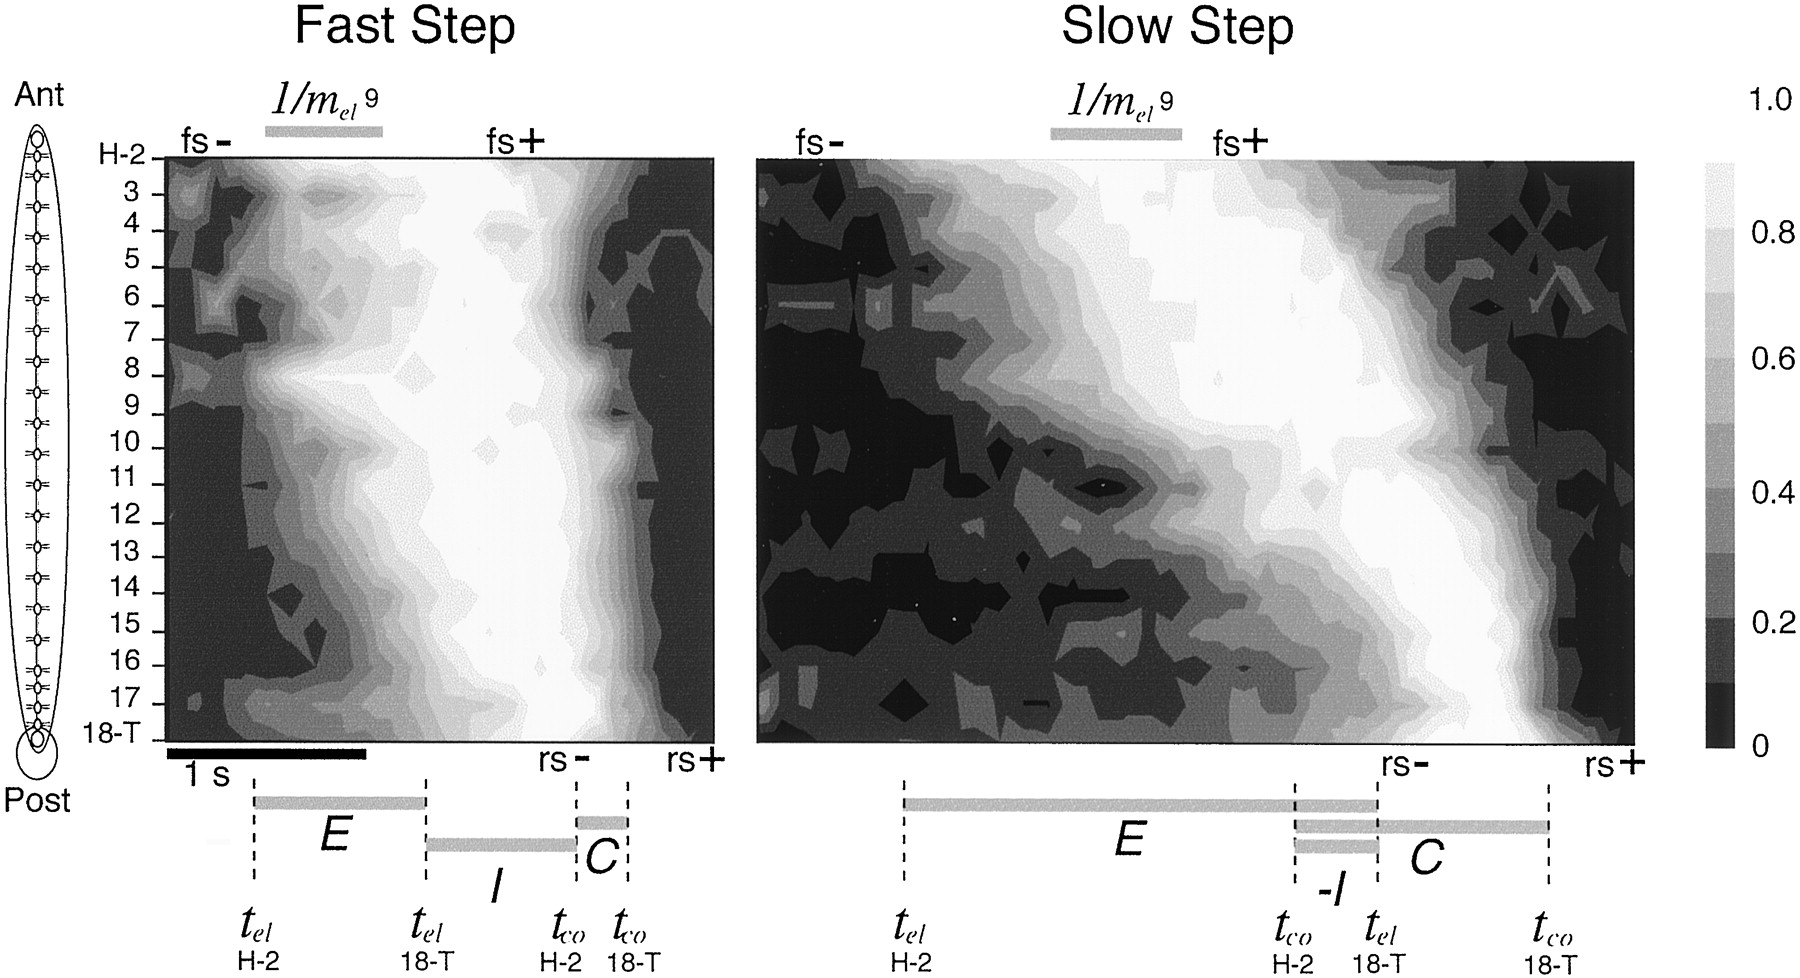
Contour plots representing two crawling steps. These plots depict the normalized lengths of all segments for a fast step and a slow step from the same leech. The shade ofgray represents the fraction of maximal segment length; the scale is given by the vertical strip to the right, as in Figure 2B. Segments are ordered from anterior (top) to posterior (bottom). Time runs left to right; thebar indicating 1 sec applies to both panels. Each segment begins the step at a shortened state (black), turns to white as it elongates, and returns toblack as it contracts. Data have been interpolated between segments to produce smooth contours. Anterior segments elongated before posterior segments forming the front-to-back elongation wave (i.e., the first gray region slanting from left to right) and similarly for contraction (i.e., the second gray region slanting fromleft to right). Gray horizontal bars at the bottom indicate the elongation propagation time [E, tel(H-2) totel(18-T)] and the contraction propagation time [C, tco(H-2) totco(18-T)] for each step. The elongation-to-contraction interval is indicated by I[tco(H-2) −tel(18-T)] and is positive for the fast step but negative for the slow step. The step duration is the interval from the beginning of E to the end of C(i.e., the total time spanned by the bars). Thetwo horizontal gray bars at the topindicate the minimal time necessary for segment 9 to elongate (= 1/mel). Note how similar this quantity is between steps as compared with the variation inE and C. Also indicated are the times of front sucker release (fs−) and placement (fs+) and for rear sucker release (rs−) and placement (rs+).
Surgical manipulations. We measured steps from animals while intact and after three different manipulations: disconnection of brains, denervation of midbody segments, and longitudinal stretch of the body. Steps from each leech after surgery were compared with steps made by that same leech before surgery to minimize the effects of differences across animals.
To characterize the influence of the brains, we disconnected them from the midbody segmental ganglia in two sequential steps: first we disconnected one brain, videotaped the animal's behavior after 2 d and then disconnected the remaining brain. (We disconnected the head brain first in half of the animals and the tail brain first in the other half.) To disconnect the brains, we opened the ventral body wall between segments 1 and 2 for the head brain and between segments 18 and 19 for the tail brain and severed the exposed connectives. Successful disconnection of the brains was confirmed by observing that the head sucker or tail sucker movements were uncoordinated with movements of the rest of the body, and by dissections after the final videotaping to ensure that the connectives were cut and had not regenerated.
To test for the influence of sensory feedback on intersegmental coordination, we denervated segments 7–12 by opening the animal on the ventral midline and severed all four nerve roots immediately adjacent to each ganglion, taking care not to damage the intersegmental connectives. Denervation was confirmed by lack of muscle tone in the manipulated segments, because these roots contain all of the sensory and motor axons to the segmental body wall.
To characterize the effects of stretch on crawling steps, we attached a small mass (2–10 gm) to a loop of surgical thread sewn into the middle of the dorsal body wall of segment 17, which had been denervated as described in the previous paragraph. The weights were tied to a string that passed through a pulley so that the force was applied approximately horizontally in the direction opposing forward movement.
Modeling. We used Spike, an integrate-and-fire simulator written by Lloyd Watts (E-mail: lloyd{at}pcmp.caltech.edu) to construct a model that could reproduce the behavioral observations. Although integrate-and-fire models only roughly represent refractory periods and subthreshold nonlinear dynamics, they are appropriate for making broad inferences about circuit properties. Spikesimulates capacitative neuron-like units that summate input currents either from synapses or from tonic “leak” currents to produce voltage changes. When a neuronal unit reaches threshold voltage, it produces an action potential followed by a specified absolute refractory period, after which the membrane potential is reset to rest. Synapses have four selectable parameters: sign (i.e., depolarizing or hyperpolarizing), current magnitude, duration of the refractory period, and saturation level (i.e., the maximum number of successive postsynaptic responses that will be summed). Tonic currents have two selectable parameters: sign and magnitude. Intersegmental conduction delays were specified to be 20 msec per segment to match electrophysiological studies (Friesen et al., 1976).
The model consisted of serial excitatory chains of units (i.e., each unit excites the adjacent posterior unit; see Fig. 9). All contraction-related activity in a single segment was represented by one unit, and all elongation-related activity was represented by a second unit. Treating each segmental population as a single unit allowed us to examine more directly the propagation of activity in excitatory chains. Thus, single units in the model represent the activity of populations of elongation- or contraction-related neurons in a segment. Simulations were produced by tuning the neuronal and synaptic parameters until the network reproduced empirical results; we chose the simplest configuration that produced robust simulations.
RESULTS
Kinematics
Normal animals
During each crawling step, individual segments first increased and then decreased in length as the animal elongated and contracted. From looking at individual steps, several features became apparent. The next section will describe representative crawling steps to illustrate these basic features, and subsequent sections provide quantitative analysis of multiple steps.
Qualitative characterization of fast and slow steps
During individual steps (Fig. 2A), anterior segments elongated more rapidly and contracted more slowly than did posterior segments. This indicates that circular muscle motor neurons (responsible for elongation) fired at a higher rate in the anterior end during a crawling step, and the longitudinal muscle motor neurons (responsible for contraction) fired at a lower rate in the anterior end because, over a broad range of motor neuron activity, muscle contraction rate is linearly proportional to motor neuron firing rate in leech muscles (Mason and Kristan, 1982). In addition, elongations and contractions started at the front end and moved rearward, as has been documented previously (Stern-Tomlinson et al., 1986; Baader and Kristan, 1995). These same features can be seen in all segments in contour plots of individual steps (Fig. 3). For example, slower rates of elongation than contraction within each segment are apparent as a looser clustering of the contour lines during elongation (i.e., going from black to white in each segment) than during contraction (i.e., going from white to black). The front-to-back propagation of both the elongation and contraction waves is also apparent in Figure 3 because the gray bands slants from left to right during both waves. In addition, it appeared that (1) propagation of both elongation and contraction waves was fairly linear across segments; and (2) contraction waves moved faster through the body than did elongation waves. Because of this difference in rate, anterior segments remained elongated longer than did posterior segments, and (3) both elongation and contraction waves progressed much more rapidly in the faster step than in the slower one. The durations of lengthenings and shortenings of individual segments, on the other hand, did not change as noticeably in step cycles of different durations. For instance, the duration of maximal elongation of segment 9, indicated by the gray bars labeled 1/mel(9) at the top of Figure 3, is nearly identical in these two steps that differ nearly twofold in duration.
Quantitative characterization of multiple crawling steps
Previous studies (Stern-Tomlinson et al., 1986) analyzed crawling as a cyclic behavior; however, in this study we treat crawling steps as individual events. Although leeches often produce multiple crawling steps in succession, they can generate single steps. We found this to be particularly true after some surgical manipulations, such as disconnecting the head brain, that leave animals fairly inactive. Such single steps do not have a true cycle period. For this study, we quantified the time span of each step by the beginning and end of active movements within that step. Specifically, we define step duration as the interval from the midpoint of elongation in the most anterior segments to the midpoint of contraction in the most posterior segments:
 Equation 2To analyze kinematics of steps it is necessary to subdivide crawling steps into physiologically relevant quantities. Previous studies have chosen differing subdivisions to emphasize different features of the steps. Stern-Tomlinson et al. (1986) measured the lengths of four-segment subsections of animals and defined subcomponents of the step cycle within each section: elongation, post-elongation, contraction, and post-contraction intervals. The difficulty in using cyclic measures, however, is discussed in the previous paragraph. In contrast, Baader and Kristan (1995) defined similar subcomponents of steps primarily on the basis of sucker movements to emphasize whole-body coordination. Specifically, they defined a whole-body elongation phase as the time from start of forward motion of the anterior end to the time of front sucker attachment, and a whole-body contraction phase as the time from front sucker attachment to rear sucker attachment. The contraction phase was additionally subdivided into two intervals on the basis of rear sucker release.
Our present data indicate, however, that sucker placements vary considerably in their timing relative to the contraction and elongation of individual segments. This is illustrated in Figure 3, in which, for instance, the rear sucker releases at a time (marked asrs−) well after the elongation reaches the posterior end in the fast step but before it reaches the posterior end in the slow step. In addition, the midsections of leeches disconnected from either or both brains produce steps without benefit of movements of either sucker. Hence, we needed to define whole-body elongation and contraction phases based on features that we could measure most reliably, namely the production and propagation of elongation and contraction waves. For this reason, we define two intervals (Fig. 3):elongation propagation time (E) as the time for elongation to propagate from front-to-back:
 Equation 3and contraction propagation time (C) is defined as:
 Equation 4In addition, we define a third quantity to characterize the time between elongations in posterior segments and contractions in anterior segments: the elongation-to-contraction interval(I):
 Equation 5In the fast step, I > 0, which means that the contraction of H-2 began after elongation reached 18-T. In the slow step, however, I < 0, which means that contraction began in H-2 before elongation of 18-T. Note that the sum of these three quantities, E + C + I, equals the step duration, as defined in Equation 2.
Elongation and contraction waves propagated at a fairly constant rate from anterior to posterior for all steps (Fig. 3). We characterized this rate by the average propagation delay between segments, denoted as the intersegmental travel time (ISTT) in a previous study (Stern-Tomlinson et al., 1986). We determined the ISTT from the slope of the linear regressions of the times of elongation (tel) and contraction (tco) in the 17 measured segments (Fig. 4A). These plots show that steps of longer duration produced slower ISTT values; i.e., the slopes of the regression lines increased in slower steps. A plot of ISTT as a function of step duration (Fig. 4B) shows that ISTT varied linearly with step duration for both elongation (from 20 to 250 msec per segment) and for contraction (20–100 msec per segment). This analysis shows that except for the shortest step durations, the ISTT for elongation was longer than the ISTT for contraction, a feature noted previously in discussing Figure 3. Multiple linear regressions of bothtel andtco on ISTT and step duration explained most of the variance among steps (R2 = 0.78% fortel and R2 = 0.71% for tco).

Quantification of steps in intact animals. A, The time of elongation and contraction (tel and tco) versus segment for five steps with step durations of 1.8 sec (circles), 2.1 sec (plus signs), 3.3 sec (diamonds), 3.8 sec (squares), and 4.9 sec (asterisks). Note that for each steptel(H-2) andtco(H-2) have been subtracted from their respective quantities in all segments to be able to overlay multiple steps. Linear regressions were fit to each step to describe the elongation and contraction waves; the slope of each regression line defines the intersegmental travel times (ISTTs) for elongation and contraction for that step. B, ISTTs of elongation (open circles) and contraction (filled circles) versus step duration (20 steps in six animals). Elongation ISTTs ranged between 20 and 250 msec per segment, whereas contraction ISTTs varied between 20 and 100 msec per segment. The slopes of the linear regressions were 58.4 msec/sec for elongation and 27.1 msec/sec for contraction. Thus, the velocity of elongation wave varied more than that of the contraction wave.C, Total durations of step components as a function of step duration (top). Both elongation durations (open circles) and contraction durations (filled circles) increased with step duration, whereas the elongation-to-contraction interval (diamonds) decreased. Data for component durations were calculated by multiplying values in for ISTTs in B by 18, the number of segments spanned by the markers. The elongation-to-contraction interval was determined byI = step duration − (E +C). The fraction of the step duration of each component is shown as a function of step duration (bottom). These curves were computed by dividing the linear regressions in thetop panel by the step duration. Because the step components had different linear dependencies, the relative coordination of steps varied with step duration. D, Relative variation in wave velocity (1/ISTT) compared to segmental elongation rate. Each data point represents the average of all segments for a single step; the error bars represent SDs. Data have been divided by the minimum on each axis to show relative variation; hence, the units of each axis represent fold increase above minimum. Individual segments elongated at a fairly constant rate over widely different wave propagation rates. Dashed line indicates a slope of 1, the expected value if both components varied equally.
A plot of the three measured step components (E,C, and I) against the step duration (Fig.4C, top panel) showed that each component varied linearly with step duration: E and Cincreased, whereas I decreased. In fact, I was positive at slow steps, 0 at steps ∼3 sec in duration, and negative in steps of longer duration. This plot indicates that the specific case shown in Figure 3, in which I is positive for the fast step but negative for the slow step, is true in general. BecauseE, C, and I had different linear dependencies on step duration, their relative durations, and hence the composition of steps, differed as a function of step duration (Fig.4C, bottom panel). For slow steps,E and C comprised a large fraction of the step duration, whereas in fast steps, I comprised the largest fraction of the step.
A final feature noted in Figure 3 was that the duration of elongation and contraction within each segment changed relatively little despite large changes in the ISTT. This was quantitated by comparing the variation in the contraction rates (mel andmco) as a function of the rate of wave movement through the animal (i.e., 1/ISTT). In particular, the elongation velocity changed more than tenfold as the duration of steps varied from 1.7 to 4.9 sec, whereas the contraction rates changed less than threefold (Fig. 4D). The fact that the contraction rates vary relatively little with step duration implies that motor neuron firing rates are likely to vary much less than the intrasegmental delays with steps of different durations because maximal segmental contraction rate is proportional to motor neuron firing rate (Mason and Kristan, 1982).
Analyzing the slopes of the linear regressions formel andmco as a function of segment location indicated that more posterior segments elongated more slowly (mel = 0.96/sec − 0.02/sec/segment) but contracted more quickly (mco = −1.07/sec − 0.07/sec/segment) than more anterior segments (compare Fig.2A). In addition, linear regressions ofmel andmco as a function of step duration indicated that segments both elongated (0.26/sec) and contracted (−0.44/sec) more slowly for steps of longer duration (R2 = 0.65 for both variables;p < 0.001). On average, segments elongated more slowly ( m̅el = 0.78 ± 0.40/sec) than they contracted ( m̅co = −1.70 ± 0.84/sec).
Crawling steps in manipulated animals
Removal of brains. We found that leeches in which the head brain, the tail brain, or both brains had been surgically detached continued to produce crawling steps. This result contrasts with a previous study which concluded that at least one brain was necessary (Baader and Kristan, 1995). Animals with their tail brains detached had somewhat longer step durations (5.1 ± 0.6 sec) compared with intact animals (3.0 ± 0.9 sec). Animals with their head brain disconnected (either alone or with disconnection of the tail brain) crawled much less readily and much more slowly (mean step duration = 11.4 ± 4.1 sec) than did intact animals. Figure5 shows a sequence of steps from two animals while intact (top panels), then after disconnection of one brain (middle panels), and then after disconnection of the remaining brain (bottom panels). The dashed white lines superimposed over the contour plots indicate the time course of propagation of the elongation wave in each animal while intact to illustrate the relative time scales for other plots. After tail brain disconnection (middle left panel), steps were slightly longer in duration but normal because the basic components (E, C, and I) were unchanged after surgery. After head brain disconnection (middle right panel) E, C, and the step duration were significantly longer (approximately five times), and their coordination was altered; contraction began relatively much earlier in the step (i.e., I ≪ 0). Because contraction began before the elongation wave reached middle segments, these steps made minimal forward progress. Steps produced after the second surgery in the absence of both brains (bottom panels) were similar both in duration and coordination to those missing only the head brain. This suggests that the head brain but not the tail brain plays a prominent role in crawling.

Effects of brain removal on the coordination of individual steps. Contour plots show steps from two animals before and after a sequence of two surgical manipulations disconnecting first one brain and then the other from the nerve cord. Left panels show a step from an intact leech (top), then from the same leech after its tail brain had been disconnected (middle), and finally after its head brain had also been disconnected (bottom). The right panelsare a sequence from another leech whose brains were disconnected in the opposite order. The animals were allowed to recover for at least 2 d after each surgery before being videotaped. Note that steps are on different time scales. Dashed white lines indicate the average ISTT calculated from each animal while intact, displayed on the three steps for that animal for comparison.
A quantitative analysis of step components revealed that coordination in animals without brains was consistent with intact animals with abnormally long step durations. Specifically, both ISTTs (and hence propagation times) and I from the brainless animals agreed with extrapolations from intact animals to very slow steps (Fig.6). This suggests that the primary effect of brain disconnection is to increase step duration and that the observed difference in coordination, I ≪ 0, could be a secondary consequence. This also suggests that the remaining part of the circuitry, in the midbody ganglia, is sufficient to produce steps, albeit slow, with normal coordination.

Comparisons of crawling components in leeches with disconnected brains with those in intact leeches. A, Elongation ISTT as a function of step duration for intact leeches (circles), without a head brain (filled triangles), without a tail brain (open triangles), or without either brain (x). The solid line is the linear regression for the data from intact animals; dashed line is the linear regression for all the data from animals with one or both brains removed. These regressions were statistically indistinguishable at thep = 0.05 level, indicating that although ISTTs were much longer after brain removal, they had a similar dependence on step duration for all experimental conditions. B, The elongation-to-contraction interval, I, versus step duration for the same experimental conditions as above. The regression line of intact animals (from Fig. 4B) has been extended to longer step durations. Although brainless animals had large negative elongation-to-contraction intervals, the data were consistent with extrapolations from the intact animals.
Manipulations of sensory feedback. To investigate the contribution of sensory feedback to crawling, we examined steps from leeches whose segments 7–12 had been denervated. These animals produced no movements in surgically manipulated segments because the muscles in these segments received no motor innervation. Despite this, coordination appeared to be normal through the intact segments judging from the timing of activity between regions anterior to and posterior to the lesion (Fig.7A,B): the elongations and contractions appeared in the posterior segments at the times expected from intact animals (compare Fig. 7A to Fig. 3, Slow Step, and Fig. 7B to Fig.4A, bottom graph). In addition, the variation in both elongation and contraction ISTTs with step duration was nearly identical to intact animals (Fig. 7C). This implies that normal intersegmental coordination can be produced centrally in up to six denervated segments.

Step coordination in denervated leeches.A, Contour plot showing lengths of all segments for a single step after segments 7–12 were denervated. The lengths of denervated segments were normalized to the fraction of their maximal length before surgery. Note that although there was no movement of the denervated segments, the coordination of movements in the remaining segments appeared normal. B,tco for each segment for six steps from denervated animals with step durations of 2.0 sec (circles), 2.1 sec (+), 2.9 sec (triangles), 3.0 sec (asterisks), 3.7 sec (squares), and 3.9 sec (diamonds). The linear regressions for the intact segments in each step are shown; they indicate that the contraction waves propagated at a uniform rate through the denervated region. C, The ISTT of elongation (open circles) and contraction (filled circles) in denervated animals as a function of step duration for nine steps in three animals. The black lines are linear regressions to the ISTTs of intact segments of denervated animals (slope = 48.2 msec/sec for elongation, solid line; slope = 31.3 msec/sec for contraction, dashed line). Gray lines indicate regressions from intact animals, as shown in Figure 4B.
Previous studies found that stretching the body during stepping increased the step duration, but they did not determine which step components were prolonged (Gray et al., 1938; Baader and Kristan, 1995). To address this question, we examined the effects of midbody stretch on crawling steps by attaching a weight, hanging via a pulley, to the posterior end of the leech (Fig.8). As long as the rear sucker remained attached, there was no noticeable effect on either elongation or contraction. On rear sucker release, however, the weight stretched the animal, which was now attached by only its head sucker. Although this added weight stretched many segments in the middle of the leech (Fig.8, single asterisk), it did not alter the propagation of the ongoing contraction wave (Fig. 8, double asterisk). The range of weights we examined (2–10 gm) did, however, greatly prolong the delay before the rear sucker was placed down to trigger the next step. Occasionally, the application of a large weight prolonged sucker placement indefinitely (Gray et al., 1938; Baader and Kristan, 1995). Hence, stretch did not greatly affect intersegmental coordination, but could greatly prolong the time required to switch from contraction to relaxation. This result suggests that stretch sensory input can strongly influence transitions between phases in the crawling CPG.

Effects of body stretch on step coordination. Contour plot shows one step with a posteriorly directed force applied at segment 17. The force was produced by a 6.2 gm mass on a pulley (see Materials and Methods). With the rear sucker attached, the force is transmitted through this sucker to the substrate, leaving the midbody segments unstretched. When the rear sucker released (rs−), tension was applied to the midbody as evidenced by lengthening of segments 8–12 (single asterisk). The contraction wave continued to propagate linearly to posterior segments in the presence of stretch (double asterisk). Thearrow labeled rs+ indicates the time of rear sucker placement, well after the contraction wave reached the back of the animal. The gray bar labeled rs+indicates the range of rear sucker placement times for intact animals with comparable elongation ISTTs (mean ISTT = 190 msec, rs+ = 6.5 ± 0.4 sec after fs−, n = 5). Thus, the imposed stretch prolonged the step by substantially delaying rear sucker placement, not by affecting wave propagation. Note that because segment 17 was denervated, it did not contract.
Computational interpretation of kinematics
Conceptual models of leech crawling have been proposed previously (Stern-Tomlinson et al., 1986; Baader and Kristan, 1995) but have never been tested. One of them (Baader and Kristan, 1995) was quite complex and depended on data superceded by data presented here (Figs. 7, 8). We decided to construct a simple model that could explain many of the behavioral observations. In particular, the model needed to produce the following features: (1) alternating waves of elongation and contraction that progress linearly from front to back (Figs. 3, 4) (Stern-Tomlinson et al., 1986); (2) wave propagation velocities that vary more than 10-fold for steps of different durations (Fig.4B, 6) (Stern-Tomlinson et al., 1986), while (3) maintaining fairly constant motor neuron firing rates (Fig.4D); (4) contraction that occurs earlier relative to elongation in slower steps, i.e., I decreases with longer step durations (Figs. 3, 4); (5) slower steps in the absence of the head brain (Figs. 5, 6); (6) crawling steps in just midbody ganglia, i.e., without the brains (Fig. 5); and (7) crawling steps without sensory feedback (Fig. 7) (Eisenhart et al., 1995). Observations 6 and 7 indicate that the model should consist of segmentally iterated midbody circuitry and need not include the periphery to produce the basic crawling step.
We used a simple integrate-and-fire model (for details, see Materials and Methods) to determine whether an architecture based on excitatory neuronal chains is consistent with the kinematic observations of this and other studies and therefore plausible for the crawling CPG. We began with the simplest possible configuration, a chain of neuronal units connected in series by excitatory synapses, and added features only as necessary to reproduce the above observations. Such simple serial chains could produce front-to-back waves of activity, but they did not propagate robustly. In fact, the success of propagation was very sensitive to the synaptic strength between adjacent units. If synapses produced more or less than one postsynaptic spike for every presynaptic spike, spike frequency would build or decay along the chain. Only if the synapses were exactly one-to-one would activity propagate evenly along the chain, and in this case, the intersegmental travel time was very rigidly determined by the conduction velocity between units and the synaptic time course. Thus, this model configuration was not robust and too inflexible to explain crawling.
We next added positive feedback to each unit (Fig.9A). This had two beneficial consequences: (1) waves of activity propagated robustly from front to back (feature 1), and (2) the activity level in each segment changed much less than did the intersegmental travel time (feature 3). Both consequences resulted from stable bursting within each unit arising from the positive feedback, so that once units were excited beyond a threshold, they kept firing. In addition, such chains of units with positive feedback were much more robust, in that they could produce waves over a large range of synaptic strengths. Although we implemented positive feedback by self-excitatory synapses, positive feedback can result from various cellular properties and network configurations (see Discussion).

Effect of input frequency on wave velocity for excitatory chains. Each panel depicts a different model configuration or condition. The schematics of the model configuration are shown to the left. Both configurations consisted of 10 units, each with positive feedback (gain < 1), that were connected in series to the neighboring posterior unit forming an excitatory chain. For each configuration the outputs from all 10 units are shown in order from anterior to posterior running from top tobottom. Outputs are shown to a strong input (left column, 20 Hz) and a weak input (right column, 11 Hz). A, When only the frequency of the input to the front of the chain, is, was varied, similar wave velocities were produced (i.e., the onset times for bursts in the two cases are similar). B, When parallel input,Ip, was added to the configuration inA, variation in this input to all units strongly influenced the wave velocity. A serial input was necessary to ensure that the first units in the chain reached threshold, but as inA, variation in is did not significantly alter the wave velocity.
Although units with positive feedback connected in series permitted robust propagation, they could not produce the wide range of wave velocities observed in crawling steps (feature 2). Each chain had a characteristic propagation rate that depended on the strength of segmental connections and positive feedback but was nearly independent of the magnitude of activity at the beginning of the chain (Fig.9A). Because it is unlikely that the large range of step durations results from changing synaptic strengths cycle by cycle, we investigated other configurations of the chain of units.
The most successful configuration was produced by adding an excitatory input that affected all units in parallel. When we varied the activation of this parallel excitation less than twofold, the chain of units produced more than a 10-fold variation in intersegmental travel times (Fig. 9B), thus matching feature 2. Different wave velocities resulted because the parallel input modulated the thresholds of each unit. Both the parallel input and positive feedback were necessary because chains with only parallel input but not positive feedback also produced only a fixed propagation rate. Because firing rates were governed by positive feedback, they varied only about twofold for 10-fold changes in wave velocity (Fig. 9B), thus matching feature 3.
To examine whether the model in Figure 9B could produce motor output that mimicked normal steps, we constructed a more complete model consisting of separate chains of units for elongation (E units) and contraction (C units) for all 21 segments (Fig.10A). As above, each unit received positive feedback and parallel input. It was necessary to add three additional properties to the model. (1) To produce the overall coordination between elongation and contraction phases, we made the first segment itself oscillatory so that the E and C units in this segment produced alternating bursts that triggered elongation and contraction waves in their respective chains (Fig.10B). To generate this alternation we added three connections within the first segment: weak excitation from E to C, delayed self-inhibition within the C unit, and inhibition from C to E. Many other alternatives could equally suffice to produce oscillations in the first segment. (2) To control the step duration and the intrasegmental coordination, the head brain was connected to the first segment and to the parallel connections described above. This jointly controlled the rate of alternation in the first segment and the rate of wave propagation so that the step duration varied less than the rate of wave propagation (feature 4). In addition, removal of the head brain both slowed propagation in each chain and made waves harder to elicit because E and C units were much farther from threshold in the absence of parallel input (feature 5). (3) To prevent co-contraction between E and C units that otherwise occurred during fast steps, we added intrasegmental inhibitory connections between E and C units. This was necessary because cessation of activity in the oscillator caused units in the respective chains to cease firing, with a time course governed by both the conduction delay and the decay time for the positive feedback. Without these inhibitory connections the propagation rate of contraction bursts during fast steps was sufficient to cause simultaneous firing in E and C units within anterior segments.

Simulation of crawling steps. A, Schematic of the complete model configuration whose output is shown inB. The model contains separate chains of elongation (E) and contraction (C) units. Each unit has positive feedback and receives parallel input from the head brain, Ip, as in Figure9B. The E and C units in the first segment initiate waves in the respective chains and thus coordinate elongation and contraction phases. (This task could be performed by a dedicated oscillator; however, for simplicity we added properties to this segment's E and C units themselves so they produce alternating bursts: excitation from the E to C unit, inhibition from the C to E unit, and delayed self-inhibition within the C unit.) Alternating bursts were generated when stimulated by a projection from the head brain,is, which also influenced the rate of alternation, and hence the step duration. In addition, within all segments C units inhibited E units. B, Simulation of a fast (elongation and contraction ISTTs = ∼25 msec) and slow step (elongation ISTT = 250 msec; contraction ISTT = 100 msec). Outputs from E and C units for all segments are shown. The firing frequency of the head brain was set to produce appropriate elongation and contraction ISTTs, and hence elongation and contraction propagation times, and the strength of the connections within the first segment were tuned to match elongation-to-contraction intervals from the kinematic data in Figure 3. C, Model step component durations as a function of step duration. The elongation propagation time (open circles), the contraction propagation time (filled circles), and the elongation-to-contraction interval (diamonds) are plotted for the two steps shown in B, and an additional step of intermediate duration. The lines are from the kinematic data (Fig. 4C). Thus, the model could reproduce the coordination of steps over a typical range of intact step durations by varying only the “tonic input” (Ip). D, Relative variation in wave velocity (1/ISTT) compared with the variation in firing rates of E and C units. All data are normalized by dividing by the minimum value on both axes (as in Fig. 4D) so that units represent fold increase above minimum. Black filled circles indicate the relative firing rates of the E unit from segment 8 for the same three steps in C. Gray open circlesindicate the segmental rates of elongation from kinematic data (replotted from Fig. 4D). Thus, the firing rates of the model, like the observed rates of segmental elongation and contraction, were fairly constant for widely different wave propagation rates.
The complete model produced plausible motor patterns for the range of step durations observed in intact animals (compare Fig.10B to Fig. 3). Simulations of a range of step durations produced appropriate elongation and contraction propagation times (and therefore wave propagation velocities) and elongation-to-contraction intervals (Fig. 10C). Across the sixfold range of wave propagation rates in the simulations, the firing rates of segmental units varied approximately 1.5-fold (Fig.10D) consistent with the small variation in segmental elongation and contraction rates (mel,mco) observed behaviorally (Fig.4D). Hence, despite the simple nature of both the integrate-and-fire units and the connections within the network, this model based on an oscillator that initiates wave propagation in excitatory segmental chains reproduces both step kinematics and other major behavioral observations established by this and previous studies.
DISCUSSION
This work consisted of two parts: a description of the kinematics in intact and surgically manipulated animals and the construction of a computer model to explore features of the neuronal circuitry underlying leech crawling behavior.
Kinematic studies
The major advance of our kinematic studies over previous ones (Stern-Tomlinson et al., 1986; Baader and Kristan, 1995) is that we measured the lengths of individual segments, which allowed us to characterize step kinematics completely and to determine unambiguously the rates of both elongation (mel) and contraction (mco) within single segments and the wave propagation velocity (ISTT). This fine-grained analysis allowed us to see, for instance, that segmental elongation and contraction rates varied much less than the ISTT, a feature important to the model. We found that the relative coordination between elongation and contraction varied as a function of period. Because the elongation-to-contraction interval (I) is not fixed, elongation in posterior segments probably does not initiate contraction as has been proposed previously (Baader and Kristan, 1995). Because of the observed trends in I, leeches make efficient forward progress for fast steps because they elongate fully before they begin to contract. In contrast, in slow steps, anterior segments begin to contract before posterior segments elongate fully. In addition, we have found that sensory feedback in crawling plays a similar role to stepping behaviors in other species, in that inappropriate feedback can prevent transitions between phases (Deliagina et al., 1975; Grillner, 1978; Whelan et al., 1995; Pearson and Ramirez, 1997).
Two conclusions from our kinematic studies differed from previous studies. First, this study suggests that the sensory feedback from self-generated movement is not necessary for producing normal intersegmental delays because the elongation and contraction waves moved across denervated regions at normal rates (Fig. 7). This does not necessarily mean that sensory feedback cannot influence intersegmental delays, but in the one case we tested, imposed stretch influenced sucker placement but did not affect the rate of wave propagation through the body. In contrast, a previous study has suggested that sensory feedback might be important for intersegmental coordination because the timing of the motor pattern becomes less regular in the isolated nervous system (Eisenhart et al., 1995). This could be attributed to the overall manipulation required to isolate and maintain the isolated nerve cord preparation, however, rather than the absence of sensory feedback. The second difference from previous studies was that we observed stepping in animals whose brains were detached, whereas a previous study did not (Baader and Kristan, 1995). Because steps are difficult to elicit in animals without the brains (particularly without the head brain), it is likely that this previous study did not stimulate brainless animals sufficiently to initiate crawling. Our results imply that midbody ganglia contain a portion of the CPG that is sufficient to generate crawling steps.
Behavioral differences between crawling and swimming
Crawling behavior takes place in a different environment than swimming and therefore has different behavioral demands. Because swimming produces movement through a fluid, it requires precise relationships between intersegmental delays and cycle period to maximize hydrodynamic forces for propulsion (Lighthill, 1969; Trueman, 1975). As a result, during a swimming bout, oscillations in a particular segment are temporally regular over several cycles. In contrast, crawling often occurs in a nonuniform environment and can adapt to the terrain on a step-by-step basis. These adaptations to nonuniformities can take several forms. First, during elongation leeches can pause, make searching movements, and resume a step. Second, leeches sometimes produce only one step cycle, for instance, to attach to a food source. Third, successive steps can have substantially different periods. Even for stereotyped steps the relative durations of elongation and contraction are not constant, unlike the successive phases of swimming (Kristan et al., 1974). There is also a significant nonuniformity in the segmental movement cycle, both in different segments and in the same segment in different steps. Because elongation waves generally propagate more slowly than contraction waves, the shape of oscillations differs between segments, namely posterior segments remain elongated for a shorter time (Figs. 3, 4B). Additionally, because the velocity of elongation waves varies more than that of contraction waves (Fig. 4B), the relative duty cycle of elongation and contraction is a function of step duration (Fig. 4C). Such variations in step cycles are unlike the regular segmental rhythmicity seen in swimming.
Because of these behavioral differences, crawling may require a different type of neuronal control system from that found to underlie swimming. The neuronal basis for swimming behavior has been extensively investigated in several species, including lamprey (Grillner et al., 1991), tadpole (Roberts et al., 1997), leech (Friesen et al., 1976;Friesen, 1989; Brodfuehrer et al., 1995), and crayfish (Murchison et al., 1993). In all cases, there are multiple, probably segmental, oscillators, and the propagation of activity from one segment to the next results from coupling between segments. Interactions between segments cause each segment's oscillation to be delayed with respect to the adjacent segment (Kopell and Ermentrout, 1988; Skinner and Mulloney, 1998). Therefore each phase occurs earlier at one end and propagates toward the other forming the traveling waves that produce swimming. Such a neuronal architecture, with traveling waves that rigidly phase-lock segmental movements, serves well for swimming. Such an architecture may not be appropriate for crawling, however, with its searching movements, erratic steps, and irregular alternation between phases within segments. If coupled oscillators did underlie crawling, the coordination of the oscillators must be modifiable step by step. For instance, to pause and restart the rhythm midstep, relative segmental phase lags would need to be maintained in the absence of oscillations, a difficult task for the types of dynamic systems thought to underlie swimming. In addition, searching movements resemble crawling movements in the anterior end, which reaches out and pulls back while the rest of the animal remains frozen in midstep. One architecture that can explain propagation of activity between segments in the absence of a regular rhythm is based on the spread of excitation (Ermentrout and McLeod, 1993; Idiart and Abbott, 1993; Ermentrout, 1998), where neurons active in one segment directly excite the next, creating a traveling wave. We examined the plausibility of this type of architecture for leech crawling.
Model architecture
The crawling model consists of a single oscillator at the anterior end that initiates the propagation of elongation and contraction waves alternately in excitatory segmental chains. Each segment requires positive feedback to generate robust waves, and multiple segments must share parallel input to produce a 10-fold range in wave velocities. The propagation of elongation and contraction waves in the model is analogous to the propagation of an action potential along an axon. As in an action potential, the wave propagation velocity is independent of the magnitude of excitation [e.g., the potential at the spike initiating zone; see also Fig. 9A; for theoretical treatment, see Ermentrout and McLeod (1993)]. Hence, there must be an additional mechanism to control wave velocity. Parallel input provides a way to control the propagation velocity by reducing the threshold for positive feedback. In addition, the spike frequency in individual segments is largely independent of wave velocity because it is governed by the positive feedback, much like the height of an action potential is independent of the conduction velocity of the axon.
Many of the cellular and network elements used in the model have been demonstrated in other leech circuits: positive feedback could result from various sources, including intrinsic neuronal properties, like persistent Na+ channels in leech heart interneurons (Opdyke and Calabrese, 1994; Nadim et al., 1995) or reciprocally excitatory connections between motor neurons (Ort et al., 1974); parallel descending projections from head brain neurons to many segments are used to control swimming in the leech (Brodfuehrer et al., 1995); the leech heartbeat CPG is composed of oscillatory networks that are located in some segments but not others (Calabrese et al., 1989). Physiological studies will be necessary to demonstrate the existence of the proposed features in the crawling circuitry.
As discussed in the previous section, step-by-step modifications of the crawling behavior present great difficulties for neuronal architectures like coupled oscillators. In contrast, the “propagation of excitation” model proposed here for crawling lends itself readily to such modifications, because the two essential elements are controlled by distinct neuronal processes: the propagation of segmental waves of activity is separate from the determination of overall phasing (elongation vs contraction) by the oscillator. Influencing each of the elements would have a qualitatively different effect on the central rhythm. For example, the prolongation of contraction by sensory feedback (Fig. 8) could be explained by stretch receptors exciting the oscillator's contraction unit, thereby preventing the transition to elongation while still allowing waves to propagate to the end of the animal. In addition, pausing the crawl in midstep could be accomplished by decreasing the parallel input to stop wave propagation (by preventing additional segments from reaching their threshold) while simultaneously preventing phase transitions within the oscillator. Future studies will examine these possibilities.
To date, the location of the crawling oscillator is not known. Because they found that both halves of a transected leech can produce crawling movements, and because they could not produce crawling in midbody sections lacking brains, Baader and Kristan (1995) proposed that there are two redundant oscillators located in the head and the tail brains, which together determine the overall phase of elongation or contraction for the animal. The fact that leeches can indeed crawl without input from either brain (Fig. 5), however, shows that midbody ganglia contain a crawling pattern generator, perhaps in addition to ones in the brains. The exact location and composition of the oscillator was not addressed in the present study; it could be located in the first segment as implemented in the model, be distributed across segments, or be several distinct but redundant oscillators. What is important to the proposed model is that the oscillator acts singularly to initiate traveling waves of elongation and contraction in excitatory chains.
Comparison with vertebrate walking
Walking behaviors in vertebrates are extremely flexible on a step-by-step basis (Georgopoulos and Grillner, 1989; Lavoie et al., 1995). The overall nature of circuitry of the vertebrate walking CPG has proven elusive (Hultborn et al., 1998), but evidence from several sources suggests that it is composed of coupled oscillators. Evidence from turtle scratching (Stein and Smith, 1997) and newt walking (Cheng et al., 1998) indicates that the circuitry is modular and that individual modules can generate oscillations independently in individual joints, or even in flexor and extensor populations within a joint (Cheng et al., 1998). In addition, amphibian walking and swimming motor patterns are similar and could plausibly be produced by the same circuitry (Cohen, 1988; Delvolvé et al., 1997). Precise control over limb placement during stepping results at least in part from descending connections and has developed through vertebrate evolution (Georgopoulos and Grillner, 1989). It is possible that leech crawling simply uses a different neuronal architecture than do the systems controlling vertebrate walking, but it is also possible that the notion of coupled oscillators, which works well for describing swimming, needs to be examined critically as a mechanism for producing stepping behaviors. The neuronal mechanisms proposed for the control of stepping in insects and other arthropods, for instance, emphasize the influence of various reflexive mechanisms and interactions among individual oscillators that are more complex than simply coupled oscillators (Cruse, 1990; Baessler, 1993). Because it has recently been possible to elicit crawling in the isolated leech nervous system (Eisenhart et al., 1995), future physiological studies can now determine which type of model best describes the CPG for leech crawling and should be able to suggest ways in which such models can be tested in the more complex, but less tractable, neuronal systems responsible for vertebrate walking.
Footnotes
This work was supported by National Institutes of Health (NIH) Training Grant GM08107 (T.W.C.) and NIH Research Grant MH43396 (W.B.K.). We thank Joobin Gharakhani for assistance with data collection, Teresa Esch for thoughtful discussions and careful reading of this manuscript, and Lloyd Watts for supplying Spike.
Correspondence should be addressed to William B. Kristan Jr, Department of Biology, University of California, San Diego, 9500 Gilman Drive, La Jolla, CA 92093-0357. E-mail: wkristan{at}ucsd.edu.


