

Abstract
Optimal perception of surface roughness requires lateral movement between skin and surface, suggesting the importance of temporal cues. The roughness of periodic gratings is affected by changing either inter-element spacing (groove width, G) or element width (ridge width, R). Peripheral neural responses to gratings depend quantitatively on a spatial variable, G, and a temporal variable, grating temporal frequency (Ft), with changes inR acting indirectly through concomitant changes inFt. We investigated, psychophysically, the contribution of temporal cues to human tactile perception of roughness, using gratings varying in either R or G. Gratings were scanned across the immobile fingerpad with controlled movement speed (S) and contact force. In one experiment, we found that roughness magnitude estimates depended on bothG and Ft. In a second experiment, discrimination of the roughness of gratings varying in either R or G was affected by manipulating Ft. Overall, the effect ofG on roughness judgments was much stronger than that ofFt, probably explaining why many previous studies using surfaces that varied only in inter-element spacing led to the conclusion that temporal factors play no role in roughness perception. However, the perceived roughness ofR-varying gratings was determined byFt and not spatial variables. Roughness judgments were influenced by G andFt in a manner entirely consistent with predicted afferent response rates. Thus perceived roughness, like peripheral afferent responses, depends in part on temporal variables.
- human
- perception
- somatosensory
- touch
- finger
- texture
- gratings
- roughness
- temporal frequency
- psychophysics
- discrimination
- magnitude estimation
Surface roughness is particularly salient to the tactile sense (Klatzky et al., 1987) and is better assessed using touch than vision (Heller, 1989). Tactile roughness perception is commonly studied using periodic surfaces such as gratings of alternating ridges and grooves, or dot patterns (Sathian, 1989;Johnson and Hsiao, 1992). Perceived roughness increases with increasing inter-element spacing, grating groove width (G) (Lederman and Taylor, 1972; Sathian et al., 1989), or dot spacing (Connor et al., 1990; Connor and Johnson, 1992; Meftah and Chapman, 2000) and less markedly with decreasing element width, grating ridge width (R) (Lederman and Taylor, 1972; Sathian et al., 1989). Optimal discrimination of textures requires lateral motion (Meenes and Zigler, 1923; Krueger, 1970; Morley et al., 1983; Lederman and Klatzky, 1987;Gamzu et al., 2000; Hollins and Risner, 2000), which introduces a temporal dimension and thus the possibility that temporal factors are important. Yet, temporal cues are generally considered unimportant to roughness judgments, except for very fine surfaces (Srinivasan et al., 1990; Hollins and Risner, 2000), because neither changes in movement speed (S) (Lederman, 1974; Kudoh, 1988; Meftah and Chapman, 2000) nor pre-adaptation by vibrotactile stimuli (Lederman et al., 1982) seem to affect roughness magnitude estimates greatly.
Temporal factors do affect, however, neural responses to gratings. Peripheral afferents fire in bursts phase-locked to grating temporal frequency (Ft) (Darian-Smith and Oke, 1980; Morley and Goodwin, 1987), so that their temporal firing patterns reflect grating periodicity.
Since:
 Equation 1Ft increases as Sincreases or as either G or R decreases. At constant S, the number of impulses per afferent burst (Iburst) is influenced by altering either G or R; however, when S is covaried with G or R to keepFt constant,Iburst still depends on Gbut is now invariant with R (Goodwin et al., 1989). Hence, changing R affects peripheral afferent responses only indirectly through associated changes inFt. The dependence ofIburst on G andFt is given by:
 Equation 2where a, b, and c are constants the values of which differ between afferent types (Goodwin et al., 1989).
Mean firing rate (Is) is the product of Ft andIburst, hence:
 Equation 3The representation of grating periodicity is preserved in the temporal firing patterns of thalamic (Sinclair et al., 1991) and primary somatosensory cortical neurons (Sinclair and Burton, 1991a;Sinclair et al., 1996).
The precise neural encoding of temporal variables conflicts with the idea that these variables do not contribute to perceived roughness. We therefore reinvestigated the contribution of temporal cues to roughness judgments, using gratings (Fig.1A) varying in either element width (R) or spacing (G). On the basis of neurophysiological findings reviewed above, we hypothesized that temporal variables contribute to roughness judgments. An alternative hypothesis is that these variables are filtered out by neural processing and do not influence roughness perception. Our aim was to distinguish between these two competing hypotheses. We sought convergent evidence using two psychophysical approaches: roughness magnitude estimation and roughness discrimination.

A, Cross-sectional view of a periodic grating. G, Groove width; R, ridge width; spatial period = G + R.B, C, Trial structures in the magnitude estimation (B) and discrimination (C) experiments. For magnitude estimation, two successive trials are shown. For discrimination, the two scans comprising a single trial are shown. The subject responded verbally after each trial. ME, Magnitude estimate;ISI, interscan interval.
Preliminary reports of our findings have been published previously in abstract form (Cascio and Sathian, 2000a,b).
MATERIALS AND METHODS
Subjects. Thirty-two task-naı̈ve subjects (mean age, 25.4 years; range, 16–49 years) were recruited from the Emory University community and compensated at an hourly rate. None had a history of trauma affecting the hand or its innervation, developmental or neurological disorders, or fingertip calluses. Separate groups, each comprising 16 subjects (10 female and 6 male), participated in two different experiments. All procedures were approved by the Human Investigations Committee of Emory University.
Gratings. Gratings were rectangular in shape, measuring 80 × 40 mm, and consisted of periodic trapezoidal patterns of alternating ridges and grooves (Fig. 1A) photo-etched in steel-backed plastic, manufactured as described previously (Sathian and Zangaladze, 1997). There were two sets of gratings. In one set,G was constant at ∼1 mm (actual values, 0.97–1.02 mm), and R varied from 0.5 to 1.95 mm. In the other set,R was constant at ∼0.2 mm (actual values, 0.16–0.2 mm), and G varied from 0.75 to 1.97 mm.
Tactile stimulation. The subject was seated comfortably with the right forearm supine and extended forward; the index finger was immobilized using adhesive tape. Auditory cues were excluded using earplugs and pink noise played through headphones; visual cues were screened out. Gratings were scanned across the index fingerpad by a custom-built stimulator comprising dual servo-controlled actuators. One actuator controlled S, the horizontal speed of grating motion. Both speed and position were monitored optically. The other actuator worked in the vertical plane to apply the gratings normal to the fingerpad with controlled contact force, sensed by a strain gauge system. The two actuators were coupled such that the action of the horizontal actuator (HA) resulted in horizontal translation of the vertical actuator (VA) to the desired position. The grating used on a particular scan was chosen from a collection of gratings arranged on a holding shelf. Before each scan, the HA moved the VA from its home position to a specified position directly above a particular grating. The VA picked up the selected grating electromagnetically and held it on a plate on its lower surface. After grating pickup, the HA moved the VA to a specified position so that one end of the grating would be directly over the fingerpad. At this point the VA was activated in displacement-control mode causing it to move down until it contacted the fingerpad. When contact was sensed by the force sensors, the VA was switched into force-control mode. The grating was then scanned once from left to right across the long axis of the finger by the dual action of the HA and VA, at the specified values of S and contact force. Scan length was equal to grating length, 80 mm. On completion of the scan, the VA was lifted off the fingerpad and moved back over the grating holding shelf, where the electromagnet was de-energized to allow the grating to drop back into its stowed position. The VA then returned to its home position to complete the cycle. The stimulator was operated using custom software running on two linked PCs, via a Labview user interface within which trial sequences were automated. On the basis of measured samples of S and force, variability in S and contact force did not exceed ±0.4 mm/sec and ±2.5 gm, respectively, from the specified values.
Experiment 1: roughness magnitude estimation. Subjects rated the perceived roughness of gratings varying in either G orR. For the R-varying set, three gratings were chosen, with R values of 0.5, 1.17, and 1.95 mm. Three gratings were also selected from the G-varying set, withG values of 0.75, 1.22, and 1.97 mm. To avoid reliance on irrelevant cues such as minor irregularities on individual gratings, multiple copies of each grating were used in rotation (three copies of the grating with the largest value of G or R and two copies for the others). Each subject participated in two sessions, one with G-varying gratings and the other usingR-varying gratings. Session order was counterbalanced across subjects. In each session, each grating was presented at three values of S: 30, 45, and 68 mm/sec for gratings varying onG and 35, 50, and 70 mm/sec for those varying onR. The values of S, G, andR were chosen so that different combinations of Sand the spatial variables yielded nearly the sameFt (Table1). This design allowed us to examine the relative contributions of each of the four variables—Ft, S,G, and R—to roughness ratings. IfFt were the primary determinant of roughness, then gratings with near-identical values ofFt would be rated as similar in roughness, regardless of spatial parameters. On the contrary, ifFt and other temporal variables were of no consequence, perceived roughness would depend only on spatial parameters (G or R). Contact force was held constant at 80 gm in this experiment.
Temporal frequency (Ft, Hz) matrix used in experiment 1
Subjects were instructed to rate each grating for roughness using a scale of their choice. Each trial consisted of a single scan of a grating across the fingerpad (Fig. 1B). The subject then called out a number representing the roughness of that grating. The number was manually recorded. Each session began with a block of 18 practice trials comprising two presentations of each of the nine combinations of S and grating, in pseudorandom order. During this block, the subject was told to select and adjust a scale for roughness. The data from this block were not analyzed. In the remainder of the session, subjects were presented 10 similar blocks for a total of 180 trials, 20 for each of the 9 combinations. The magnitude estimates from these trials were normalized across subjects by dividing each estimate for a particular subject by the grand mean of all estimates for that subject. Because roughness ratings for G- and R-varying gratings were made in separate sessions, and subjects were not asked to use the same scales between sessions, the magnitude estimates were treated as independent for each series.
Repeated-measures, mixed-model ANOVAs with normalized magnitude estimate as the dependent variable, and S and Gor R as independent variables, together with Bonferroni-corrected paired t tests, were used to assess the statistical significance (∝ = 0.05) of the results. There were three pairwise comparisons between the magnitude estimates for the three values of S at each of the three values of G orR. Similarly, there were three pairwise comparisons at each value of S between the magnitude estimates for the three values of G or R. Hence, the Bonferroni correction required p values of 0.0028 for significance for each of these 18 pairwise comparisons (per grating set). In examining the effect of Ft, pairwise comparisons were restricted a priori to magnitude estimates at the same Ft, because the key question was whether these would differ. Thus, the Bonferroni correction required p values of 0.01 for significance for each of these five comparisons (per grating set).
Experiment 2: roughness discrimination. Subjects discriminated a standard from a comparison grating, based on roughness. A baseline condition, in which both gratings were scanned at constantS (CS), was compared with two other conditions in whichS was altered. In a constantFt (CF) condition, the comparison grating, with the smaller R or G, was scanned at a slower S so that Ft was equal for the two gratings. If Ft is a critical variable, this should impair discrimination performance. To control for a potentially confusing effect of varying S, a third condition was included in which the speed changes were in the opposite direction to that in the CF condition. The grating with the smaller R or G was scanned faster in this condition, thereby exaggerating the difference inFt between the two gratings. We refer to this as the exaggerated Ftdifference (EFD) condition.
Each subject ran in four sessions, one pair each for R andG discrimination, with the R versus Gorder counterbalanced across subjects. In each trial, the subject was presented sequentially with a standard and a comparison grating, each scanned once (Fig. 1C). The subject was instructed to identify, in a two-interval forced choice, the rougher grating when performing R discrimination and the smoother forG discrimination. Because grating roughness rises with decreasing R but declines with decreasing G(Lederman and Taylor, 1972; Sathian et al., 1989), the target was always the comparison grating, which had a smaller R orG. The subject's verbal response was recorded manually. One of three copies of the standard was rotated into use on successive trials, for the same reason as in experiment 1.
S was constant (65 mm/sec) during the first session for each grating set. This session began with a demonstration trial using the standard and a midrange comparison; the subject was informed which interval (first or second) contained the target. Next, a sequence of comparison gratings was presented, starting with easy and proceeding to more difficult comparisons using a staircase procedure that converges on the 71% correct threshold (Levitt, 1971). One purpose of this sequence was to allow practice; hence, feedback was given during this phase but not during subsequent testing. The second purpose of this sequence was to select one to two comparison gratings that would yield 80–95% accuracy in the ensuing CS condition, during which subjects performed a 20-trial block for each grating. Gratings on which actual performance was 80–95% were used further in the second session (one grating for most subjects, occasionally two). For Gdiscrimination, most selected gratings were close in G to the standard (G: standard = 1.97 mm; comparisons = 1.22–1.82 mm). There was a more even distribution of gratings across the range for R discrimination (R: standard = 1.95 mm; comparisons = 0.5–1.6 mm), attesting to the greater difficulty of this task (Sathian and Burton, 1991). The second session consisted of the two conditions under which S was altered, the CF and EFD conditions, with 20 randomly interleaved trials per condition. When multiple gratings were used in the second session, all trials for one were completed before proceeding to the next. Contact force was held constant at 40 gm in this experiment.
Statistical analysis compared mean accuracy in the CF and EFD conditions with that in the baseline (CS) condition, using paired, two-tailed t tests (∝ = 0.05), Bonferroni corrected by requiring p = 0.025 for significance, given two planned comparisons in each data set.
RESULTS
Experiment 1: roughness magnitude estimation
Effect of S
Figure 2Aillustrates that, for the R-varying set, roughness for a given grating rose by almost one-sixth as S doubled. At each speed, roughness fell by one-fourth as R quadrupled. ANOVA demonstrated significant main effects (p < 0.0001) on roughness of both S(F( 2,320) = 35.9) and R(F( 2,320) = 73.7) without a significant interaction (F(4,320) = 1.15, p = 0.33). In keeping with this, roughness ratings differed significantly on seven of nine pairwise comparisons for different values ofS at a given R and on all nine pairwise comparisons for different R values at the same S.

Mean normalized roughness magnitude estimates as a function of speed (S) for gratings varying inR (A) and G(B). Values of the variable parameter are given on the right of each graph. Standard errors are too small to be shown here and are given in Table 2.
Roughness ratings for G-varying gratings also tended to increase with S (Fig.2B). G had a much larger effect than R, with roughness at any given speed tripling as G nearly tripled. ANOVA showed that the effects of both G (F(2,320) = 938.9) and S (F(2,320) = 16.0) were significant (p < 0.0001), with a significant interaction (F(4,320) = 5.63,p = 0.0002) accounted for by the absence of a significant speed effect at the narrowest G. Pairwise comparisons of roughness estimates revealed that the effects ofS for G-varying gratings were less consistent and, in general, smaller than for R-varying ones, with significant differences on only three of nine comparisons for different values of S at a given G. In contrast, all nine pairwise comparisons for different G values at the sameS yielded significant differences.
SEMs of magnitude estimates (normalized units) in experiment 1
Effect ofFt
To examine the effect of Ft, the data of Figure 2 were replotted in Figure3 as a function ofFt. For R-varying gratings, there was a clear effect, comprising a roughness increase by approximately one-half for a quadrupling ofFt (Fig. 3A). The clustering of points in Figure 3A for which values ofFt were almost identical, despite disparate values of R and S, indicates that the roughness of this series of gratings depends principally onFt rather than R orS. This was verified by pairwise comparisons of roughness ratings for the five same-Ft pairs: only two significant differences were found, both minute differences involving one roughness estimate (identified by an asteriskin Fig. 3A).

Mean normalized roughness magnitude estimates as a function of temporal frequency (Ft) for gratings varying in R (A) andG (B). Symbols as in Figure 2.Asterisk in A identifies the only estimate for R-varying gratings that differed significantly from other estimates at the nearly identicalFt.
In contrast, a plot of roughness versusFt for G-varying gratings (Fig. 3B) revealed no clustering based onFt. All five pairwise comparisons between roughness ratings at the sameFt values yielded substantial and significant differences. For example, the most extreme roughness magnitude estimates of 1.6 and 0.5 were evoked by nearly identicalFt values of 31.6 and 31.9 Hz. The plot in Figure 3B is very similar to that in Figure2B, demonstrating a large positive effect ofG (note the wide separation between the different symbols) and a small positive effect of S orFt for each grating except the one with the smallest value of G.
Relationship of roughness magnitude estimates to neural responses
This experiment demonstrates that both of the stimulus variables that determine peripheral afferent response, G andFt, also affect perceived roughness, in keeping with our hypothesis. If perceived roughness is quantitatively related to the neural responses of monkey peripheral afferents expressed in Equation 3, then it should vary with changes inFt that result from variations in either S or grating spatial parameters (G orR). Because of the complex relationship between firing rate (Is) and the stimulus variablesG and Ft, and the interdependence of these two stimulus variables, the direction in whichIs changes withFt is not constant. Thus,Is may either increase or decrease asFt rises. Moreover, the nature of the relationship varies between afferent types. It is therefore helpful to consider the effect of variation in stimulus parameters, within the range used in this experiment, on the value ofIs predicted from Equation 3. Figure4 illustrates the relationship between predicted Is andFt for each afferent population innervating the monkey fingerpad: slowly adapting type I (SA), rapidly adapting (RA), and Pacinian (PC) afferents. Predicted Is was derived from Equation 3 at each stimulus condition used in this experiment, using the values for the constants computed by Goodwin et al. (1989) for each afferent class. This neural measure increases with Ft forR-varying gratings, when G is constant, regardless of whether changes in Ftresult from changes in S or R (Fig.4A–C). For the G-varying series of gratings (R constant), however, the situation is more complicated (Fig. 4D–F). Predicted Is tends to rise withFt when S is varied for a given grating. When G is varied, its effect onIs is dominant and tends to override that of Ft. The resemblance of the plots of Figure 4 to the corresponding data of Figure 3 is striking. It suggests that perceived roughness is strongly tied to peripheral afferent response rates.

Predicted afferent firing rates (Is), for the conditions used in the magnitude estimation experiment, as a function of temporal frequency (Ft) for gratings varying inR (A–C) andG (D–F).SA, Slowly adapting type I afferents; RA, rapidly adapting afferents; PC, Pacinian afferents. Symbols as in Figure 2.
Figure 5 plots the mean roughness magnitude estimates observed in this experiment against the predicted values of Is depicted in Figure 4. When R was the independent variable, roughness was highly correlated with Is for all three afferent classes (Fig. 5A–C). The correlation was slightly higher for RAs and PCs (r = 0.97 for both) (Fig. 5B,C) than for SAs (r = 0.94) (Fig. 5A). WhenG was the independent variable, roughness correlation withIs varied between afferent classes, being best for SAs (r = 0.98) (Fig.5D), poorest for RAs (r = 0.63) (Fig.5E), and intermediate for PCs (r = 0.82) (Fig. 5F). The strength of these correlations confirms that there is a quantitative relationship between perceived roughness magnitude estimates and the peripheral neural response rates modeled mathematically by Equation 3. The concept of a universal linear relationship between perception and neural response (Johnson et al., 1996) certainly fits with our data. However, we cannot exclude the possibility of a non-linear relationship, especially in the case of RA and PC responses to G-varying gratings.
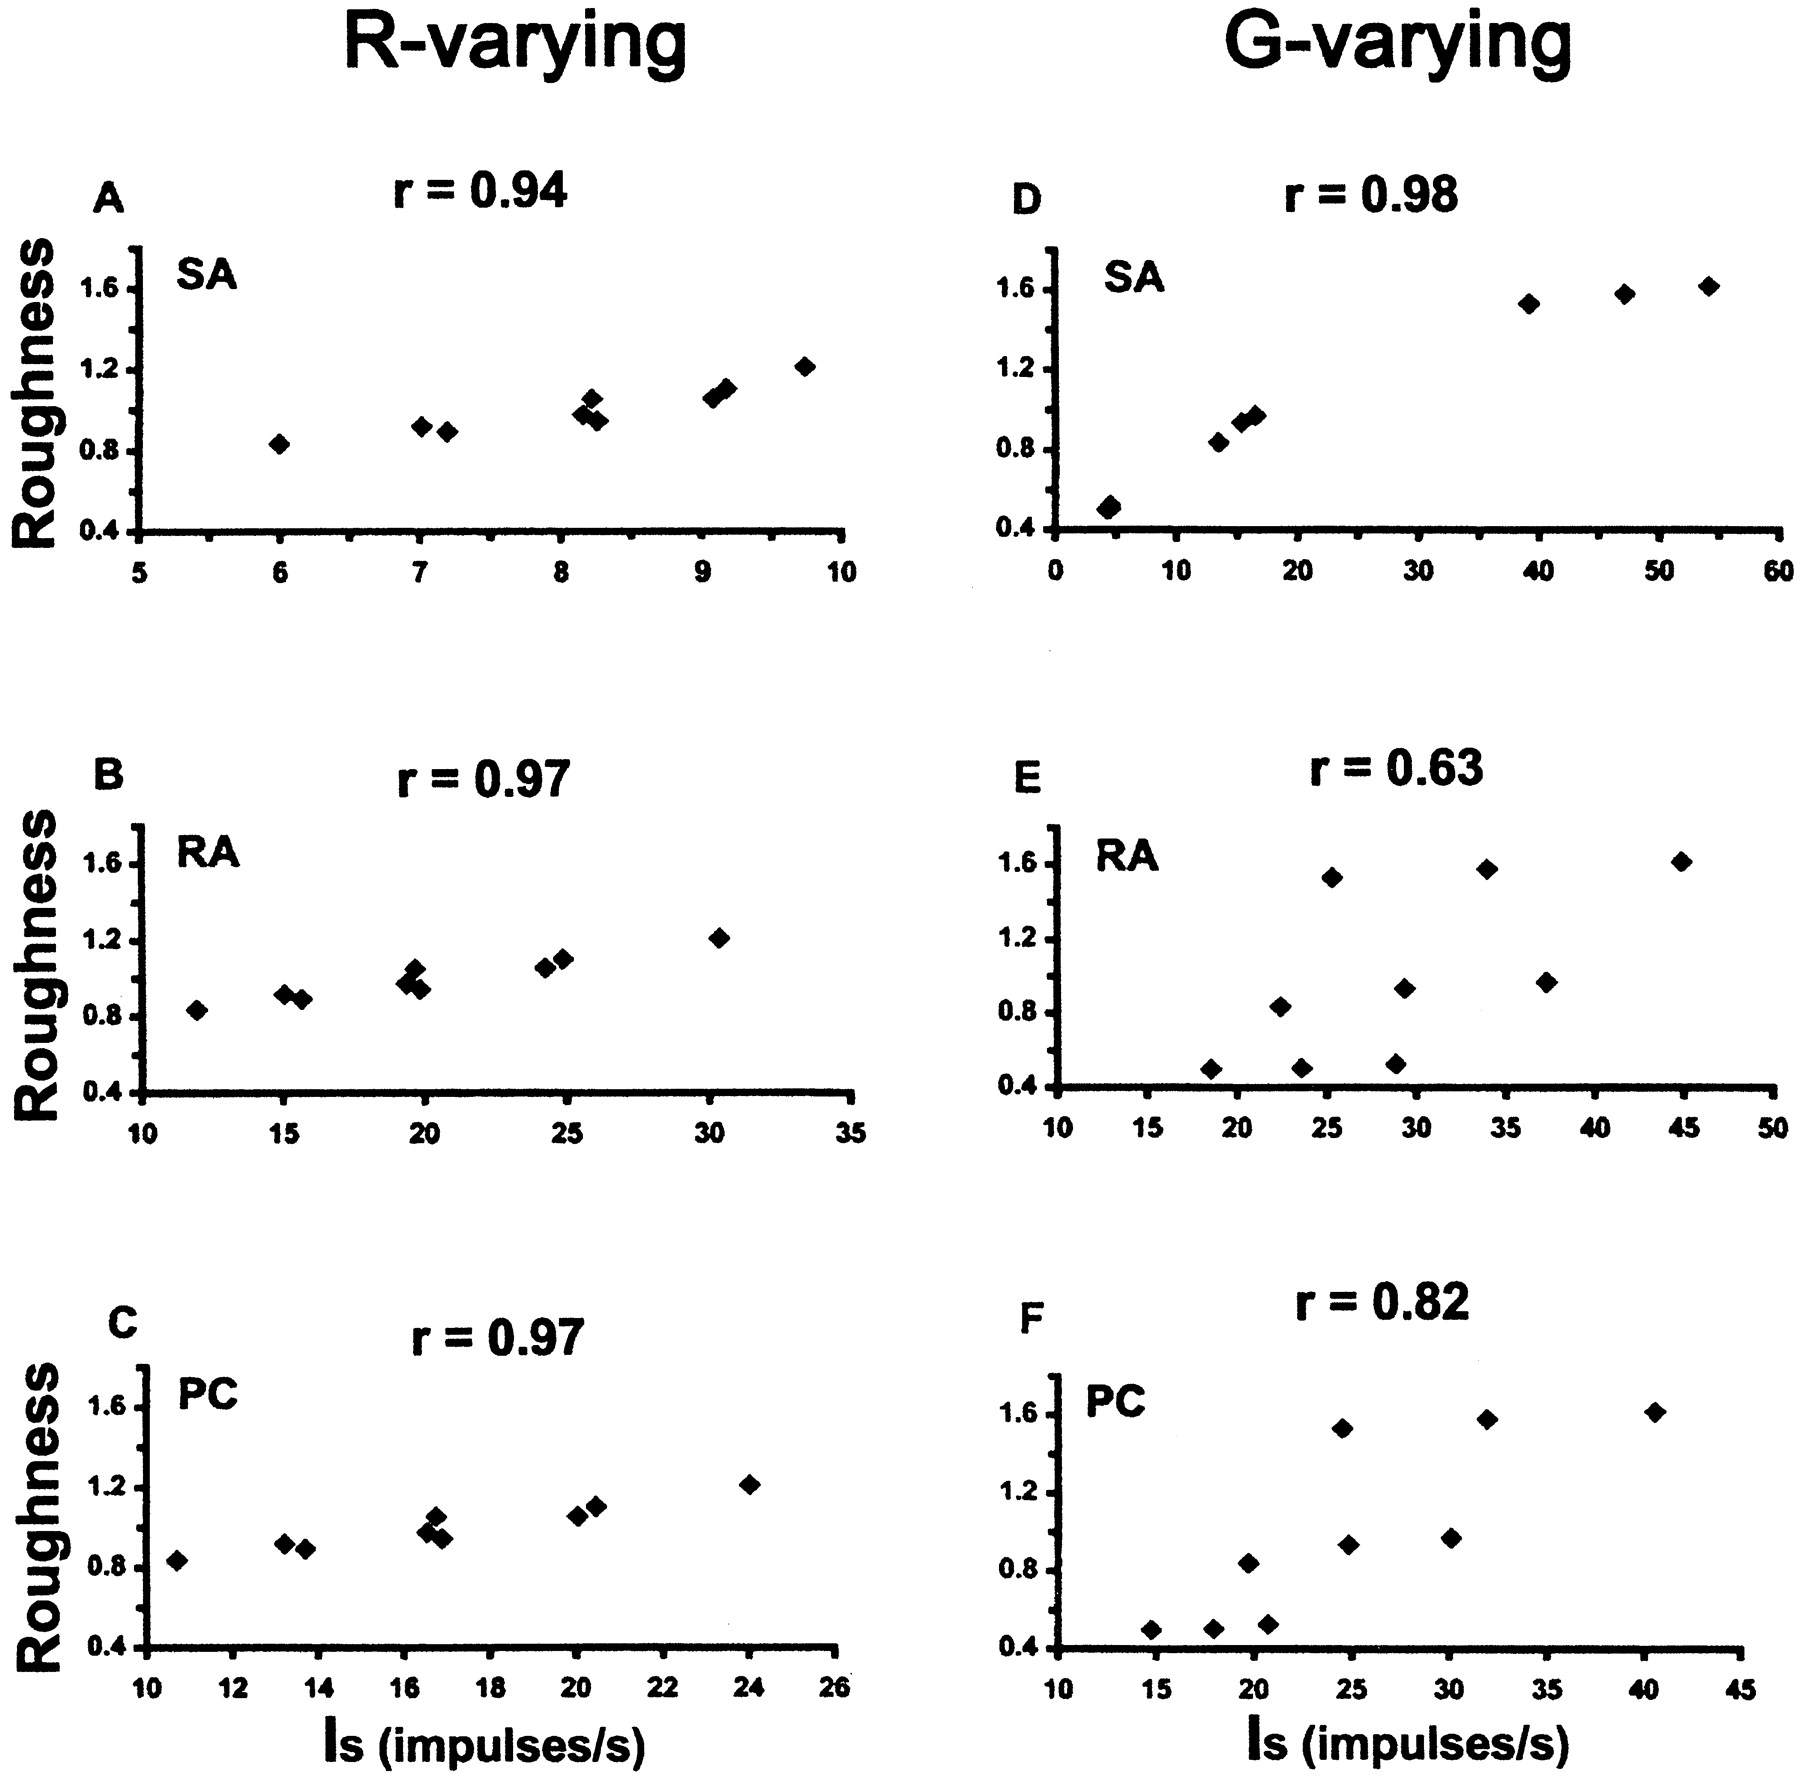
Scatter-plots of mean roughness magnitude estimates versus predicted afferent firing rates (Is), for the conditions used in the magnitude estimation experiment, for gratings varying inR (A–C) andG (D–F). Correlation coefficients are indicated above each plot.SA, RA, and PC are as in Figure 4.
Experiment 2: roughness discrimination
Effects of holding Ft constant and exaggerating Ft differences
As Figure 6Ashows, discrimination of grating roughness based on R was greatly impaired by holding Ftconstant. Accuracy declined from 83% in the baseline, CS condition to 63% in the CF condition, a significant difference (t(18) = 3.86; p = 0.001). Individually, all but 2 of 16 subjects showed this predicted impairment. In the EFD condition, in whichFt differences between gratings were exaggerated relative to the CS condition, discrimination accuracy was slightly higher but not significantly different from baseline (t(18) = −1.07; p = 0.3). This indicates that the lower accuracy in the CF condition was not simply the result of confusion engendered by changingS.

Mean discrimination accuracy for gratings varying in R (A) and G(B). CS, Constant speed condition;CF, constant Ft condition;EFD, exaggeratedFt-difference condition.Asterisks identify significant differences from the CS (baseline) condition. Error bars represent SEMs.
The results for G-varying gratings contrasted with those forR-varying gratings. HoldingFt constant resulted in slightly better roughness discrimination than at baseline for gratings varying in G (Fig. 6B), but there was no significant difference in performance between CS and CF conditions (t(18) = −1.08; p = 0.29). However, accuracy fell from a baseline of 83% to 75% in the EFD condition (Fig. 6B). Although this difference was smaller than that noted for R variation in the CF condition, it was significant (t(18) = 2.74;p = 0.01).
Relationship of discriminative performance to neural responses
If roughness perception is based on the stimulus–response relationship of Equation 3, then holdingFt constant should clearly impair roughness discrimination for R-varying gratings. Because of the dominant effect of G, this effect should be smaller forG-varying gratings. Our results, in accord with these predictions, indicate that Ft is a crucial determinant of the roughness of R-varying gratings and also influences roughness for G-varying gratings. Figure7 displays the differences in predictedIs between the standard grating and the most commonly used comparison grating in each series, for each of the three conditions (CS, CF, and EFD) and each afferent class. Comparison of Figure 7 with Figure 6 reveals that the differences in predicted Is of all three afferent types bear the same relationship between conditions as the corresponding performance values. Specifically, the significant declines in accuracy (relative to baseline) in the CF condition forR-varying gratings (Fig. 6A) and in the EFD condition for G-varying gratings (Fig.6B) correspond to similar declines in the predictedIs differences (Fig. 7). In the case of R-varying gratings, this is easily appreciated for all three afferent types (Fig. 7A–C). ForG-varying gratings, this is easier to discern for RAs (Fig.7E) and PCs (Fig. 7F) than for SAs (Fig.7D), although SAs also show the same trend. Therefore, roughness discrimination performance is well accounted for by the afferent responses modeled in Equation 3, buttressing the hypothesis that Ft, along with G, affects grating roughness.

Predicted differences between afferent firing rates (Is) to the standard grating and most commonly used comparison grating in the discrimination experiment. A–C,R-varying gratings: Is for standard (smoother) grating subtracted fromIs for comparison (rougher) grating, values shown for comparison grating with R = 1.3;D–F, G-varying gratings:Is for comparison (smoother) grating subtracted from Is for standard (rougher) grating, values shown for comparison grating with G= 1.82. SA, RA, and PC are as in Figure 4; CS, CF, andEFD are as in Figure 6. Note thatIs differences in the CF condition forR-varying gratings, which lie between −0.1 and 0, are too small to be discerned.
DISCUSSION
Because optimal tactile perception of roughness depends on movement (Meenes and Zigler, 1923; Krueger, 1970; Lederman and Klatzky, 1987; Hollins and Risner, 2000), the associated neural activation is distributed in both time and space. This makes it likely, a priori, that the nervous system uses both spatial and temporal stimulus variables to encode surface texture. Our findings, consistent with our hypothesis, demonstrate that temporal cues do indeed contribute to tactile texture perception. This enables rejection of the alternative hypothesis, that temporal variables are unimportant because they are filtered out neurally.
The two tasks we used are complementary. Magnitude estimation depends on observations that are subjective but unbiased by the experimenter. In the discrimination experiment, assessment was objective but roughness was experimenter defined. The results of both experiments converge on the conclusion that perceived roughness, like peripheral afferent responses, depends on G, a spatial variable, andFt, a temporal variable. Moreover, changes in perceived roughness resulting from varying stimulus parameters, over the range used, are completely predictable from corresponding changes in peripheral afferent response rates computed from Equation 3. The overall conclusions of the present study are not critically dependent on our choice of particular stimulus parameters for the following three reasons. First, the effects of G andR on roughness are fairly uniform over spatial periods ranging from 0.75 to 3 mm, with no apparent interaction effect (Sathian et al., 1989). Second, Goodwin et al. (1989) showed that Equation 2, from which Equation 3 derives, generalizes over a wide range of stimulus conditions (spatial periods of 0.75–3 mm and movement speeds 15–480 mm/sec). Third, peripheral afferent response rates are unaffected by the ratio G/R when this is varied explicitly (Sathian, 1987). Our study used precisely controlled, passive, linear motion, because it is easiest to study the effect ofFt under such conditions. However, the findings probably also apply to active movement, because roughness ratings are similar whether movement is active or passive (Lederman, 1981), and movement parameters are quite well controlled even during active tactile judgments of textures (Morley et al., 1983).
Roughness magnitude estimation
The present study establishes that roughness magnitude estimates of gratings depend in part on Ft. ForR-varying gratings, Ft was the principal determinant of roughness. In the case ofG-varying gratings, the large effect of Gdominated over the weaker effect ofFt. Roughness ratings were highly correlated with SA afferent response rates regardless of whetherR or G was varied. PC and RA afferent response rates correlated very well with roughness ratings when R was varied (and Ft determined roughness) but less well when G was varied.
Our study confirms the well known observation that G affects perceived roughness more powerfully than R (Lederman and Taylor, 1972; Sathian et al., 1989) and suggests that this is because of the relative strengths of the G andFt effects. The present study contradicts previous studies reporting that temporal factors are of no consequence for roughness magnitude estimates (Lederman, 1974; Lederman et al., 1982; Meftah and Chapman, 2000). One reason for this discrepancy is our inclusion of surfaces distinguished by changes in element width (R), which elicited the clearest temporal effects, whereas the earlier studies varied inter-element spacing (G or dot spacing). Although we found temporal effects even when G was varied, as did Kudoh (1988), the relatively weak influence of temporal variables was probably swamped by the much larger effect of spacing in other studies. Interestingly, roughness magnitude estimates are influenced more by changes in dot spacing when they are along rather than across the scanning direction (Connor and Johnson, 1992; Meftah and Chapman, 2000). This may be caused by temporal effects, because stimulus temporal frequency is affected when spacing varies along but not across scanning direction. Ascertaining whether this explanation is valid requires modeling the effect of frequency and spacing for dot patterns as Equation 3 does for gratings.
Roughness discrimination
The findings of this experiment verify thatFt plays a role in perceived grating roughness, in accord with its effects on afferent response rates. ForR-varying gratings this role is critical, whereas whenG varies, its effect tends to overwhelm that ofFt. The contribution of temporal factors that we found even during discrimination ofG-varying gratings is supported by the observation that eliminating spatial cues, thereby inducing reliance on temporal cues, can improve discrimination of fine gratings with highFt (Gamzu et al., 2000). Furthermore, discrimination of dot spacing is better when it varies along rather than across scanning direction (Lamb, 1983a), consistent with involvement of temporal factors and larger effects on roughness magnitude estimates in the scanning direction (see above).
Possible neural coding mechanisms
Our study indicates that temporal and spatial factors interact to evoke the percept of roughness. Although this study was not designed to distinguish between potential neural coding mechanisms, some interesting insights emerge.
Rate coding
One obvious candidate neural coding mechanism is peripheral afferent discharge rate. This measure encodes G andFt (Eq. 3). The present study reveals that both of these variables influence roughness in a manner that is predictable from afferent firing rates. Across the conditions that we studied, predicted SA afferent rates most consistently accounted for observed roughness judgments. RA and PC afferent response rates matched perceived roughness slightly better than SA rates in some conditions but relatively poorly in other conditions. Thus, on the basis of linear relationships between peripheral afferent rate and roughness ratings, SAs seem most likely among afferent types to mediate roughness perception. However, non-linear relationships were not examined, and it is not clear to what extent inputs from different classes of peripheral afferents stay separate within the CNS (DiCarlo et al., 1998), so that attributing a perceptual role to a specific afferent type is premature.
An argument against peripheral rate coding is that it is confounded by nonspecific changes, e.g., in contact force, that can be produced even by smooth surfaces. However, a concomitant temporal coding mechanism (see below) could remove such confounds. There is ample empirical support for rate coding. Grating roughness magnitude estimates correlate well with SA and RA afferent response rates, all of which increase with G and decrease with R under conditions of linear motion (Dorsch et al., 2000). This study is consistent with Equation 3 and our findings. Both peripheral (Sathian et al., 1989) and central (Sinclair and Burton, 1991a, 1993; Sinclair et al., 1991, 1996; Jiang et al., 1997; Pruett et al., 2000) somatosensory neurons increase their discharge rate with spacing, paralleling the rise in perceived roughness with spacing. Although afferent response rate did not vary consistently with R in a previous investigation (Sathian et al., 1989), except for PCs, this may have been caused by the use of sinusoidal motion, where the effect ofFt could be obscured as it varies continuously within a sweep. Finally, firing rates of RA and PC afferents (Lamb, 1983b) and primary somatosensory cortical neurons (Sinclair and Burton, 1991b) can account for the discriminability of periodic surfaces differing in spacing.
Spatial coding
The degree of response rate variation among spatially distributed members of the SA afferent pool correlates well with perceived roughness under various conditions (Connor et al., 1990; Connor and Johnson, 1992; Blake et al., 1997; Dorsch et al., 2000). In theory, such a spatial coding mechanism might be able to extract spatial information from confounding temporal factors and use this spatial information alone to compute roughness. Our findings definitively refute this possibility. However, such a population spatial code could well be sensitive to temporal, in addition to spatial, variables and thus encode roughness changes depending on either element spacing orFt. This has not been tested experimentally.
Temporal coding
Both primary somatosensory afferents (Darian-Smith and Oke, 1980;Morley and Goodwin, 1987; Goodwin et al., 1989) and central somatosensory neurons (Sinclair and Burton, 1991a; Sinclair et al., 1991, 1996) represent grating Ft in their firing patterns. Thus, the temporal variables important to roughness judgments may be represented explicitly through a temporal coding mechanism. Spatial variables might then be encoded independently by a temporally insensitive mechanism, e.g., the ratio of RA to PC afferent population response rates (Goodwin and Morley, 1987) or possibly the degree of spatial variation in the SA afferent pool (see above). As already pointed out, temporal coding could also complement a rate code. The relevance of temporal coding in the somatosensory system is underscored by the oscillatory behavior of certain somatosensory thalamic and cortical neurons (Ahissar et al., 1997, 2000). Cortical neurons convey precise temporal information about vibrotactile stimuli through a temporal code that is transformed into a rate code with hierarchical progression (Pons et al., 1987; Burton et al., 1990) from primary to secondary somatosensory cortex (Salinas et al., 2000). Because the temporal characteristics of peripheral neural responses to gratings and suprathreshold vibrotactile stimuli are similar (Goodwin et al., 1989), a transformation from temporal to rate coding could also operate for textured stimuli. Further neurophysiological investigation is necessary to understand how the temporal information used in tactile texture perception is encoded neurally, and whether one or more of the above mechanisms are important.
Footnotes
This work was supported by National Institutes of Health Grant R29-NS 34111. We thank Andy Register and Harold Engler of the Georgia Institute of Technology for designing and building the stimulator, Harold Engler for its maintenance, Dale Rice (Department of Neurology, Emory University) for machining support, and Hrishikesh Chakraborty (Department of Biostatistics, Emory University) for help with statistical analysis. We are indebted to Tony Goodwin for invaluable discussion and to Jim DiCarlo and Ken Johnson for helpful comments.
Correspondence should be addressed to Dr. K. Sathian, Department of Neurology, Emory University School of Medicine, WMRB-6000, Atlanta, GA 30322. E-mail: ksathia{at}emory.edu.


