

Abstract
Neurotrophin-3 (NT-3) promotes enteric neuronal developmentin vitro; nevertheless, an enteric nervous system (ENS) is present in mice lacking NT-3 or TrkC. We thus analyzed the physiological significance of NT-3 in ENS development. Subsets of neurons developing in vitro in response to NT-3 became NT-3 dependent; NT-3 withdrawal led to apoptosis, selectively in TrkC-expressing neurons. Antibodies to NT-3, which blocked the developmental response of enteric crest-derived cells to exogenous NT-3, did not inhibit neuronal development in cultures of isolated crest-derived cells but did so in mixed cultures of crest- and non-neural crest-derived cells; therefore, the endogenous NT-3 that supports enteric neuronal development is probably obtained from noncrest-derived mesenchymal cells. In mature animals, retrograde transport of 125I-NT-3, injected into the mucosa, labeled neurons in ganglia of the submucosal but not myenteric plexus; injections of 125I-NT-3 into myenteric ganglia, the tertiary plexus, and muscle, labeled neurons in underlying submucosal and distant myenteric ganglia. The labeling pattern suggests that NT-3-dependent submucosal neurons may be intrinsic primary afferent and/or secretomotor, whereas NT-3-dependent myenteric neurons innervate other myenteric ganglia and/or the longitudinal muscle. Myenteric neurons were increased in number and size in transgenic mice that overexpress NT-3 directed to myenteric ganglia by the promoter for dopamine β-hydroxylase. The numbers of neurons were regionally reduced in both plexuses in mice lacking NT-3 or TrkC. A neuropoietic cytokine (CNTF) interacted with NT-3 in vitro, and if applied sequentially, compensated for NT-3 withdrawal. These observations indicate that NT-3 is required for the normal development of the ENS.
- neurotrophins
- Trk C
- neural crest
- apoptosis
- retrograde transport
- transgenic mice
- gastrointestinal tract
- autonomic nervous system
The enteric nervous system (ENS) is a neural crest derivative (Yntema and Hammond, 1954, 1955; Le Douarin and Teillet, 1973, 1974). Although this origin is shared with extraenteric ganglia (Le Douarin and Kalcheim, 1999), the ENS is structurally and functionally unique (Furness and Costa, 1987; Gershon et al., 1994; Gershon, 1998b; Furness, 2000). The mature ENS contains intrinsic primary afferent neurons (IPANs) (Kirchgessner et al., 1992,1996; Kunze et al., 1995; Furness et al., 1998; Kunze and Furness, 1999) and microcircuits that allow it to regulate enteric motile and secretory behavior (Trendelenburg, 1917; Cooke, 1989; Cooke et al., 1997, 1999; Pan and Gershon, 2000). No other peripheral ganglia function independently of CNS control. The developmental mechanisms responsible for the unique structure and function of the ENS are not understood.
The crest-derived cell population that colonizes the bowel is multipotent (Rothman et al., 1990, 1993; Sextier-Sainte-Claire Deville et al., 1994; Lo and Anderson, 1995; Lo et al., 1997); therefore, not only cell lineages (Blaugrund et al., 1996; Gershon, 1997), but also the enteric microenvironment, play critical roles in determining the fates of crest-derived cells differentiating within the gut. Microenvironmental factors that influence the development of enteric neurons and/or glia include glial cell line-derived neurotrophic factor (GDNF) (Schuchardt et al., 1994; Moore et al., 1996; Pichel et al., 1996; Sánchez et al., 1996; Cacalano et al., 1998; Chalazonitis et al., 1998b; Hearn et al., 1998; Heuckeroth et al., 1998), neurturin (Heuckeroth et al., 1999), neurotrophin-3 (NT-3) (Chalazonitis et al., 1994), a still-to-be-identified neuropoietic cytokine that binds to the α component of the ciliary neurotrophic factor (CNTF) receptor (Chalazonitis et al., 1998a) [which may be the newly discovered CNTFII (Elson et al., 2000; Lesser and Lo, 2000)], endothelin-3 (Baynash et al., 1994; Hearn et al., 1998; Wu et al., 1999), serotonin (5-HT) (Fiorica-Howells et al., 2000), and laminin-1 (Chalazonitis et al., 1997). The timing, sequence, and combinations of growth–differentiation factors to which precursor cells are exposed all affect the responses of enteric neural and glial progenitors (Chalazonitis et al., 1998b; Gershon, 1998a).
The physiological significance of the promotion by NT-3 of enteric neuronal–glial development has not yet been established. An ENS is present in mice that lack NT-3 (Fariñas et al., 1994;Tessarollo et al., 1994), TrkC (Klein et al., 1994), or p75NTR (Lee et al., 1992). At least some enteric neurons can thus develop and survive independently of NT-3; however, defects in specific subsets of neurons would not be obvious in the histological appearance of the ENS. The survival of mice that lack NT-3 or TrkC, moreover, is brief; therefore, the motility and/or secretion of their gastrointestinal tracts may be abnormal. NT-3 and other neurotrophins are known to be survival factors for some but not all neurons (Chalazonitis, 1996; Lewin and Barde, 1996). The current study was thus designed to test the hypotheses that NT-3 is a survival factor for subsets of enteric neurons and that, after exposure to NT-3, these subsets become NT-3 dependent.
In vitro studies were performed with enteric neurons immunoselected from the developing rat gut. In vivoobservations were made with transgenic mice that overexpress NT-3 and also with animals that lack either NT-3 or TrkC. Retrograde transport of NT-3 was studied in the adult bowel because this property correlates with target-derived neurotrophic dependency (DiStefano et al., 1992). Because the effects of CNTF and NT-3 have been found previously to be interactive (Chalazonitis et al., 1998a), the abilities of these factors to influence the effect of the other on survival were also investigated.
In vitro observations supported the idea that NT-3 is a target-derived neurotrophic factor on which enteric neurons become dependent. Studies with transgenic mice, which overexpress NT-3 in the developing ENS, confirmed that NT-3 promotes enteric neuronal development in vivo; moreover, experiments with NT-3- and TrkC-deficient mice revealed the presence and regional distribution of subsets of neurons in both enteric plexuses that are NT-3 dependent. Retrograde transport of NT-3 was demonstrated in mature enteric ganglia, suggesting that NT-3 continues to function in the adult ENS, perhaps in the maintenance of neurons that become NT-3 dependent during development. Although CNTF can replace NT-3 and support NT-3-dependent enteric neurons, NT-3 dependency is exacerbated when precursors are simultaneously exposed to CNTF and NT-3. We conclude that NT-3 plays a subtle but critical role during ENS development and adulthood.
Parts of this work have been published in abstract form (Pham et al., 1996, 1999).
MATERIALS AND METHODS
Animals. Fetal rats were obtained from timed pregnant dams (Harlan Sprague Dawley, Charles River, MA). The day at which a vaginal plug was found was designated as day 0 of gestation. Maternal rats were anesthetized with CO2 and killed by a thoracotomy at day 14 of gestation. The fetal bowel was dissected aseptically from 25–30 fetuses for each experiment involving tissue culture. Adult rats of either sex, which were used for the study of the retrograde transport of NT-3, were anesthetized with Metofane and exsanguinated by decapitation. The Animal Care and Use Committee of Columbia University approved all procedures.
Mice that overexpress NT-3 in the ENS were generated in a C57BL/6 genetic background by pronuclear injection of a plasmid containing sequentially a 5.8 kb fragment of the human dopamine-β-hydroxylase (DBH) gene promoter (Mercer et al., 1991), a 0.15 kb fragment comprising intron A of the human insulin gene, a 0.96 kb fragment containing the complete translated sequence of a human NT-3 cDNA, and a 0.27 kb fragment of a mouse protamine I cDNA 3′ UTR, containing the polyadenylation sequence. The line used for these studies contained 5–10 tandemly integrated copies of the transgene. The DBH promoter has been shown to direct expression of transgenes to the neural crest-derived cells that colonize the gut (Kapur et al., 1991, 1992;Rice et al., 2000). Transgene expression begins when the crest-derived cells enter the bowel and is maintained throughout development. The ENS was analyzed in comparable regions of the proximal intestines of five transgenic mice and five wild-type littermates.
Mice carrying targeted deletions of genes encoding NT-3 (Tessarollo et al., 1994) or TrkC (Tessarollo et al., 1997) were derived in a mixed 129/Sv-C57BL/6 genetic background and subsequently backcrossed for 10 generations into a C57BL/6 background. The guts of wild-type, heterozygote, and mutants were removed and processed for determining the total numbers of neurons in the enteric plexuses and for the immunocytochemical identification of classes of enteric neurons (see below). Comparisons were made in corresponding regions of the bowel between wild-type, heterozygotes, and homozygotes animals of the same strains. Analyses were made on six wild-type, four TrkC +/−, four TrkC −/−, three NT-3 +/−, and two NT-3 −/− mice [ranging in age from postnatal day 0 (P0) to P22].
Immunoselection. Crest- and noncrest-derived cells were isolated from dissociated fetal bowel by a process of positive and negative immunoselection with antibodies to human natural killer cell antigen HNK-1 (Erickson et al., 1989; Pomeranz et al., 1993;Chalazonitis et al., 1994) or p75NTR(Baetge et al., 1990a; Chalazonitis et al., 1997, 1998a,b) as described previously. HNK-1 antibodies were derived from cells purchased from American Type Culture Collection (Rockville, MD). Antibodies to p75NTR (clone IgG192) were donated by Regeneron Pharmaceuticals (Tarrytown, NY). Magnetic beads coated with species-specific secondary antibodies that were used for immunoselection were obtained from Miltenyi Biotec Inc. (Mt. Auburn, CA). In some experiments, which were designed to study whether noncrest-derived cells are a source of endogenous NT-3 that affects the in vitro development of enteric neurons, mixed cultures of dissociated cells from the fetal bowel were investigated without previous separation by immunoselection.
Tissue culture. Cells were plated in tissue culture dishes that had been coated previously with rat tail collagen and mouse laminin (10 μg/ml) and cultured in a defined medium (Ziller et al., 1983) as described previously (Chalazonitis et al., 1994). The plating density was 2.75 × 10⁵cells/35-mm-diameter tissue culture dish (catalog #3001; Becton Dickinson, Franklin Lakes, NJ) or 1.2 × 10⁵ cells/20 mm2 chamber slide (catalog #177429; Nunc, Naperville, IL). Cultures of each type were maintained in triplicate. NT-3 was always applied at a concentration found previously to be supramaximal (40 ng/ml) (Chalazonitis et al., 1994). CNTF was also applied at a concentration (10 ng/ml) at which it is known to be supramaximal (Chalazonitis et al., 1998a). Both NT-3 and CNTF were supplied by Regeneron. A blocking antibody to NT-3 (Gaese et al., 1994) was supplied by Dr. Ilse Bartke (Boehringer Mannheim, Pinsberg, Germany). Controls consisted of equivalent cultures exposed to the vehicle in which the growth factors were dissolved (basic Brazeau medium containing 0.5% BSA). Experiments were terminated by fixing cultures with 4% formaldehyde (freshly prepared from paraformaldehyde) in 0.1 m PBS.
Immunocytochemistry in cultures. Fixed cultures were permeabilized by incubation with 0.1 m PBS containing 0.1% Triton X-100 (Sigma, St. Louis, MO). Primary antibodies were applied overnight at room temperature as described previously (Chalazonitis et al., 1994, 1997, 1998a). Three reagents were used to identify neurons: (1) polyclonal antibodies to the intermediate neurofilament protein peripherin (diluted at 1:750; gift of Dr. Lloyd Greene, Department of Pathology, Columbia University) (Portier et al., 1984; Aletta et al., 1988), (2) a mixture of monoclonal antibodies to the 68, 160, and 200 kDa components of the neurofilament triplet (each diluted 1:100; Sigma), and (3) polyclonal antibodies to rat neuron-specific enolase (NSE) (diluted 1:1000; Polysciences, Warrington, PA). Neurons that could be NT-3 responsive were identified with polyclonal antibodies to TrkC (diluted 1:100; gift of Dr. B. Hempstead, Cornell Medical College, New York, NY). These antibodies were raised against a peptide (amino acids 639–653) in the cytoplasmic domain of rat TrkC. The antibodies react with isoforms of TrkC that contain an active kinase but not with TrkB or TrkA (Donovan et al., 1996). Preimmune sera (diluted 1:100) were used as a control for the antibodies to TrkC. Sites in which primary antibodies were bound were localized with affinity-purified species-specific secondary antibodies, including biotinylated goat anti-rabbit or anti-mouse IgG. The secondary antibodies were visualized with avidin coupled to HRP (ABC Elite kit; Vector Laboratories, Burlingame, CA) or alkaline phosphatase (Vectastain SK#5300; Vector Laboratories). After rinsing, the cultures were exposed to reagents to visualize the sites of immunoreactivity with either alkaline phosphatase or with peroxidase diaminobenzidine (Vectastain SK#4100) according to the procedure of the manufacturer and as described previously (Chalazonitis et al., 1994, 1997, 1998a,b).
Immunocytochemistry in situ. Freshly removed bowel was opened, flattened, and pinned to a wax support. The tissue was then fixed with 4% formaldehyde (from paraformaldehyde) in saline buffered with 0.1 m sodium phosphate to pH 7.4. The gut was then mechanically dissected into layers to obtain laminar preparations of the submucosa (containing the submucosal plexus) and the muscularis externa with adherent myenteric plexus. The laminar preparations were then rinsed and stained or immunostained as whole mounts. To count the total number of neurons, preparations were stained for 1 hr at 37°C with cuprolinic blue (0.5% in 0.05m sodium acetate buffer, pH 5.6, containing 1.0m MgCl2). This reagent, in the presence of Mg2+ ions, selectively demonstrates single-stranded RNA and thus enables the entire set of enteric neurons, which are rich in ribosomes, to be visualized without interference from the relatively ribosome-poor surrounding cells (Heinicke et al., 1987; Holst and Powley, 1995; Karaosmanoglu et al., 1996). All preparations were treated for 10 min with H2O2 (0.3%) in PBS, washed again with PBS, and blocked for 30 min with 4% goat serum in PBS containing 0.3% Triton X-100. Primary antibodies, listed in Table1, were then applied (diluted in blocking solution) to the sections for 72 hr at 4°C. Sites of antibody binding were detected with goat anti-rabbit antibodies coupled to horseradish peroxidase (Kirkegaard & Perry, Gaithersburg, MD). Peroxidase activity was visualized with H2O2and 3,3′-diaminobenzidene (DAB) with or without nickel intensification.
Antibodies used to identify enteric neurons in whole mounts
Identification of apoptotic, dying, or dead cells. The terminal deoxynucleotidyl transferase (TdT)-mediated biotinylated UTP nick end labeling (TUNEL) method was used to identify apoptotic cells (TACS kit, used according to the directions of the manufacturer; Trevigen Inc., Gaithersburg, MD). This method uses TdT and biotinylated nucleotides to label the 3′ hydroxyl groups of cleaved DNA. Briefly, the cultures were permeabilized with saponin, and endogenous peroxidase was blocked with periodic acid. The TdT-catalyzed incorporation of biotinylated nucleotides into cleaved DNA was performed in the presence of Mn2+, which is optimal for the TUNEL method in neuronal systems. Incorporated biotinylated nucleotides were visualized by using streptavidin conjugated to HRP (Vectastain #SK4100).
Dying and dead cells were identified using an ethidium homodimer (Live/Dead; Molecular Probes, Eugene, OR). This reagent binds to DNA but does not permeate the plasma membranes of living cells. Once cells begin to die, their plasma membrane becomes compromised and permeant to the ethidium homodimer, which then stains the nuclei of the dying or dead cells. Briefly, cultures were rinsed with a Ca2+-, Mg2+-free buffer and then incubated in the same buffer with the ethidium homodimer (6 μm) for 1 hr. After this incubation, cultures were washed and fixed with 4% formaldehyde (from paraformaldehyde) for the immunocytochemical identification of neurons.
Axonal transport of NT-3. NT-3 was iodinated as described previously (DiStefano et al., 1992). The specific activities of radioactive 125I-NT-3 ranged from 2458 to 3834 cpm/fmol. The bioactivity of the125I-NT-3 was 90–99% compared with nonlabeled NT-3, as determined by neurite outgrowth in chicken dorsal root ganglion explants (DiStefano et al., 1992). Loops of adult rat small intestine were removed from the animals and immediately immersed in oxygenated Krebs' solution at room temperature. The lumen of the intestine was then thoroughly purged with Krebs' solution, and the bowel was transferred to iced Krebs' solution. Intestinal segments (50 mm in length) were opened along the mesenteric border and pinned flat as open rectangles on a substrate of silicone elastomer (Sylgard; Dow Corning, Midland, MI). When injections were to be made into the mucosa, the preparations were pinned out with the mucosal surface facing up. When injections were to be made into myenteric ganglia, the preparations were pinned out with the serosal surface facing up. The immobilized preparations were continuously superfused at 10–15 ml/min with oxygenated Krebs' solution at 37°C, except during injections. Injections were performed with beveled glass micropipettes with a tip size of 8–12 μm. Pipettes were positioned with a Narishige (Tokyo, Japan) micromanipulator under microscopic control using differential interference contrast optics to allow the boundary between the epithelium and the lamina propria to be visualized in mucosal preparations and myenteric ganglia to be visualized in the muscularis externa. 125I-NT-3 (40 ng/ml in 0.5%BSA and PBS) was injected into either the mucosa (lamina propria) or individual ganglia of the myenteric plexus (see Fig.12A,C,D). Solutions were ejected from the micropipettes with pressure pulses (9–12 psi; pulse duration, 0.2–1 sec) delivered by a multichannel Picospritzer (General Valve, Fairfield, NJ). A retrograde fluorescent tracer, Fluoro-Gold (4%; Fluorochrome Inc. Englewood, CO), or the β subunit of cholera toxin (β-CTx) conjugated to fluorescein isothiocyanate (FITC) (1%;List Biologic, Campbell, CA) was coinjected with125I-NT-3. These tracers were used to identify the full set of neurons that extended axonal projections to the injection site. Only a subset of such neurons would be expected to take up 125I-NT-3 and display retrograde labeling of nerve cell bodies. Neurons were thus considered to be labeled by the retrograde transport of125I-NT-3 if they were double labeled by125I-NT-3 and Fluoro-Gold or β-CTx. Specificity of transport was determined by coinjecting a 40- to 260-fold excess of nonlabeled NT-3, NGF, or BDNF with125I-NT-3. Retrograde transport of125I-NT-3 was considered to be specific if it was blocked by NT-3 but not by NGF or BDNF. After injections, the tissue was transferred to a sterile vial and incubated overnight at 37°C in 10 ml of Eagle's MEM (Life Technologies, Gaithersburg, MD), supplemented with HEPES buffer (15 mm) and penicillin–streptomycin (1%) to allow time for retrograde axonal transport.
After overnight culture, the segments of bowel were again pinned flat and fixed with freshly prepared 4% formaldehyde (from paraformaldehyde) in 0.1 m phosphate buffer, pH 7.4, for 4 hr at room temperature or overnight at 4°C. The gut was then dissected into laminar preparations of mucosa–submucosa, and the longitudinal smooth muscle with adherent myenteric plexus and tissues were permeabilized with 1.0% Triton X-100. β-CTx was demonstrated by immunocytochemistry [rabbit primary antibodies, diluted 1:500 (List Biologic); FITC-labeled goat anti-rabbit secondary antibodies). Fluoro-Gold was localized by virtue of its native fluorescence.
To locate 125I-NT-3 in tissues, preparations were mounted onto glass slides coated with chromium–alum gelatin (0.5 gm/l). Tissues were then dehydrated by passage through a graded series of ethanols to diethyl ether and air dried. A thin film of carbon was evaporated (with a Denton evaporator) over the slides to prevent nonspecific chemographic artifactual labeling (Gershon and Sherman, 1987). The slides were coated with nuclear track emulsion [Ilford L4 or Kodak NTB-2 (Eastman Kodak, Rochester, NY), diluted 1:1 with distilled H2O]. The emulsion-coated slides were exposed for 3–4 weeks in a light-tight box under an atmosphere of dry CO2, developed [Kodak D-19 developer (Eastman Kodak) for 5 min], and fixed. After an aqueous wash, the preparations were dehydrated with ethanol, cleared in xylene, and coverslipped in a nonfluorescent mounting medium.
Statistical analyses. Total cells and cells in cultures that were specifically identified with reagents described above were counted as described previously (Chalazonitis et al., 1994, 1997, 1998b). The numbers of cells were normalized by expression as a percentage of cells found in cultures treated with vehicle or as a percentage of cells found in cultures treated for 1 week with NT-3. When the ENS was examined in situ, the neuronal density as a function of area (in square millimeters) was quantified by taking as a measurement the mean of the pooled counts of neurons in 10 fields covering 1.254 mm2. The numbers of such measurements ranged from 4 to 32 per gut. Artifactually damaged tissue was not examined. Means were compared by ANOVA (STATVIEW 4.1 program for the Macintosh computer; SAS Institute, Cary, NC).
RESULTS
A subset of neurons that develop in response to NT-3 becomes NT-3 dependent
Crest-derived cells were immunoselected with antibodies to p75NTR and cultured for 7 d. We have shown previously that, under these conditions, NT-3 promotes the development of enteric neurons (Chalazonitis et al., 1994). To determine whether the neurons that are induced to develop in the presence of NT-3 become dependent on it for survival, we exposed crest-derived cells to NT-3 and investigated the effects of NT-3 withdrawal. In one set of these cultures of isolated crest-derived cells, NT-3 was present for the full 7 d. In a second set, NT-3 was withdrawn for the final 2 d of the 7 d culture period. The ethidium homodimer was added to the medium of both sets of cultures for 1 hr to label cells in each that were dead or dying. Both sets of cultures were then fixed and immunostained with antibodies to NSE to identify postmitotic neurons (Schmechel et al., 1980; Maxwell et al., 1982; Baetge et al., 1990b). For each culture, the total number of cells, the number of neurons, and the number of dying or dead cells were determined (Fig.1A). Substantially fewer neurons were present in the cultures from which NT-3 was withdrawn; however, the withdrawal of NT-3 was not accompanied by a significant change in either the total number of cells or the number of cells that were dying or dead. A larger number of neurons might have been present in the cultures when NT-3 was present for 7 rather than 5 d of culture because the continued presence of NT-3 promoted the development of neurons during the final 2 d of the culture period. Alternatively, cells that develop in response to NT-3 might have become NT-3 dependent and died when NT-3 was withdrawn. Because the numbers of total cells and those that were dying or dead did not change significantly after NT-3 withdrawal, cell death, if it occurs as a result of NT-3 deprivation, would have to take place in only a limited subset of the crest-derived cells in the cultures.

Withdrawal of NT-3 causes neurons to be lost from cultures of enteric crest-derived cells. A, The total number of cells, neurons, and dying or dead cells were determined in cultures grown for 7 d, in either the continuous presence of NT-3 or for 5 d with NT-3 followed by a 2 d period during which NT-3 was withdrawn. Neurons were identified by using NSE immunoreactivity as a marker. Dying or dead cells were identified by using uptake of an ethidium homodimer as a marker. The number of neurons present in the cultures from which NT-3 was withdrawn for 48 hr was significantly less than that in the cultures that were continuously exposed to NT-3 for 7 d. In contrast, the withdrawal of NT-3 did not lead to a significant reduction in the total number of cells present after 7 d in vitro, nor did it lead to a significant increase in the number of dying or dead cells.B, The numbers of cells committed to a neuronal lineage were counted in cultures exposed continuously to NT-3 for 8 d, for 5 d, or for 5 d followed by a 3 d period during which NT-3 was withdrawn. Peripherin immunoreactivity was used to identify cells committed to a neuronal lineage. The number of neural cells present in the cultures after 5 d of exposure to NT-3 did not differ significantly from that present at 8 d; however, significantly fewer neural cells remained in the cultures at 8 d when NT-3 was withdrawn for the final 72 hr in vitro.n.s., Not significant.
To determine whether the loss of a subset of cells accounts for the decrement in neuron numbers that followed the withdrawal of NT-3, crest-derived cells were again immunoselected with antibodies to p75NTR and plated in three sets of cultures. One set of cultures was maintained in the presence of NT-3 for 5 d. A second set was maintained, also in the presence of NT-3, but for 8 d. The third set of cultures was maintained for 8 d, but NT-3 was present only for the first 5 d in vitro and was withdrawn for the final 3 d of the culture period. Peripherin immunoreactivity was used as a neuronal marker to include precursors committed to the neuronal lineage, as well as terminally differentiated neurons (the proportion of cells that are peripherin-immunoreactive is approximately two times that of the NSE-immunoreactive cell population). The number of neurons developing in each of the three sets of cultures was determined; data were normalized to the number of neurons developing in the cultures exposed to NT-3 for 8 d (9.1 ± 1.4 × 10⁴ neurons per dish) (Fig.1B). The number of neurons present in the cultures exposed to NT-3 for 5 d was virtually identical to that exposed to NT-3 for 8 d (Fig. 1B). In contrast, when NT-3 was withdrawn from the cultures after 5 d of exposure, the number of neurons present at 8 d was now significantly less than that found in the cultures that were continuously exposed to NT-3 for 8 d (Fig. 1). These observations suggest that the withdrawal of NT-3 for the final 3 d in vitro caused some of the neurons that had developed after 5 d in the presence of NT-3 to be lost.
NT-3 withdrawal leads to apoptosis of a subset of cells that express TrkC
Experiments were performed to determine whether the loss of neurons associated with NT-3 withdrawal was attributable to apoptosis of a subset of neurons that develop in response to NT-3. TrkC immunoreactivity (Donovan et al., 1996) was used as a marker for NT-3-responsive cells, and the TUNEL method was used to identify cells committed to apoptosis. Crest-derived cells, immunoselected with antibodies to p75NTR, were cultured in the absence or presence of NT-3. The cultures that were not exposed to NT-3 were maintained for 5.75 d. All of the cultures that were exposed to NT-3 were grown in its presence for a minimum of 5 d; the NT-3-exposed cultures were then maintained for an additional 18 or 48 hr in the absence or presence of NT-3. Eighteen hours is the earliest time that apoptosis can be detected after withdrawal of a growth factor from sympathetic neurons (Edwards and Tolkovsky, 1994). The design of the experiments, therefore, permitted the effects of NT-3 on the number of TrkC-immunoreactive cells developing in vitro, as well as the effects of NT-3 withdrawal on this cell population, to be ascertained.
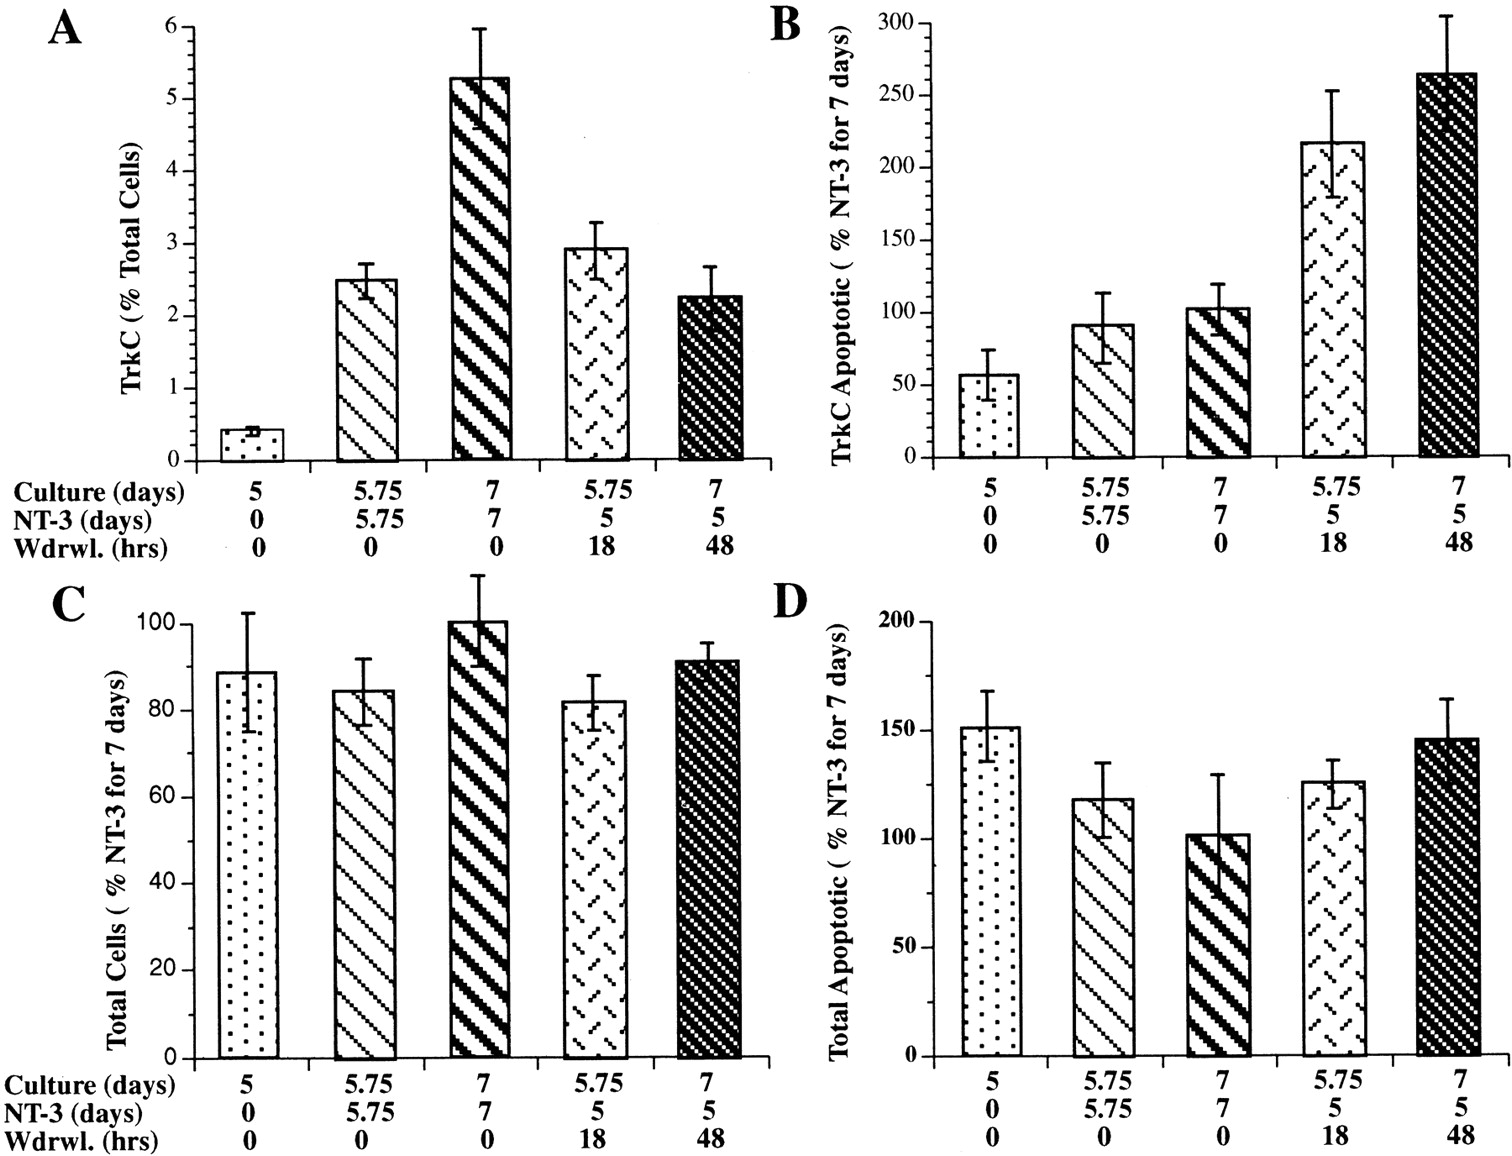
After 7 d of growth in the presence of NT-3, the TrkC-immunoreactive cells were all found to be neurons (Fig.2). Both nerve cell bodies and thin neurites displayed TrkC immunoreactivity. The TrkC-immunoreactive cells represented 5.2 ± 0.7% of the total cell population. This proportion was ∼90% of the total number of cells demonstrated with NSE immunoreactivity (a marker for mature neurons) and 45% of the larger population of neuronally committed cells that is demonstrated with peripherin immunoreactivity. The number of TrkC-immunoreactive neurons increased significantly (p < 0.0001) between days 5 and 7 of culture in the continued presence of NT-3 (Fig.3A). The development of neurons that expressed TrkC was found to depend on NT-3; very few TrkC-immunoreactive cells were present in cultures grown in its absence (Fig. 3A). The number of cells that expressed TrkC was very sensitive to the presence of NT-3 and decreased significantly (p < 0.0001) when NT-3 was withdrawn for 48 hr (Fig. 3A). The withdrawal of NT-3, moreover, dramatically increased apoptosis in the subset of cells that expressed TrkC (Figs.3B, 4). This increase was quantified by counting the cells that were double labeled with antibodies to TrkC and by the TUNEL method. The brown nuclear reaction product indicative of apoptosis was readily distinguished from the blue alkaline phosphatase reaction product used to visualize TrkC immunoreactivity, which was cytoplasmic (Fig. 4). The increase in apoptosis of TrkC-expressing cells was evident as soon as 18 hr of withdrawal (p < 0.006) and persisted through 48 hr (p < 0.002). The withdrawal of NT-3, however, did not significantly alter the total number of cells in the cultures (Fig. 3C), nor did it increase the proportion of the total cell population in which apoptosis was detected (Fig.3D). These data suggest that the population of neurons that undergoes apoptosis when NT-3 is withdrawn is a subset of the TrkC-immunoreactive cell population and is small relative to the total number of cells in the cultures and the background occurrence of apoptosis.

TrkC immunoreactivity in cultures of crest-derived cells immunoselected from the E14 fetal rat gut with antibodies to p75NTR. The cultures were grown for 7 d in the continuous presence of NT-3. The TrkC-immunoreactive cells were all process bearing with the morphology of neurons. Both perikarya (arrows) and neurites (arrowheads) were immunostained by the antibodies to TrkC. A, Individual TrkC-immunoreactive cells can be seen, apparently randomly scattered in the culture. The cells are interconnected by TrkC-immunoreactive processes. B,C, TrkC-immunoreactive cells also form small aggregates, approximating the appearance of mini-ganglia. D, No immunostaining is seen in an analogous culture that was treated with preimmune sera instead of the antibodies to TrkC; nevertheless, non-immunoreactive clusters of neurons (arrow) and processes (arrowhead) can be discerned in the field of view. Scale bars, 50 μm.

The in vitro development of TrkC-immunoreactive cells is NT-3 dependent, and TrkC-immunoreactive cells selectively undergo apoptosis when NT-3 is withdrawn. Cultures were grown in the absence or presence of NT-3 for 5–7 d as indicated in the graphs. The effects of NT-3 withdrawal for 18 or 48 hr were also ascertained. For each panel, the number of days in culture, the duration of continuous exposure to NT-3, and the times of NT-3 withdrawal are indicated below the correspondingcolumns. A, The proportion of TrkC-immunoreactive cells (as a percentage of the total number of cells per culture) in cultures exposed to NT-3 was significantly greater than that found in cultures grown in the absence of NT-3 (p < 0.02, vehicle vs NT-3 for 5.75 d;p < 0.0001, vehicle vs NT-3 for 7 d). The proportion of TrkC-immunoreactive cells also increased significantly between 5.75 and 7 d of culture in the presence of NT-3 (p < 0.0001). The number of TrkC-immunoreactive cells present after 5.75 d in the presence of NT-3 did not change significantly when NT-3 was withdrawn for 18 hr; however, the number of TrkC-immunoreactive cells in cultures from which NT-3 was withdrawn for the final 48 hr of a 7 d culture period was significantly less than that found in corresponding cultures exposed continuously to NT-3 for 7 d (p< 0.0001). B, The proportion of TrkC-immunoreactive cells undergoing apoptosis, evaluated by the TUNEL method, was not significantly different in cultures that were not exposed to NT-3 or that were exposed to NT-3 for 5.75 or 7 d. In contrast, the withdrawal of NT-3 for 18 hr (p < 0.006, vs NT-3 for 5.75 d) or 48 hr (p < 0.002, vs NT-3 for 7 d) significantly increased the proportion of TrkC-immunoreactive cells undergoing apoptosis. C, The total number of cells in cultures was not significantly affected by the presence of NT-3 or by its withdrawal. D, The proportion of the total cell population undergoing apoptosis was not significantly affected by the presence or withdrawal of NT-3.

Apoptosis in TrkC-immunoreactive cells was identified by visualizing cells double labeled with antibodies to TrkC and the TUNEL method. Crest-derived cells were immunoselected from the E14 fetal rat gut with antibodies to p75NTR.A, Cells were cultured in the presence of NT-3 for 5.75 d. The blue alkaline phosphatase reaction product indicates the presence of TrkC immunoreactivity (red arrows).B, C, Cells were cultured in the presence of NT-3 for 5 d, but NT-3 was withdrawn for the final 18 hr of the 5.75 d culture period. The brown DAB reaction product in the nuclei (violet arrows) identify cells demonstrated by the TUNEL method to contain fragmented DNA and thus to be undergoing apoptosis. The TrkC-immunoreactive cell undergoing apoptosis, which is illustrated in C, is magnified in theinset to help enable the blue and brown reaction products to be distinguished. Note the neuritic processes extended by TrkC-immunoreactive cells. Scale bars, 25 μm.
Antibodies to NT-3 antagonize the in vitro promotion of enteric neuronal development by exogenous NT-3 (determination of the neutralizing concentration)
The ability of anti-NT-3 to block the NT-3-induced increment in the in vitro development of enteric neurons was studied to determine whether anti-NT-3 could be used to investigate the physiological role(s) played by endogenous NT-3. Crest-derived cells were immunoselected from the fetal rat gut with antibodies to p75NTR and cultured for 4 d in defined medium with NT-3 (10 ng/ml) in the absence or presence of anti-NT-3 (0.4–100 μg/ml). The concentration of anti-NT-3 able to completely neutralize the action of exogenous NT-3 was thus determined. Control cultures were maintained for 4 d in the presence of only vehicle or anti-NT-3 (55–100 μg/ml). The latter conditions were used to determine whether anti-NT-3 itself affects the in vitrodevelopment of enteric neurons. Peripherin immunoreactivity was used to identify cells committed to a neuronal lineage. The addition of as little as 2 μg/ml of anti-NT-3 to cultures grown in the presence of NT-3 significantly decreased the proportion of neural cells in the cultures (Fig. 5A). The action of NT-3 was maximally inhibited by ∼40 μg/ml of anti-NT-3; at this concentration, the development of neurons was reduced to that seen in cultures maintained in the absence of NT-3. Addition of supramaximal concentrations (55 or 100 μg/ml) of anti-NT-3 by itself to cultures did not reduce the number of peripherin-immunoreactive cells below that found in cultures exposed only to vehicle (Fig. 5B). Thus, anti-NT-3 does not itself appear to be neurotoxic or to prevent neuronal development. Its ability to antagonize the promotion of enteric neuronal development by NT-3, therefore, is probably attributable to the neutralization of NT-3.
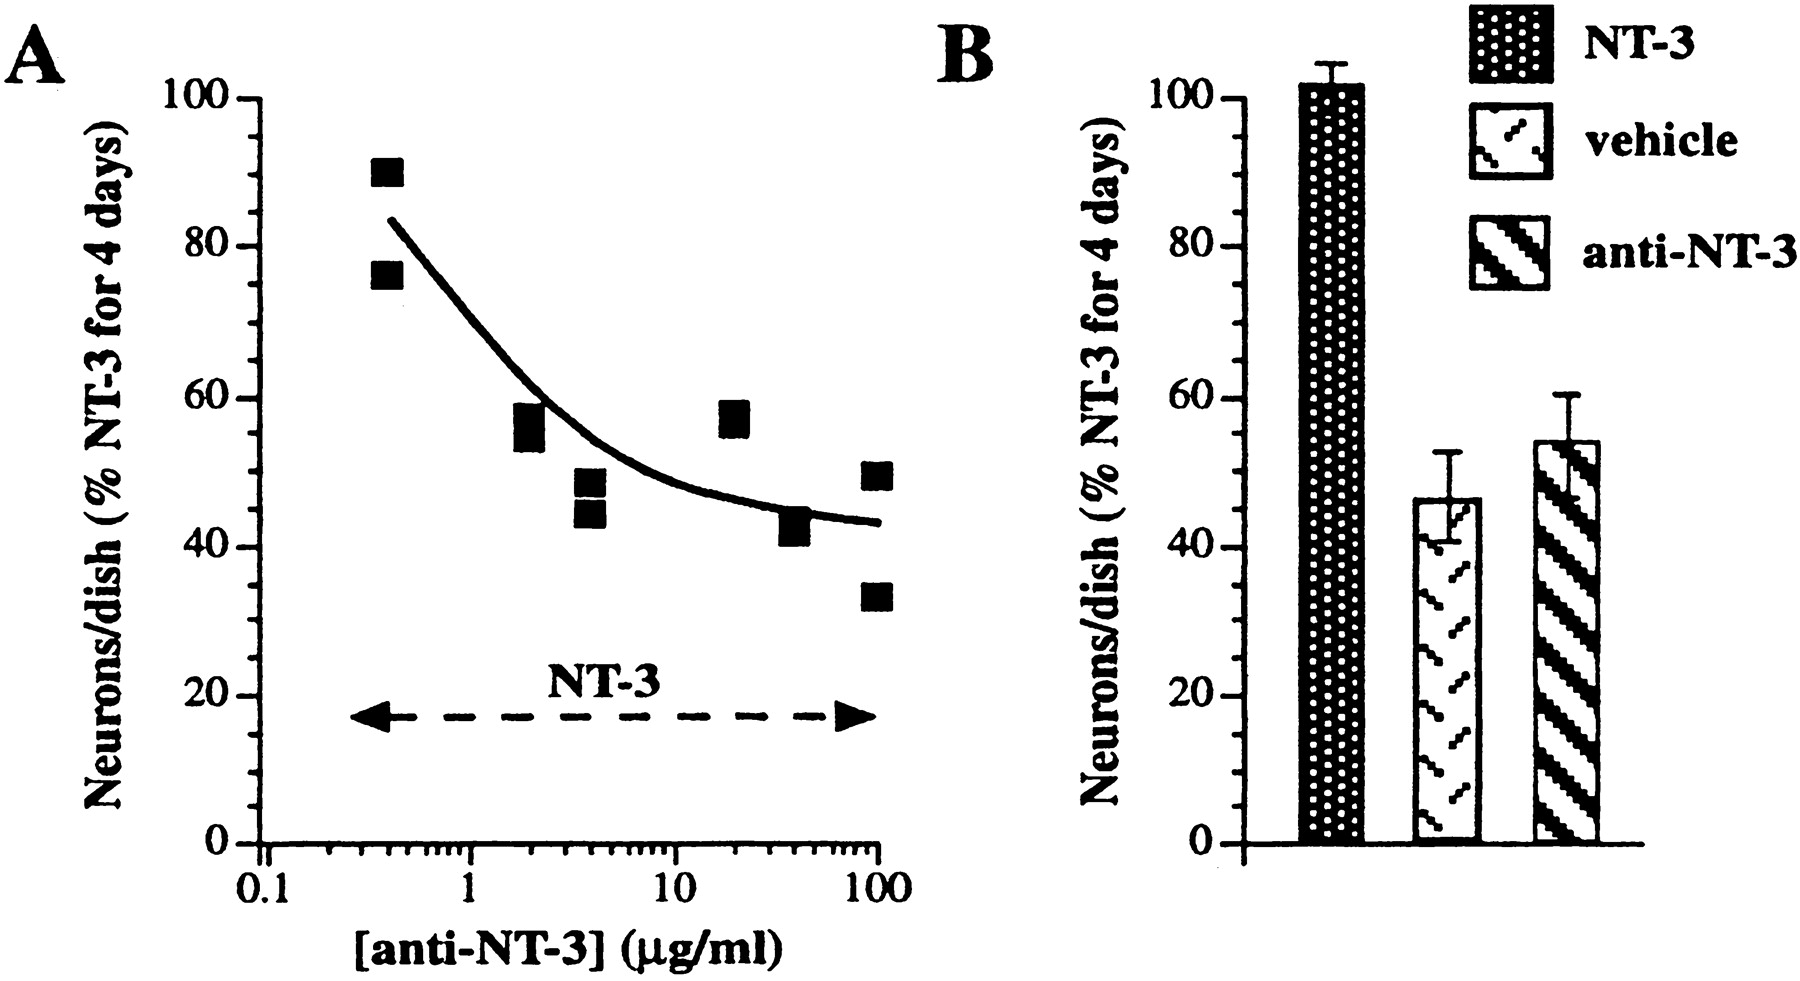
Antagonism by anti-NT-3 of the ability of exogenous NT-3 to promote the in vitro development of enteric neurons from isolated precursors. Crest-derived cells were immunoselected from the E14 fetal rat gut with antibodies to p75NTR. A, The immunoselected cells were cultured for 4 d in the presence of NT-3 (10 ng/ml) and increasing concentrations of anti-NT-3. The number of cells demonstrated by peripherin immunoreactivity to be in a neuronal lineage was counted and normalized to that developing in the presence of NT-3 alone. The NT-3-promoted development of neural cells is inhibited in a concentration-dependent manner by anti-NT-3. At concentrations of anti-NT-3 of 40 μg/ml, the number of peripherin-immunoreactive cells is reduced to the level that develops in the presence only of vehicle (compare with B). B, In the absence of anti-NT-3, more peripherin-immunoreactive cells develop in the presence of NT-3 (10 ng/ml) than in the presence of vehicle. The addition of anti-NT-3 (55 and 100 μg/ml; pooled data) did not reduce the number of peripherin-immunoreactive cells below the number seen in cultures exposed only to vehicle.
The enteric mesenchyme promotes the development of enteric neurons via NT-3
Anti-NT-3 was used to test the hypothesis that NT-3 secreted by non-neuronal cells of the enteric mesenchyme promotes the development of neurons from enteric crest-derived cells. Previous experiments have demonstrated that exogenous NT-3 is able to promote enteric neuronal development in vitro (Chalazonitis et al., 1994) (also described above). In those studies, NT-3 was added to crest-derived cells that were isolated by immunoselection from their non-neuronal neighbors in the enteric mesenchyme. If crest-derived cells are not isolated from the non-neuronal cells of the enteric mesenchyme but are cultured together with them, then the crest-derived cells may be subjected to growth factors that the non-neuronal cells secrete. If the non-neuronal cells were to promote the development of enteric neurons by secreting NT-3, these effects would be expected to be antagonized by anti-NT-3. The fetal rat gut was thus dissociated at embryonic day 14 (E14), and mixed cultures of mesenchymal cells were established without immunoselecting the crest-derived subset of the population. These mixed cultures were maintained for 4 d without exogenous NT-3 but in the absence (Fig. 6A) or presence of anti-NT-3 (Fig. 6B). Peripherin immunoreactivity again served as the marker for cells committed to a neuronal lineage. Anti-NT-3 significantly decreased the development of neural cells in the mixed cultures (p < 0.05) (Fig. 6C). The presence of anti-NT-3 also reduced the complexity and size of the arborization of neurites (Fig. 6, compare A, B).

Anti-NT-3 inhibits the development of neurons and the arborization of neurites in cultures of mixed cells from the fetal enteric mesenchyme. The fetal bowel was dissociated, and the resulting mesenchymal cell suspension was plated without isolating the cells of neural crest origin. Cultures were grown for 4 d and fixed for the immunocytochemical demonstration of peripherin immunoreactivity.A, Control; vehicle only. Peripherin-immunoreactive cells are abundant and give rise to a profuse and complex arbor of neurites. B, Anti-NT-3 (40 μg/ml). Fewer peripherin-immunoreactive cells are present, and they give rise to relatively few neurites with a paucity of branches. C, The numbers of peripherin immunoreactive cells in each culture were quantified. Anti-NT-3 significantly inhibits the development of peripherin-immunoreactive cells in the mixed cultures.
Retrograde transport of NT-3 occurs in subsets of neurons in both plexuses of the mature rat gut
Specific uptake and retrograde transport from axon terminals to cell bodies is a characteristic feature of neurotrophins that has been reported to identify neurons that develop in response to a given neurotrophin and acquire a dependence on it that persists into adult life (DiStefano et al., 1992). The observations that NT-3 promotes the development of enteric neurons in vitro, that NT-3 dependence occurs, and that anti-NT-3 inhibits the ability of noncrest-derived cells to enhance the development of enteric neurons are all consistent with the idea that NT-3 plays a physiologically important role in the development of at least some enteric neurons. If this hypothesis is correct and dependence persists, then the axon terminals of subsets of neurons in the mature gut would be expected to take up NT-3 and transport it in the retrograde direction to cell bodies. 125I-NT-3 was thus microinjected into the target areas of a variety of enteric neurons (Gershon et al., 1994; Kunze and Furness, 1999) to determine whether specific uptake and retrograde transport of NT-3 occurs in the ENS. These targets included the mucosa, smooth muscle, myenteric ganglia, and tertiary plexus (see summary diagram in Fig. 12). The mucosa contains the terminals of secretomotor and IPANs of submucosal ganglia and also the terminals of myenteric IPANs (see diagram in Fig. 12D,inset). Myenteric ganglia contain the terminals of ascending and descending interneurons projecting from other myenteric ganglia, as well as the distal processes of submucosal IPANs. The tertiary plexus and smooth muscle both contain the terminals of myenteric motor neurons. To test the specificity of uptake and retrograde transport, 125I-NT-3 was microinjected together with an excess of nonradioactive NT-3, NGF, or BDNF. In several studies, 125I-NT-3 was microinjected into the bowel wall together with the retrograde transport markers β-CTx or Fluoro-Gold to verify that retrograde transport was responsible for the labeling of neurons by125I-NT-3 and to ascertain the relative proportion of axons projecting to the injection sites that took up125I-NT-3.
When 125I-NT-3 was injected into the wall of the gut, neurons were found to have become radioautographically labeled in enteric ganglia. The locations of the labeled neurons depended on where the 125I-NT-3 was injected. When 125I-NT-3 was microinjected into the mucosa, the neurons that became radioautographically labeled were exclusively found in submucosal ganglia (Fig.7A,B,D–I; see also the summary diagram in Fig. 12C). Mucosal injections of 125I-NT-3 did not label neurons in myenteric ganglia. When125I-NT-3 was injected into the layer of the myenteric plexus (encompassing also the smooth muscle and tertiary plexus), labeling was found in both underlying submucosal ganglia (Fig.7C) and myenteric ganglia distant from the injection sites (Fig. 7M–O; see also the summary diagram in Fig.12D). At the injection sites themselves, varicose fibers labeled by 125I-NT-3 were found extending away from the masses of injected radioactive material (Fig.7L). 125I-NT-3 labeled no varicose axons or other neurites in the distant ganglia that contained labeled neuronal perikarya. Coinjection of an excess of nonradioactive NT-3 prevented the labeling of cells by125I-NT-3 (Fig.7J,K). NT-3 was effective in blocking the labeling of neurons by125I-NT-3, regardless of whether injections were placed in the mucosal or myenteric ganglia. In contrast to excess NT-3, an excess of NGF (Fig. 7D–F) or BDNF (data not shown) did not inhibit the labeling of neurons by125I-NT-3. When Fluoro-Gold (Fig.7D–F) or β-CTx (Fig.7G–I,M,N) was injected with 125I-NT-3, all of the cells that were radioautographically labeled by125I-NT-3 contained the coinjected retrograde tracer. In each case, however, more neurons were labeled by β-CTx or Fluoro-Gold (36 neurons) than by125I-NT-3 (17 neurons), suggesting that only a subset of enteric neurons is capable of uptake and retrograde transport of NT-3.
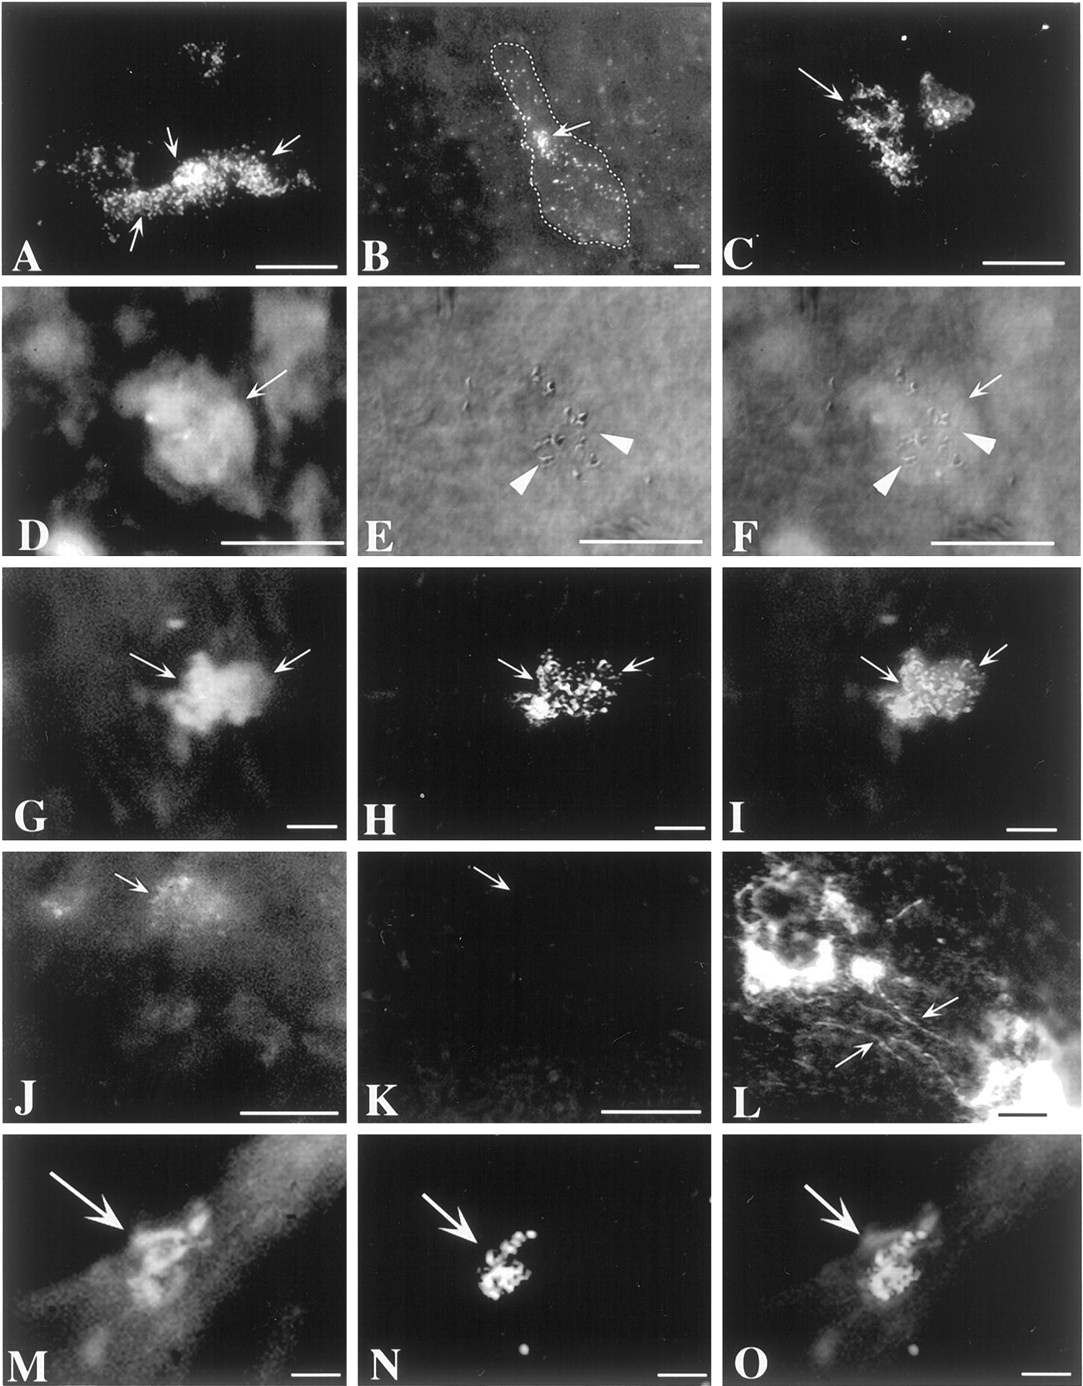
Axons of mature enteric neurons specifically take up 125I-NT-3 and transport it in the retrograde direction to their cell bodies in enteric ganglia.125I-NT-3 was microinjected into the mucosa or the muscularis externa–myenteric plexus and located by radioautography 4 weeks later. A, B, Submucosal ganglia after a mucosal injection of 125I-NT-3. Multiple neurons are labeled in some ganglia (A), whereas only one or two labeled neurons can be found in others (B). The stippled line inB outlines the borders of the illustrated submucosal ganglion. Arrow indicates a125I-NT-3-labeled neuron. C, A submucosal ganglion after an injection of 125I-NT-3 into the myenteric plexus. Several neurons (arrow) are labeled.D–F, Submucosal ganglion after a mucosal coinjection of125I-NT-3, Fluoro-Gold, and an excess of NGF. A neuron (arrow) is colabeled by 125I-NT-3 and Fluoro-Gold. NGF does not prevent the labeling of neurons by125I-NT-3. D, Fluorescence view showing the location of Fluoro-Gold. E, Interference contrast illumination showing the location of 125I-NT-3.F, Superimposition of fluorescence and interference contrast images. G–I, Submucosal ganglion after a mucosal coinjection of 125I-NT-3 and β-CTx. Two neurons (arrows) are colabeled by 125I-NT-3 and β-CTx. G, Fluorescence view showing the location of β-CTx (visualized by immunofluorescence with FITC). H, Incident dark-field illumination showing the location of125I-NT-3. I, Superimposition of fluorescence and dark-field images. J, K, Submucosal ganglion after a myenteric coinjection of125I-NT-3, Fluoro-Gold, and an excess of nonradioactive NT-3. The excess of nonradioactive NT-3 does not interfere with the labeling of neurons by Fluoro-Gold (J;arrow) but prevents the radioautographic labeling of neurons by 125I-NT-3 (K).J, Fluorescence view showing the location of Fluoro-Gold. K, Incident dark-field illumination. Thearrow shows the location of a neuron labeled by Fluoro-Gold (visible in J but not inK). L, Site of injection of125I-NT-3 into a myenteric ganglion. The ganglion contains a great deal of nonspecific radioautographic labeling, but125I-NT-3-labeled varicose axons (arrows) can also be seen running away from the injection site.M–O, A myenteric ganglion is illustrated after125I-NT-3 and β-CTx were coinjected into a distant myenteric ganglion. A neuron (arrow) is colabeled by125I-NT-3 and β-CTx. M, Fluorescence view showing the location of β-CTx (visualized by immunofluorescence with FITC). N, Incident dark-field illumination showing the location of 125I-NT-3. O, Superimposition of fluorescence and dark-field images. Scale bars, 25 μm.
Myenteric neurons are increased in number and size in transgenic mice that overexpress NT-3 directed to the ENS by the DBH promoter
Transgenic mice that overexpress NT-3 in the ENS were investigated to determine whether NT-3 affects ENS development in situ. The expression of NT-3 in these mice was under the control of the DBH promoter (DBH–NT-3 mice), which has been demonstrated to target the overexpression of a large number of molecules to the ENS, as well as to sympathetic neurons (Kapur et al., 1992; Rice et al., 2000). The DBH–NT-3 mice survive and gain weight normally. Enteric neurons were demonstrated with cuprolinic blue in dissected laminar preparations of the gut wall from wild-type and DBH–NT-3 mice (Fig.8A,B). The neurons in the ganglia of the myenteric plexus of DBH–NT-3 mice were, on average, larger than those of wild-type animals (Table2; Fig. 8, compare A,B). The means of the maximum chords, diameters (measured through the nucleus), perimeters, and areas were all significantly increased in the neurons of the DBH–NT-3 animals (Table 2). The number of myenteric neurons per ganglion was also substantially greater in DBH-NT-3 mice (Fig. 8C), as was the packing density of neurons within the ganglia. The packing density in DBH–NT-3 mice was 3.1 × 10⁻³ ± 4.2 × 10⁻⁵neurons/μm2, whereas in wild-type animals, it was 2.9 ± 10−3 ± 4.1 × 10⁻⁵neurons/μm2 (p < 0.03). In contrast to the myenteric plexus, the number of neurons in the submucosal plexus was not significantly different in DBH–NT-3 and wild-type mice (Fig. 8C).

Overexpression of NT-3 targeted to the ENS of transgenic mice by the DBH promoter is associated with increases in the size and numbers of myenteric neurons. A,B, Laminar preparations of the longitudinal muscle with adherent myenteric plexus stained with cuprolinic blue to reveal neurons. A, Wild-type mouse. B, DBH–NT-3 mouse. Scale bars, 25 μm. C, Neurons were counted in cuprolinic blue-stained preparations of the myenteric and submucosal plexuses. There are significantly more myenteric neurons per ganglion in the DBH–NT-3 mice (p < 0.001); however, the numbers of submucosal neurons ganglion are not significantly different in the two types of animal.
Sizes of neurons in the myenteric plexus of wild-type and DBH–NT-3 mice
The ENS was also examined immunocytochemically in adult transgenic mice in which the DBH promoter drives expression of bacterial β-galactosidase (LacZ) (Kapur et al., 1992; Rice et al., 2000). The transgene was found to be expressed in neurons of both plexuses (myenteric > submucosal); however, the late-appearing calcitonin gene-related peptide (CGRP)-immunoreactive neurons, which were predominantly submucosal, were never observed to express LacZ.
The knock-out of TrkC or NT-3 causes enteric neurons to be lost from both plexuses
Subsets of neurons in the P9 postnatal gut were found to display TrkC immunoreactivity. The numbers of these cells were counted in laminar preparations of bowel wall containing the submucosal or myenteric plexuses. In the TrkC +/+ small intestine (proximal region), there were 150 ± 12 myenteric and 297 ± 28 submucosal neurons/mm2. The corresponding numbers in TrkC +/− mice were 168 ± 19 myenteric and 206 ± 21 TrkC-immunoreactive submucosal neurons/mm2. Essentially no TrkC-immunoreactive neurons were observed in either plexus in TrkC −/− mice. These observations are consistent with the ideas that mature enteric neurons express TrkC in both plexuses and confirm that this expression is lacking in TrkC −/− animals (Klein et al., 1994;Tessarollo et al., 1997). These data are also consistent with the observations (described above) that subsets of neurons in both plexuses are capable of the retrograde transport of NT-3.
Enteric neurons were counted in cuprolinic blue-stained laminar preparations of the small intestines of TrkC (−/−, +/−, and +/+) and NT-3 (−/−, +/−, and +/+) mice (Fig.9). The numbers of neurons were significantly decreased in both the myenteric and submucosal plexuses in both the TrkC −/− and the NT-3 −/− animals. In contrast, the numbers of neurons were not significantly decreased in either the myenteric or submucosal plexuses of the heterozygous TrkC +/− or NT-3 +/− mice. In neither the TrkC −/− nor the NT-3 −/− animals was there a total loss of neurons in any region of the small intestine or a disruption of the normal pattern of organization of the plexuses. The most severe decrease in neuron numbers was in the submucosal plexus of the NT-3 −/− mice in which the numbers were approximately one-third of normal. When the myenteric plexus of the small intestine was examined regionally (Table 3), the deficits in neuronal numbers were found to be more severe proximally than distally. In fact, in the myenteric plexus of the proximal small intestine, the number of neurons was significantly lower than wild type, even in TrkC +/− mice. Surprisingly, in neither the TrkC −/− nor the NT-3 −/− mice was there a significant difference from wild-type in the number of neurons in the myenteric plexus of the most distal portion of the ileum. In the submucosal plexus of wild-type mice, the number of neurons in the middle of the small intestine was larger than in the more proximal bowel of the same animals (Table4). In this region of the bowel, the number of submucosal neurons in the TrkC +/− mice was found to be intermediate between that of TrkC +/+ and TrkC −/− animals, but both here and in the proximal small intestine the number of neurons in the submucosal plexus was significantly lower than that found in the corresponding region of the small intestine of TrkC +/+ mice.

The number of neurons in both the myenteric and submucosal plexuses of the small intestine is lower in TrkC −/− and NT-3 −/− mice than in matched +/+ or +/− animals. Neurons were counted in laminar preparations stained with cuprolinic blue. In wild-type mice, the mean neuronal density was 1083 ± 60 neurons/mm2 (n = 26) in the myenteric and 733 ± 57 neurons/mm2 in the submucosal plexus (n = 13). A, Myenteric plexus of TrkC +/+ (n = 11), +/− (n = 12), and −/− (n = 10) mice. The number of neurons in −/− animals is significantly less than that of either +/+ (p < 0.01) or +/− mice (p < 0.05). B, Submucosal plexus of TrkC +/+ (n = 8), +/− (n = 8), and −/− (n = 8) mice. The number of neurons in −/− animals is significantly less than that of either +/+ (p < 0.0005) or +/− mice (p < 0.05). (The data shown inA and B were obtained from mice examined at age P9.) C, Myenteric plexus of NT-3 +/+ (n = 15), +/− (n = 15), and −/− (n = 15) mice. The number of neurons in −/− animals is significantly less than that of either +/+ (p < 0.002) or +/− mice (p < 0.001). D, Submucosal plexus of NT-3 +/+, +/−, and −/− mice. The number of neurons in −/− animals is significantly less than that of either +/+ (p < 0.0001) or +/− mice (p < 0.0001). (The data shown inC and D were obtained from mice examined at age P11.)
Regional distribution of myenteric neurons (per mm2) in the small intestines of wild-type mice and animals with targeted deletions of genes encoding TrkC or NT-3
Regional distribution of submucosal neurons (per mm2) in the small intestines of wild-type mice and animals with targeted deletions of genes encoding TrkC
Because the total number of neurons appears to be decreased in the guts of both TrkC −/− and NT-3 −/− mice, we investigated neurotransmitter-defined phenotypes of enteric neurons to determine whether these deficits could be accounted for by the absence of a particular subset of enteric neuron. Previous studies have established that multiple lineages of crest-derived precursor contribute to the formation of the ENS (Pham et al., 1991; Blaugrund et al., 1996). One of these depends on expression of the mash-1 gene, is transiently catecholaminergic (TC), and is born first during development. The other, which neither expresses nor depends onmash-1, is not TC and is born late in ontogeny (beginning after the mash-1-dependent cells are postmitotic). Studies were performed with 5-HT and CGRP, which are markers, respectively, for early-born mash-1-dependent and late-bornmash-1-independent lineages of neurons. Neurons continue to be born in the mouse gut for the first 3 weeks of postnatal life (Pham et al., 1991). 5-HT and CGRP immunoreactivities were demonstrated in the bowel of control and mice lacking TrkC at P11 and P22. No significant differences were found in the density of 5-HT-immunoreactive neurons (Fig.10A), which are exclusively myenteric (Sang and Young, 1996); however, the density of CGRP-immunoreactive cells, which are predominantly submucosal (Bornstein and Furness, 1988; Pataky et al., 1990), was significantly reduced in the TrkC −/− animals (Fig. 10B). Interestingly, this difference in the density of the late-arising CGRP-immunoreactive neurons was not apparent until P22, which follows a period of substantial addition of these cells to the ENS. The body weights of the TrkC −/− mice themselves (Fig. 10C) and the serosal area of their intestines (Fig. 10D) were each very much less than those of either TrkC +/+ or TrkC +/− animals. As a result, the absolute number of a given type of neuron in TrkC −/− mice is less than that found in control animals, even when the packing density of that type of neuron is the same in both animals. For example, the absolute number of 5-HT-immunoreactive neurons in the small intestine of P11 TrkC −/− mice (794 ± 34) is actually significantly lower that that in control mice (1826 ± 77), although the packing density is the same in both types of animal. The same is true of CGRP-immunoreactive neurons at P11. Although the packing density of these cells did not appear to be reduced compared with control, the absolute number of CGRP-immunoreactive neurons was lower in the smaller TrkC −/− bowel (7543 ± 442) than in controls (12,613 ± 438).

The packing density of 5-HT-immunoreactive neurons is similar in TrkC −/− and control mice, but that of CGRP-immunoreactive neurons is decreased in the TrkC −/− animals. A, Packing density of 5-HT-immunoractive neurons in the proximal small intestine at P11 and P22. The packing density does not increase significantly between P11 and P22 in the control bowel, and no significant differences are seen between TrkC −/− and control mice at any age. (Control mice include the pooled values of TrkC +/+ and +/− animals, which did not differ from one another). Values were determined by counting neurons in 80–320 fields of measurement (1 field is equivalent to 1.254 mm2). Note that all 5-HT-immunoreactive neurons are myenteric.B, Packing density of CGRP-immunoreactive neurons in the proximal small intestine at P11 and P22. The packing density increases substantially in the submucosal plexus between P11 and P22 in both the control and TrkC −/− bowel. The density of CGRP-immunoreactive cells in the submucosal plexus of TrkC −/− is significantly less than that of control mice at P22. Values were determined by counting neurons in 40–180 fields of measurement (1 field is equivalent to 1.254 mm2). Note that CGRP-immunoreactive neurons are predominantly submucosal.
A number of additional neurotransmitter–modulator-related markers were investigated in NT-3 −/− and TrkC −/− mice. Markers were demonstrated immunocytochemically as described above, and neurons were counted in submucosal and myenteric plexuses and compared with similar counts of analogous regions of the bowel of wild-type mice. These markers included tyrosine hydroxylase (TH), dopamine transporter (DAT), nitric oxide synthase (NOS), GABA, choline acetyltransferase (ChAT), and substance P. The numbers of neurons per square millimeter of each of these phenotypes was found to be variable between animals, and none differed significantly from control (data not illustrated). Unfortunately, these markers are costored in a variety of combinations in different neurons, so that, in contrast to 5-HT, none mark a single neuronal phenotype (Sang and Young, 1996). Again, however, the absolute number of all of the neurons in the gut displaying each of these markers was probably reduced in the NT-3- and TrkC-deficient mice because the bowel of the knock-out animals was severely diminished in size.
Responses to NT-3 and CNTF are interactive
The data (described above) demonstrate that subsets of enteric neurons that develop in response to NT-3 become NT-3 dependent; nevertheless, the defects found in the ENS of mice lacking NT-3 or TrkC are partial and regional. These observations suggest that other factors might be able to rescue cells that might otherwise fail to develop or die if they were deprived of NT-3. A factor that activates the tripartite neuropoietic cytokine receptor might be able to exert such an effect; for example, CNTF, which stimulates that receptor, promotes the development of enteric neurons and its effects are additive with those of NT-3 (Chalazonitis et al., 1998a). Experiments were thus performed to investigate the interactions between responses to NT-3 and CNTF and to determine whether a neuropoietic cytokine (for which CNTF was studied as a surrogate) can compensate for the withdrawal of NT-3. In confirmation of previous data, CNTF, applied by itself to crest-derived cells isolated from the E14 fetal rat gut by immunoselection with antibodies to p75NTR, promoted the development of neurons (Fig.11A). The response to a supramaximal concentration of CNTF was significantly greater than that to a supramaximal concentration of NT-3 (p< 0.0005). When cells were exposed to CNTF for 5 d and then sequentially transferred to NT-3 for a final 3 d, the promotion of neuronal development was equal to that seen in cells exposed to CNTF for the full period of 8 d. In contrast, when the sequence was reversed and cells were incubated in the presence of NT-3 for 5 d and then transferred to CNTF for the final 3 d, the response was greater in magnitude than that produced by NT-3 alone (p < 0.0001), CNTF alone (p < 0.0003), or by CNTF followed by NT-3 (p < 0.0002). When cells were incubated only with vehicle before they were transferred to CNTF or NT-3, the ability of either factor to promote the development of neurons was substantially attenuated (p < 0.001 vs 8 d in the presence either of NT-3 or CNTF). These observations imply that the crest-derived cells that can ultimately respond to NT-3 or CNTF must be exposed to these factors soon after isolation or the responsivity of the cells to the corresponding factors is lost. Even as little as 1 d of incubation in the presence of only vehicle is enough almost to eliminate the ability of cells to respond to NT-3. Evidently, NT-3 is more effective than CNTF in preserving the population of potentially responsive cells; however, cells that have been exposed initially to NT-3 give rise to more neurons when they are transferred to CNTF than when they are continued in the presence of NT-3.

Responses to NT-3 and CNTF interact. Crest-derived cells were isolated from the bowel by immunoselection with antibodies to p75NTR and cultured in defined media. A, The effects of sequential exposure of the cultures of crest-derived cells to vehicle, CNTF, or NT-3 are illustrated. Neurons were identified immunocytochemically by using antibodies to peripherin as a neuronal marker. The sequence of factors and the duration of exposure to each are shown next to the corresponding bars. The development of neurons has been normalized as a percentage of the number present in matched cultures exposed to NT-3 (only) for 8 d. The solid linesdepict the duration of exposure to NT-3, the dashed lines depict the duration of exposure to CNTF, and thedots depicts exposure to vehicle. B, The effects of withdrawal of NT-3, CNTF, or NT-3 plus CNTF from cells exposed to both factors are illustrated. The development of neurons has been normalized as in A. The factors present, the durations of exposure to them, and the sequence of their withdrawal are described next to the corresponding bars. Thesolid lines show duration of exposure to NT-3,dashed lines show duration of exposure to CNTF, and thedots show exposure to vehicle.
In contrast to NT-3, CNTF has not been found to induce dependency in enteric neurons that develop in response to its presence (Chalazonitis et al., 1998a). The effects of withdrawing CNTF and NT-3 from cells exposed to both factors were thus investigated (Fig.11B). In confirmation of previous data showing that the effects of CNTF and NT-3 are additive (Chalazonitis et al., 1998a), at least twice as many neurons were found to develop in cultures exposed simultaneously to NT-3 and CNTF as in cultures exposed only to NT-3 (p < 0.001 for both 5 and 8 d of exposure). The number of neurons in cultures exposed to both factors continued to increase significantly between days 5 and 8 in vitro (p < 0.05). This increase was prevented by the double withdrawal of both NT-3 and CNTF after the first 5 d of incubation (p < 0.03); however, neurons did not appear to be lost during the subsequent 3 d of incubation because the number of neurons present at 8 d in the cultures subject to the withdrawal of both factors was equivalent to that seen in cultures fixed after exposure to NT-3 and CNTF for 5 d. In contrast to the double-withdrawal paradigm, the single withdrawal of CNTF at 5 d from cultures exposed both to NT-3 and CNTF did not prevent the continued development of neurons (now in the presence of only NT-3) during the subsequent 3 d in vitro. The single withdrawal of NT-3, however, from cultures exposed for the first 5 d both to NT-3 and CNTF caused a substantial loss of neurons to occur during the subsequent 3 d in vitro, despite the continued presence of CNTF (p < 0.0003 vs single withdrawal of CNTF and continued presence of NT-3; p < 0.0001 vs NT-3 plus CNTF for 8 d; p < 0.05 vs NT-3 plus CNTF for 5 d). These observations suggest that the dependency of enteric neurons on NT-3 is enhanced by the early exposure of cells to both NT-3 and CNTF; moreover, cells that have thus become highly NT-3 dependent after the exposure to both factors cannot be supported only by CNTF (Fig. 11B). In contrast, CNTF can substitute for NT-3 or even add to the NT-3 response when CNTF is added to cells that have been exposed only to NT-3 (Fig. 11A).
DISCUSSION
The current study suggests that NT-3 plays a physiologically significant role in ENS development. Previous studies had shown that exogenous NT-3 promotes enteric neuronal development and neurite outgrowth in vitro (Chalazonitis et al., 1994, 1998a,b;Saffrey et al., 2000), that NT-3 is expressed in the developing and mature bowel (Maisonpierre et al., 1990; Zhou and Rush, 1993; Le Douarin and Kalcheim, 1999), and that TrkC is expressed by enteric crest-derived cells (Tessarollo et al., 1993; Chalazonitis et al., 1994; Hoehner et al., 1996; Sternini et al., 1996). Because the knock-outs of neither NT-3 (Fariñas et al., 1994) nor TrkC (Klein et al., 1994; Tessarollo et al., 1997) produce ENS defects large enough to compromise the ability of the gut to support life, we postulated that NT-3 affects only a relatively small subset of enteric neurons and/or that compensatory effects of other growth factor(s) might occur. Restricted effects of NT-3 are to be expected because it is a relatively late-acting factor that is not, like GDNF, required by the initial crest-derived cells that colonize the gut (Chalazonitis et al., 1998b).
Consequences expected to accompany physiologically significant effects of NT-3 on ENS development include the following. (1) A subset of enteric neurons would become NT-3 dependent after exposure to NT-3. (2) NT-3 withdrawal would thus induce apoptosis in TrkC-expressing neurons. (3) Antibodies that antagonize the effects of exogenous NT-3 on enteric neuronal development would also block effects of endogenous NT-3 provided by targets of the enteric innervation. (4) NT-3 overexpression would exert neurotrophic effects on enteric neurons in vivo. (5) Because the retrograde transport of NT-3 usually occurs in adult neurons that arise from NT-3-dependent precursors (DiStefano et al., 1992), the NT-3-dependent subsets of mature enteric neurons would transport 125I-NT-3 from terminal fields to their cell bodies. (6) Subsets of enteric neurons should be lost in mice that lack NT-3–TrkC and/or growth factor(s) that can substitute for NT-3 should be identified. All of these expectations were realized.
The in vitro exposure of isolated enteric crest-derived cells to NT-3 promoted the development of neurons. When NT-3 was withdrawn, some of these cells entered apoptosis and died. Responding cells constituted a small proportion of the total crest-derived population; thus, NT-3 withdrawal did not reduce the total numbers of live or dead cells. These observations are consistent with the view that NT-3 exposure induces dependency only in a subset of enteric neurons, which helps to explain why the knock-out of NT-3–TrkC does not produce gross ENS defects (Fariñas et al., 1994; Klein et al., 1994; Tessarollo et al., 1997). The neurons affected by NT-3 withdrawal, however, selectively express TrkC; moreover, the in vitro development of TrkC-expressing neurons depends on the presence of NT-3. The survival of enteric crest-derived cells that acquire TrkC thus requires NT-3. The presence of TrkC immunoreactivity on varicose nerve terminals, as well as cell bodies, indicates that TrkC is located where it can gain access to target-derived NT-3 and thus is consistent with the proposed role of NT-3.
Anti-NT-3 was found to block the effects of exogenous NT-3 on development of enteric neurons from isolated crest-derived precursors. In the absence of exogenous NT-3, however, anti-NT-3 did not affect the development of neurons, suggesting that enteric crest-derived cells are not able to sustain development of NT-3-responsive neurons through their own release of NT-3. In contrast, anti-NT-3 inhibited the development of enteric neurons in mixed cultures, in which the crest-derived precursors were grown together with noncrest-derived cells of the enteric mesenchyme. These observations are consistent with the idea that noncrest-derived targets provide NT-3 to NT-3-dependent enteric neurons. NT-3 is produced by the enteric mesenchyme (Le Douarin and Kalcheim, 1999) and, in the adult bowel, by the mucosal epithelium and longitudinal smooth muscle (Zhou and Rush, 1993). The enteric neurons that innervate the mucosal epithelium are predominantly submucosal IPANs (Kirchgessner et al., 1992; Pan and Gershon, 2000) and secretomotor (Cooke, 1989; Gershon et al., 1994; Kunze and Furness, 1999) (Fig.12). The neurons that innervate the longitudinal muscle are myenteric motor neurons that project into the tertiary plexus (Brookes et al., 1992). These neurons are all potentially NT-3 dependent.

Summary diagram showing the structure of the wall of the intestine, endogenous sources of NT-3, sites in which 125I-NT-3 was injected, and the locations of neurons labeled by the retrograde transport of NT-3. A, Diagram showing the anatomy of the wall of the bowel. Note that nerves enter the connective tissue of the mucosa but do not penetrate the mucosal lining and enter the intestinal lumen. The two plexuses interconnect.B, Although mRNA encoding NT-3 has been reported to be present in the mesenchyme of the fetal gut, endogenous NT-3 (white stippling) in the mature bowel has been localized to the mucosal epithelium and the longitudinal muscle (Zhou and Rush, 1993). C, Injection of 125I-NT-3 into the mucosa (white puff) labeled submucosal but not myenteric ganglia. The submucosal neurons that project to the mucosa are IPANs and secretomotor neurons (see also the insetin D). D, Injection of125I-NT-3 into the longitudinal muscle and adjacent myenteric ganglia (white puff) labeled neurons in underlying submucosal ganglia and neurons in distant myenteric ganglia (neurons in ganglia that were encompassed by the injection site were not counted as specifically labeled). These injections included branches of the tertiary plexus (site of terminals to the longitudinal smooth muscle). The only submucosal neurons known to project to myenteric ganglia are IPANs, and none project to the longitudinal muscle. Neurons in distant ganglia that project to the injection sites included interneurons and longitudinal muscle motor neurons. These connections are diagrammed in the inset. Submucosal IPANs project to both the mucosa and the myenteric ganglia; thus, they could have been labeled by either mucosal or myenteric injections of125I-NT-3.
Specific retrograde transport of 125I-NT-3 was found to occur in enteric neurons. It was prevented by the coinjection of nonradioactive NT-3 but not NGF or BDNF. When125I-NT-3 was coinjected with the retrograde markers Fluoro-Gold or β-CTx, all of the neuronal perikarya that contained 125I-NT-3 also contained Fluoro-Gold or β-CTx. These retrograde tracers, however, labeled more neurons than 125I-NT-3; therefore, only a subset of the terminals present at the injection sites transported 125I-NT-3 to their cell bodies. The retrograde labeling patterns obtained with125I-NT-3 (Fig. 12) provided additional insight into which subsets of enteric neurons might be NT-3 dependent. Mucosal injections of 125I-NT-3 exclusively labeled neurons in submucosal ganglia, suggesting that NT-3 may be important in the development of submucosal IPANs and/or secretomotor neurons, which are the only submucosal neurons with mucosal projections (Fig. 12C). Because a set of myenteric IPANs (calbindin-immunoreactive Dogiel type II cells) also projects to the mucosa (Song et al., 1994; Kunze and Furness, 1999; Bertrand et al., 2000), the failure of mucosal125I-NT-3 to label any neurons in myenteric ganglia suggests that these cells are NT-3 independent. Injections of 125I-NT-3 placed into the myenteric plexus were large enough to encompass ganglia, elements of the tertiary plexus, and the surrounding muscle (Fig.12D). These injections labeled neurons in both the underlying submucosal plexus and distant myenteric ganglia. The only submucosal neurons that project to myenteric ganglia are IPANs, which extend peripheral processes to the mucosa and central processes to myenteric ganglia (Fig. 12D, inset). The distant myenteric neurons could have been motor neurons terminating within the tertiary plexus or interneurons terminating on neurons within myenteric ganglia (Fig. 12D,inset). The locations of sources of NT-3 in the mucosal epithelium and longitudinal muscle of the adult bowel (Zhou and Rush, 1993) (Fig. 12B) and the pattern of retrograde transport both suggest that submucosal IPANs and myenteric motor neurons receive target-derived support from NT-3 (see the diagram in Fig. 12D, inset).
The observation that the overexpression of NT-3 in transgenic mice, under the control of the DBH promoter, causes the number of neurons per ganglion and the mean size of neurons to be increased in the myenteric plexus confirms that NT-3 promotes enteric neuronal developmentin vivo. The DBH promoter is expressed during development by TC cells (which contain all of the enzymes necessary to synthesize norepinephrine) and their successors in the adult bowel (Teitelman et al., 1981; Baetge and Gershon, 1989; Kapur et al., 1992; Blaugrund et al., 1996). Murine TC cells are detected in the fetal mouse gut between E10 and E13 (Baetge and Gershon, 1989). TC cells are crest-derivedmash-1-dependent precursors that lose markers because they differentiate into noncatecholaminergic neurons (Baetge et al., 1990a,b; Blaugrund et al., 1996). DBH, however, persists, and its promoter continues to drive transgene expression (Mercer et al., 1991;Kapur et al., 1992; Rice et al., 2000). Later-developing neurons are derived from non-TC progenitors (Pham et al., 1991; Gershon, 1997,1998a) and may not express DBH-driven transgenes. In fact, in DBH–LacZ mice, neurons containing CGRP, the last to be born during ENS development, did not contain LacZ, confirming the absence of DBH transgene expression in these cells. The submucosal plexus also develops after the myenteric. The restriction of the effect of the DBH-directed transgenic overexpression of NT-3 to myenteric ganglia, therefore, may be the result of a lower level of transgene expression in the submucosal plexus.
The targeted deletion of either NT-3 or TrkC induced demonstrable defects in both submucosal and myenteric ganglia. These defects were detected as reductions in the number of neurons stained by cuprolinic blue (Karaosmanoglu et al., 1996). In general, the loss of neurons was more severe proximally than distally and greater in submucosal than myenteric ganglia. Particularly in the submucosal plexus, the effect of the knock-out of NT-3 was greater than that of TrkC. Conceivably, therefore, activation of alternative receptors by NT-3 might be able to partially compensate for the absence of TrkC (Tessarollo et al., 1997). The submucosal defect is consistent with the possibility that submucosal IPANs are NT-3 dependent. This hypothesis is further supported by the observation that the density of submucosal CGRP-containing neurons was significantly reduced in TrkC −/− mice. Submucosal IPANs contain CGRP (Grider, 1994; Grider et al., 1996), which mediates slow EPSPs in the secondary neurons they innervate (Pan and Gershon, 2000). Both the body weight and the bowel of NT-3 −/− and TrkC −/− mice are considerably smaller than those of wild-type and heterozygous animals; therefore, even if the number of a given type of neuron per unit area in the knock-out animals (such as found for serotonergic neurons) is equal to that in wild-type mice, the total number of such cells in the bowel would have to be reduced.
It is possible that other growth factors can partially alleviate the ENS deficits that accompany the knock-out of NT-3–TrkC. CNTF, for example, was able to prevent the death of enteric neurons in vitro when NT-3 was withdrawn and replaced with CNTF. CNTF also enabled precursor cells to survive for at least 5 d in vitro so that they could still respond to the later addition of NT-3. In the absence of CNTF or NT-3, these precursors were lost within 1 d in vitro. On the other hand, if enteric crest-derived precursors were exposed both to NT-3 and CNTF, neurons became “super-dependent” on NT-3 and died when NT-3 was withdrawn, despite the continued presence of CNTF. In fact, under these conditions, more neurons died when CNTF continued to be present than when both NT-3 and CNTF were withdrawn. One can only speculate about how a neuropoietic cytokine (CNTFII?) (Elson et al., 2000; Lesser and Lo, 2000) might affect the development of the ENS under conditions of NT-3–TrkC deprivation. Responses to stimulation of TrkC and the neuropoietic cytokine receptor interact, and the nature of this interaction is affected by the timing of exposure to the respective ligands; however, the ability of a neuropoietic cytokine to maintain early precursors might well be beneficial and the state of “super-dependency” on NT-3 associated with the simultaneous exposure of precursors to NT-3, and a neuropoietic cytokine could not occur in NT-3–TrkC knock-out mice.
Footnotes
This work was supported by March of Dimes Grant 0872 (to A.C.) and National Institutes of Health Grants NS15547 (to M.D.G.) and HD21032 (to T.P.R.). We thank Michael D. Hammer and Qin Zhang for technical assistance and Drs. Annette Kirchgessner and Paul Wade for their advice.
Correspondence should be addressed to Dr. Alcmène Chalazonitis, Department of Anatomy and Cell Biology, Columbia University, 630 West 168th Street, New York, NY 10032. E-mail:ac83{at}columbia.edu.


