

Abstract
The photopigment in the human eye that transduces light for circadian and neuroendocrine regulation, is unknown. The aim of this study was to establish an action spectrum for light-induced melatonin suppression that could help elucidate the ocular photoreceptor system for regulating the human pineal gland. Subjects (37 females, 35 males, mean age of 24.5 ± 0.3 years) were healthy and had normal color vision. Full-field, monochromatic light exposures took place between 2:00 and 3:30 A.M. while subjects' pupils were dilated. Blood samples collected before and after light exposures were quantified for melatonin. Each subject was tested with at least seven different irradiances of one wavelength with a minimum of 1 week between each nighttime exposure. Nighttime melatonin suppression tests (n = 627) were completed with wavelengths from 420 to 600 nm. The data were fit to eight univariant, sigmoidal fluence–response curves (R2 = 0.81–0.95). The action spectrum constructed from these data fit an opsin template (R2 = 0.91), which identifies 446–477 nm as the most potent wavelength region providing circadian input for regulating melatonin secretion. The results suggest that, in humans, a single photopigment may be primarily responsible for melatonin suppression, and its peak absorbance appears to be distinct from that of rod and cone cell photopigments for vision. The data also suggest that this new photopigment is retinaldehyde based. These findings suggest that there is a novel opsin photopigment in the human eye that mediates circadian photoreception.
- melatonin
- action spectrum
- circadian
- wavelength
- light
- pineal gland
- neuroendocrine
- photoreception
- photopigment
- human
Light is the primary stimulus for regulating circadian rhythms, seasonal cycles, and neuroendocrine responses in many species, including humans (Klein et al., 1991; Wehr, 1991). Furthermore, clinical studies have demonstrated that light therapy is effective for treating selected affective disorders, sleep problems, and circadian disruptions (Wetterberg, 1993; Lam, 1998). Currently, the ocular photoreceptors that transduce light stimuli for circadian regulation and the clinical benefits of light therapy are unknown.
The retinohypothalamic tract, a distinct neural pathway that mediates circadian regulation by light, projects from the retina to the suprachiasmatic nuclei (SCN) (Moore, 1983). A neural pathway extends from the SCN to the pineal gland (Klein et al., 1991; Morin, 1994). By this pathway, light and dark cycles are perceived through the mammalian eyes, entrain SCN neural activity, and, in turn, entrain the rhythmic secretion of melatonin from the pineal gland. In virtually all species, melatonin secretion is high during the night and low during the day (Reiter, 1991; Arendt, 1998). In addition to entraining pineal rhythms, light exposure can acutely suppress melatonin secretion (Rollag and Niswender, 1976; Lewy et al., 1980). Acute, light-induced melatonin suppression is a broadly used indicator for photic input to the SCN, which has been used to elucidate the ocular and neural physiology for circadian regulation (Klein et al., 1991; Brainard et al., 1997).
Studies using rodents with retinal degeneration suggest that neither the rods nor cones used for vision participate in light-induced melatonin suppression, circadian phase shifts, or photoperiodic responses (Pevet et al., 1984; Webb et al., 1985; Foster et al., 1991). Furthermore, enucleation of rodless, coneless transgenic mice abolishes light-induced circadian phase shifts and melatonin suppression (Lucas and Foster, 1999; Freedman et al., 1999). Similarly, light-induced melatonin suppression and circadian entrainment have been demonstrated in humans with complete visual blindness (Czeisler et al., 1995) and with specific color vision deficiencies (Ruberg et al., 1996). Together, these studies on different forms of visual blindness suggest that melatonin regulation is controlled, at least in part, by photoreceptors that differ from the known photoreceptors for vision.
A recent study has shown that monochromatic light at 505 nm is approximately four times stronger than 555 nm in suppressing melatonin in healthy humans (Brainard et al., 2001). Those results confirmed that the ocular photoreceptor primarily responsible for pineal melatonin regulation in humans is not the three cone system that mediates photopic vision. The new data reported here extend this work by forming an action spectrum from fluence–response curves at multiple visible wavelengths.
Developing an action spectrum is a fundamental means for determining the input physiology for the circadian system. This photobiological technique has high utility for (1) defining the relative effectiveness of photons at different wavelengths for eliciting a biological response and (2) identifying the specific photopigment involved in that response (Lipson, 1994; Coohill, 1999). The specific aim of the present study was to characterize the wavelength sensitivity of the photoreceptor system responsible for providing circadian input to the human pineal gland by establishing an action spectrum for light-induced melatonin suppression. The experiments defined an action spectrum that fits a retinaldehyde opsin template and identified 446–477 nm as the most potent wavelength region for regulating melatonin. Univariance among the eight fluence–response curves suggests that a single photopigment is primarily responsible for melatonin suppression. These results suggest that there is a novel photopigment in the human eye that mediates circadian photoreception.
Preliminary reports of this work have been presented previously (Brainard et al., 1999b-e, 2000b).
MATERIALS AND METHODS
Study design. Action spectra are determined by comparing the number of photons required for the same biological effect at different wavelengths (Lipson, 1994; Coohill, 1999). The melatonin suppression action spectrum described here was formed from fluence–response curves at eight wavelengths between 440 and 600 nm. A within-subjects design was used for each fluence–response curve. For each wavelength studied, a set of eight volunteers was exposed to a minimum of eight different light irradiances on separate nights with at least 6 d between exposures. At the completion of that work, it was determined that a probe of sensitivity to monochromatic light below 440 nm was needed. Consequently, a group of eight subjects was exposed to a single night of no light exposure and a single night of exposure to one irradiance of 420 nm light.
Subjects. Volunteers who were involved in shift work, planned long-distance jet travel before or during the study period, or had irregular sleeping schedules were excluded from this study. The subject drop-out rate was 7.9%. The ethnic distribution of the 72 subjects who completed this study included 55 Caucasians, 9 Asians, 4 African Americans, 3 Hispanics, and 1 individual of unknown ethnicity. Subjects who had a relatively stable daily sleeping pattern, passed a physical exam for general and ocular health, and signed an approved Institutional Review Board consent document were accepted into this study. A total of 37 females and 35 males between 18 and 30 years old (mean ± SEM age, 24.5 ± 0.3) completed the study. The self-reported mean ± SEM weekday wake-up time among subjects was 7:06 A.M. ± 18 min. All subjects were normal on the Ishihara and Farnsworth Munsell D-100 tests for color vision (mean ± SEM Farnsworth Munsell score, 51.4 ± 4.3).
Light exposure protocol. Each experiment began at midnight when subjects entered a dimly lit room (10 lux or less). One drop of 0.5% cyclopentolate HCl was placed in each eye to dilate the subjects' pupils, and blindfolds were placed over their eyes. Subjects remained sitting upright for 120 min and listened to music on headphones or engaged in quiet conversation. While still blindfolded and just before 2:00 A.M., a 10 ml blood sample was taken by venipuncture of the antecubital vein. Subjects' blindfolds were then removed, and the subjects were exposed to the monochromatic light stimulus from 2:00 to 3:30 A.M. During light exposure, each subject's head rested in an ophthalmologic head holder facing a ganzfeld apparatus that provided a concave, patternless reflecting surface encompassing each subject's entire visual field (Fig.1). During this 90 min exposure, subjects sat quietly, kept their eyes open, and gazed at a fixed target dot in the center of the ganzfeld dome. Subject compliance for keeping their eyes open and the subjects' pupil size were monitored by a miniature video camera inside the ganzfeld dome. If the subjects began to close their eyes during the exposure period, the experimenters reminded them to keep their eyes completely open. At 3:30 A.M., a second 10 ml blood sample was taken by venipuncture, and the subjects were then permitted to leave the laboratory. Eight wavelengths were studied for this action spectrum (440, 460, 480, 505, 530, 555, 575, and 600 nm). Across these wavelengths, each subject was exposed to complete darkness from 2:00 to 3:30 A.M. on their control night and to a set of irradiances covering a 4 log unit photon density range of 1010 to 1014photons/cm2 on exposure nights. For the probe of sensitivity to monochromatic light at 420 nm, a group of eight subjects was exposed to a single night of no light exposure and a single night of exposure to 420 nm light at 31.8 μW/cm2 (5.58 × 10¹³photons/cm2).

This diagram illustrates the experimental electronic, optic, and ganzfeld dome exposure array. This apparatus provides a uniform, patternless stimulus that encompasses the subject's entire visual field. For clarity, the subject's head is shown slightly withdrawn from the opening of the ganzfeld dome. During all light exposures, the subjects' bony orbits are completely enclosed in the dome walls, providing complete exposure of their visual fields.
Light production and measurement. As shown in Figure 1, experimental light stimuli were produced by a 450 or 1200 W xenon arc lamp (Photon Technology Inc., Princeton, NJ). Each lamp was enclosed in a light-proof chamber and cooled by water circulation. An exit beam of light from each source was directed by a parabolic reflector, and, for the 1200 W lamps, excess heat in the light beam was reduced by a water filter. Monochromatic wavelengths (10–14.5 nm half-peak bandwidths) were produced by a grating monochromator, and light irradiance was controlled by a manual diaphragm. The resulting light beam was directed into the top area of a ganzfeld apparatus and reflected evenly off the walls of the ganzfeld dome into volunteers' eyes. The entire reflecting surface of the dome was coated with a white material (Spectralite) with a 95–99% reflectance efficiency over the 400–760 nm range. Routine measurement of the light irradiance (in microwatts per square centimeter) was done with a Tektronix J16 Radiometer/Photometer with a J6512 irradiance probe (Tektronix, Beaverton, OR). Experimental light stimuli reflected from the ganzfeld dome were measured at volunteers' eye level immediately before and after the 90 min exposure. Additional measures were taken each 0.5 hr of the exposure to ensure stimulus stability and enable readjustment of the intensity if it varied. These spot measures were taken with an ft-1° meter (Minolta, Osaka, Japan). Spectroradiometric assessment of the monochromatic wavelengths at the level of subjects' corneas was done with a portable spectroradiometer with a fiber optic sensor (model S2000; Ocean Optics, Dunedin, FL). This equipment was calibrated with a standard lamp traceable to the National Institute of Standards and Technology.
In action spectroscopy, it is critical that the measured light stimuli are representative of the stimuli that actually reach the photoreceptors that mediate the photobiological response. In studies on light regulation of the circadian system, factors that can modify the measured stimulus before it reaches the photoreceptors include head and eye motion, squinting and eye closure, pupillary reflexes, and light transmission through the ocular media (Gaddy et al., 1993; Brainard et al., 1997). Most of these factors are controlled in the experimental technique described above. Concerning light transmission through ocular media, the cornea and aqueous and vitreous humors normally transmit nearly 100% of visible wavelengths to the retina and do not change substantively as the eyes age (Boettner and Wolter, 1962). In contrast, the aging human lens develops pigmentation that attenuates the transmission of shorter visible wavelengths to the retina (Lerman, 1987; Brainard et al., 1997). In the present study, restricting the age of volunteers to 18–30 years controlled this factor. Measurements of mean transmittance of 36 postmortem human lenses in this age range showed relatively even transmission from 440 to 600 nm. In contrast, there was a mean 45% reduction in lens transmission at 420 nm compared with 460 nm (Brainard et al., 1997). Consequently, measured corneal light irradiances at 420 nm had to be adjusted to compensate for reduced stimulus transmission to the retina even in this relatively young study group.
Blood samples and melatonin assay. Blood samples were collected in glass vacutainers that contained EDTA. Plasma was separated by refrigerated centrifugation, aliquoted into cryogenic vials, and stored at −20°C until assay. Melatonin concentrations were assayed by radioimmunoassay using antiserum described by Rollag and Niswender (1976). Radiolabeled ligand was prepared by adding 10 μl of a dioxane solution containing 1 μmol of 5-methoxytryptamine and 1 μmol of tri-N-butylamine to 250 μCi (0.1 nmol) dried Bolton–Hunter Reagent (NEN, Boston, MA). The reaction was allowed to proceed for 1 hr before adding 50 μl of aqueous sucrose (16 gm/ml electrophoresis buffer) and purifying product by disc gel electrophoresis. Duplicate aliquots of 200 μl of each unknown and control sample were extracted into 2 ml of chloroform. The chloroform was removed in a SpeedVac centrifuge (Savant Instruments, Holbrook, NY) and resuspended in 200 μl of assay buffer (PBS, pH 7.4, containing 0.1% gelatin with 100 mg/l thimerosal as a preservative). The extracts were washed twice with 3 ml of petroleum ether and then evaporated to dryness in a SpeedVac before being resuspended in 200 μl of deionized water. Approximately 50,000 cpm of radiolabeled ligand and a 1:256,000 dilution of antiserum (R1055; bleeding date of 9/16/74) was added to each unknown and a triplicate twofold geometric series of standards ranging in concentration from 0.201 to 200 pg per 200 μl of assay buffer. The final assay volume of buffer in each tube was 400 μl. At the end of the 48 hr incubation period, 3 ml of 95% ethanol (4°C) was added to each assay tube, and the bound radioactivity was precipitated by centrifugation at 2000 × g for 30 min. The supernatant was decanted, and radioactivity in the precipitate was quantified. The quantity of melatonin immunoreactivity in the samples was calculated with the use of a computer program (M. L. Jaffe and Associates, Silver Spring, MD) (Davis et al., 1980). All solutions were maintained at 4°C throughout the radioimmunoassay procedure. Assay results were not corrected for recovery (which has proven to be >95% in independent trials). The minimum detection limit of the assay is 0.5–2.0 pg/ml.
Statistics. Two-tailed, paired Student's t tests were used to assess statistical significance of raw melatonin change from 2:00 to 3:30 A.M. Percent melatonin change scores were determined by the following formula:

 Percent melatonin change scores then were normalized to percent control-adjusted change scores by subtracting the control (no light) condition percent change scores for each subject from that same subject's light exposure score. This technique accounts for the normal individual rise or fall in plasma melatonin levels with respect to the light-induced changes (Gaddy et al., 1993; Brainard et al., 1997). For data from each wavelength, complete sets of preexposure melatonin values, percent melatonin change scores, and percent control-adjusted melatonin change scores were analyzed with one-way, repeated-measures ANOVA. Significant differences between groups were assessed withpost hoc Scheffe F tests with α set at 0.05. The group of single fluence–response curves (one for each wavelength) was fitted to a parametric model in which the melatonin response (Y) to a photon dose (X) is predicted by the following: the theoretical initialY-response (0 dose) for the curve (A1); the theoretical final Y-response (“infinite” dose) for the curve (A2); the dose producing a response halfway between A1 and A2 (X50 or ED50); and the slope estimator (p) for the slope of the curve between A1 and A2. The equation is as follows:
 The computer program Origin 6.0 (Microcal, Northampton, MA) was used to fit the fluence–response curves to the data. From extensive experience in our laboratory, a saturating 90 min light exposure produces a maximum mean percent control-adjusted plasma melatonin suppression ranging from 60 to 80% depending on the particular group of subjects being tested (Gaddy et al., 1993; Ruberg et al., 1996; Wang et al., 1999; Brainard et al., 2000a, 2001). To form an analytical action spectrum, it is necessary to determine whether all fluence–response curves can be fit to a univariant sigmoidal curve (Coohill, 1991; Lipson, 1994, 1999). To do this, sigmoid curves were fitted to the five fluence–response curves between 440 and 530 nm, which reached a mean percent control-adjusted melatonin suppression of 60–80% by constraining the A1 factor (theoretical initial Y-response) to 0 because no light exposure should yield a 0% control-adjusted plasma melatonin suppression. From this set of curves, a mean A2(theoretical final Y-response or “infinite” dose for the curve) and a mean p (slope estimator) was calculated. Subsequently, all eight data sets (including the data sets that did not reach saturation) were then fitted to sigmoid curves that constrained A2 and p to these means and constrained A1 to 0. Each calculated curve was tested for goodness-of-fit of the data by coefficient of correlation.
Melatonin action spectrum. This action spectrum was formed from the photon density, which elicited the half-saturation constant (ED50) of the percent control-adjusted melatonin suppression for each of the eight wavelengths. These half-saturation constants were derived from the eight univariant fluence–response curves described above. The half-saturation constants were then normalized to the maximum response and plotted as relative sensitivity. The relative quantum sensitivity from each group of subjects was then graphically plotted (quanta/wavelength) to illustrate the resultant action spectra for melatonin suppression in humans. A predicted peak sensitivity for this action spectrum was determined by fitting a vitamin A1-retinaldehyde photopigment template to the data by a modification of the method described by MacNichol et al. (1983). Specifically, the long wavelength limb of vitamin A1-based photopigments can be considered linear within the 10–90% sensitivity range when plotted on a frequency abscissa. To select the best fit vitamin A1template, the normalized 10–90% long wavelength melatonin ED50 data were fitted to a series of vitamin A1-based templates within the 10–90% sensitivity range of the long-wavelength limbs of the templates (Partridge and De Grip, 1991). Pearson correlation coefficients derived from fitting the melatonin data to the templates indicated the optimum fitting template.
RESULTS
Variations in pupillary dilation, exposure time, and melatonin assay
Individuals vary slightly in their pupil size and response to mydriatic agents. Mean ± SD pupillary dilation was 7.19 ± 0.88 mm for all 72 subjects across all nights of exposures. There were no significant pupil size changes during the light exposures. Similarly, there is a small degree of variability in exact light exposure durations attributable to slight experimental delays. Across 627 single-subject experiments, the mean ± SD exposure duration was 90.6 ± 2.1 min. A total of 53 assays were run to quantify melatonin in plasma samples collected during this project. Coefficients of variation calculated from control samples assayed as 19.2 and 90.0 pg/ml had 10.8 and 4.0% for intra-assay coefficients of variation, respectively. The inter-assay coefficients of variation were 13.5 and 10.2%.
Fluence–response data at 460 nm
Given that the predicted peak of the final action spectrum is 464 nm, the full data complement, from raw melatonin values to a final fluence–response curve for the nearby monochromatic stimulus at 460 nm, is illustrated in Figure 2. This fluence–response study at 460 nm was done with eight subjects (four males and four females). Across these subjects on all nights of testing, there were no significant differences (F = 0.70; p = 0.69) between sets of preexposure values, indicating that baseline nocturnal melatonin levels were consistent across the different nights of study. The top graph in Figure 2 shows the mean + SEM preexposure and postexposure (2:00–3:30 A.M.) melatonin values (mean range, 72.1–29.3 pg/ml). At 460 nm, exposure to irradiances of 2.3 μW/cm2 and lower did not significantly suppress plasma melatonin. In contrast, exposures of 3.1 μW/cm2 and higher elicited significant melatonin suppressions (p < 0.03 or less).

In the top two graphs, thebars represent group mean + SEM values of plasma melatonin relative to 460 nm monochromatic light exposure at different irradiances in one group of eight healthy subjects. Thetop shows plasma melatonin values before and after light exposure. There were no significant differences (F= 0.70; p = 0.69) across preexposure mean melatonin values. Light irradiances at or above 3.1 μW/cm2elicited significant melatonin suppression. The middleillustrates the subjects' plasma melatonin percent control-adjusted change scores. Progressively higher irradiance exposures at 460 nm produce progressively greater plasma melatonin percent control-adjusted change scores (p < 0.0001). Thebottom demonstrates the best-fit fluence–response curve for 460 nm exposures and percent control-adjusted melatonin suppression (R2 = 0.97). Each data point represents one group mean ± SEM.
For comparative purposes, all melatonin data were converted to plasma melatonin percent control-adjusted change scores. As illustrated in themiddle graph of Figure 2, one-way, repeated-measures ANOVA showed a significant effect of light intensity on plasma melatonin percent control-adjusted change scores (F = 14.92;p < 0.0001). Post hoc tests on plasma melatonin percent control-adjusted scores demonstrated that all intensities at or above 3.1 μW/cm2significantly suppressed melatonin more than the 0.012 μW/cm2 stimulus (p < 0.05 or less). Similarly, all irradiances at or above 12.1 μW/cm2 significantly suppressed melatonin more than the 1.5 μW/cm2 stimulus. Finally, both 24.2 and 42.2 μW/cm2 exposures elicited significantly higher plasma melatonin percentage of control-adjusted change scores compared with an irradiance of 2.3 μW/cm2.
The data from the middle graph of Figure 2 can be mathematically converted into a best-fit, sigmoidal curve that plots melatonin suppression against stimulus photon density. The specific formula for this curve is shown below and has a 0.97 coefficient of correlation (R2):
 As shown in the bottom illustration in Figure 2, this curve illustrates the fluence–response interaction between mean ± SEM melatonin percent control-adjusted change scores and the photon density of the monochromatic light.
Fluence–response data for all eight wavelengths
As shown in Figure 2, there is a clear, fluence–response relationship between graded photon densities of monochromatic 460 nm light and melatonin suppression. Data from each of the eight wavelengths tested in this study fit four-parameter sigmoidal curves with high coefficients of correlation. Specifically, wavelengths at 440, 460, 480, 505, 530, 555, 575, and 600 nm had respective coefficients of correlation (R2): 0.99, 0.97, 0.95, 0.97, 0.98, 0.92, 0.96, and 0.97. As described in Materials and Methods, to form an analytical action spectrum, all fluence–response curves must be fit to a univariant sigmoidal curve (Lipson, 1994; Coohill, 1999). The univariant curve model for the data in this study has the factors of A1 = 0, A2 = 66.9, andp = 1.27. Figure 3illustrates all eight univariant fluence–response curves from this study. As with previous circadian analytical action spectra (Takahashi et al., 1984; Provencio and Foster, 1995; Yoshimura and Ebihara, 1996), full-range fluence–response curves were not elicited above 550 nm. Despite this, standard photobiological curve-fitting methods could be used to fit the data from all eight wavelengths in the present study to univariant, sigmoidal functions. When fit to a univariant fluence–response curve with these factors, the data from exposures to 440, 460, 480, 505, 530, 555, 575, and 600 nm have high coefficients of correlation of 0.91, 0.95, 0.93, 0.94, 0.92, 0.90, 0.95, and 0.81, respectively.
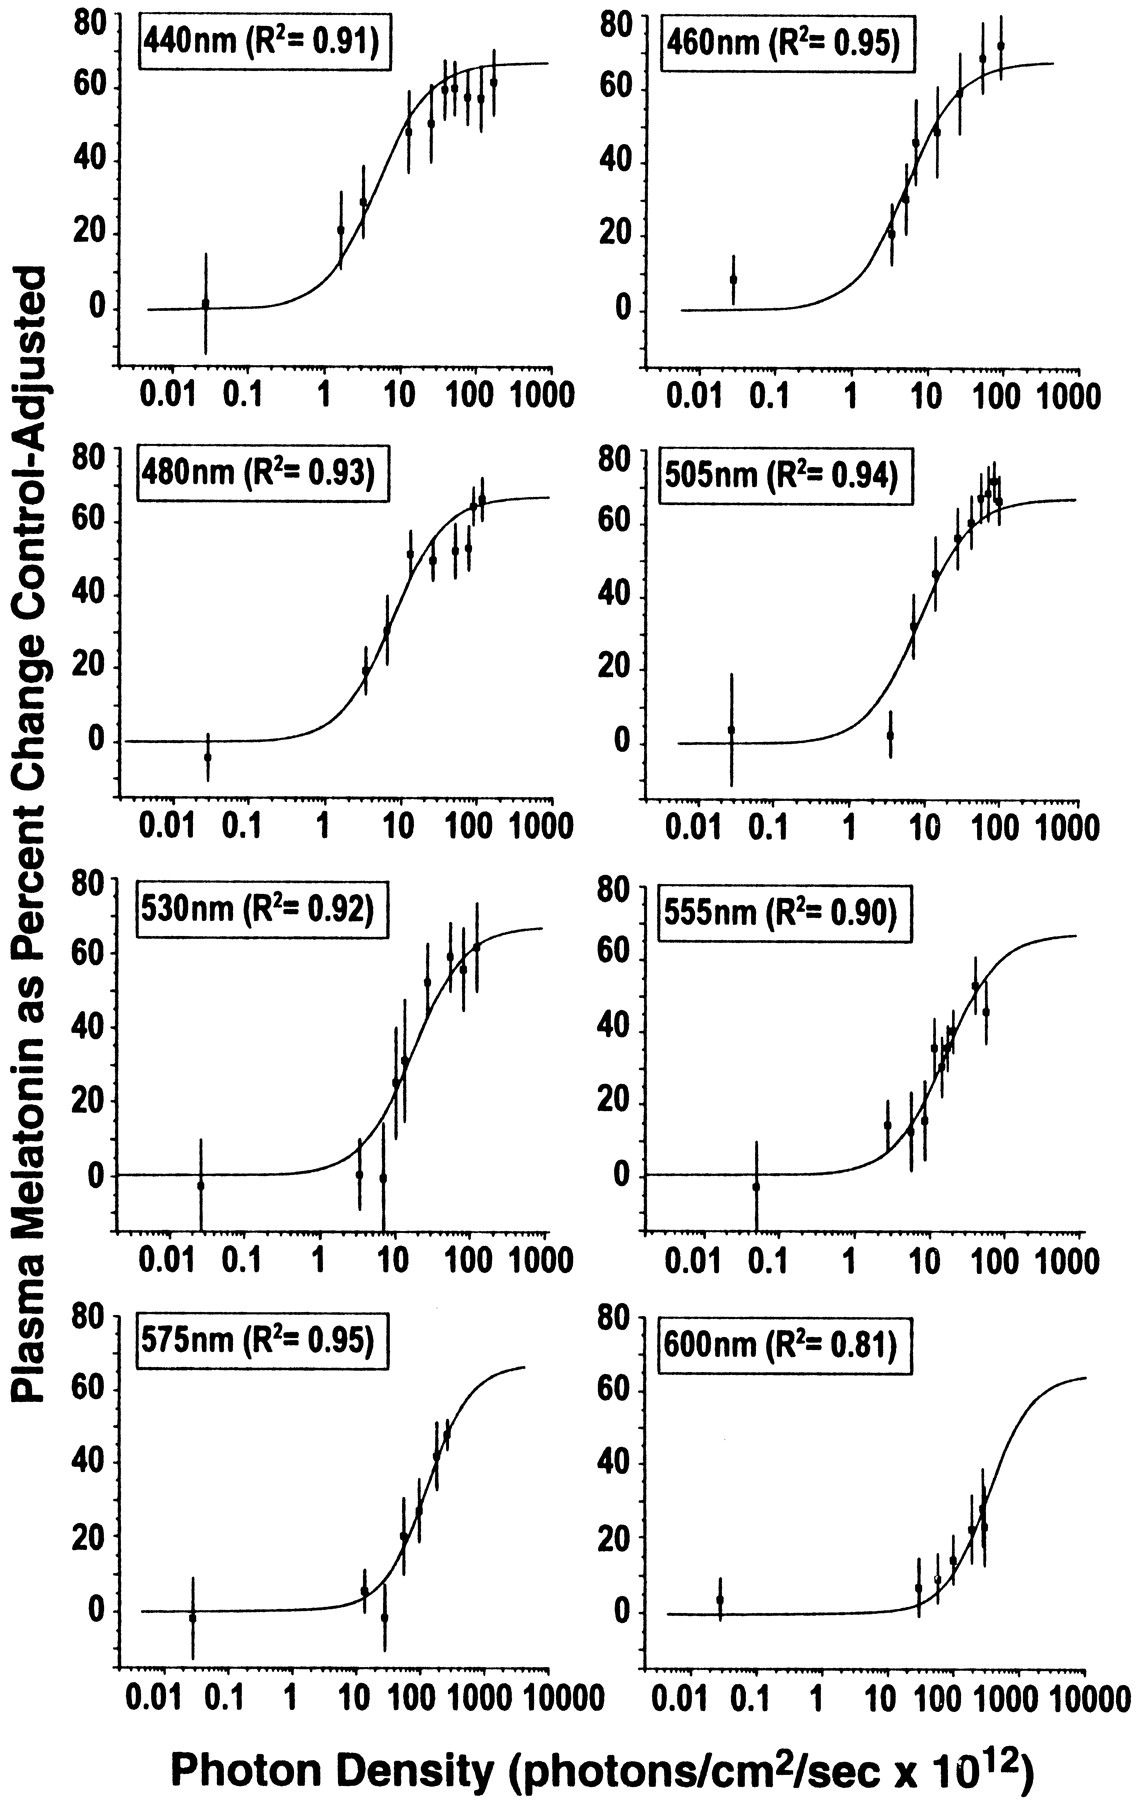
This figure illustrates the fitted univariant fluence–response curves for monochromatic light exposures and percent control-adjusted melatonin suppression for eight wavelengths of visible light. Each fluence–response curve is derived from eight healthy volunteers who participated in a complete, within-subjects experimental design. In each graph, the data points represent group means ± SEM. Each curve has a high coefficient of correlation (0.95–0.81).
Melatonin suppression response to 420 nm at a single intensity
Given the high sensitivity of subjects to short-wavelength light, as shown in Figure 4, it was determined that a probe of sensitivity to monochromatic light below 440 nm was needed. On the control night when the eight volunteers were exposed to darkness only, their raw mean melatonin levels at 2:00 and 3:30 A.M. were 69.4 and 76.0 pg/ml, respectively. That small increase was not statistically significant (t = −1.15;p = 0.29). As shown in Figure 4, when these volunteers were exposed to 420 nm light at 31.8 μW/cm2 (5.58 × 10¹³photons/cm2), raw mean melatonin levels at 2:00 and 3:30 A.M. were 76.4 and 47.6 pg/ml, respectively. That decrease in melatonin was statistically significant (t= 4.67; p < 0.003). For comparative purposes, this single melatonin suppression response was fitted to the univariant fluence–response curve formula used for all of the data in Figure 3. The resulting curve estimated a half-maximum (X50or ED50) melatonin suppression response for 420 nm of 1.83 × 10¹³photons/cm2.

In this graph, the bars represent group mean ± SEM plasma melatonin values before and after exposure to 31.8 μW/cm2 monochromatic light at 420 nm in eight healthy subjects. This light irradiance induced a significant melatonin suppression (p < 0.003).
Action spectrum for melatonin suppression
Action spectra are determined by comparing the number of photons required for the same biological effect at different wavelengths (Smith, 1989; Coohill, 1999). For this experiment, the action spectrum was formed from the photon density that elicited the half-saturation constant (X50 or ED50) of the percent control-adjusted melatonin suppression for each of the eight wavelengths. The half-saturation constants were derived from the eight univariant fluence–response curves shown in Figure 3 and the one estimated half-saturation constant from the data shown in Figure 4. The relative quantum sensitivity from each group of subjects was plotted in Figure 5 (quanta/wavelength) to illustrate the resultant action spectra for human melatonin suppression. When the data were aligned to the best-fit template for vitamin A1-retinaldehyde photopigments, this action spectrum predicted a peak spectral sensitivity (λmax) of 464 nm. There was a strong coefficient of correlation between the data and this fitted opsin nomogram (R2 = 0.91).

This graph demonstrates the action spectrum for percent control-adjusted melatonin suppression in 72 healthy human subjects. The filled circles represent the half-saturation constants of eight wavelengths from 440 to 600 nm that were normalized to the maximum response and plotted as log relative sensitivity. The open circle represents the estimated half-saturation constant derived from the 420 nm data. The solid curve portrays the best-fit template for vitamin A1 retinaldehyde photopigments, which predicts a maximal spectral absorbance (λmax) of 464 nm (Partridge and De Grip, 1991). There is a high coefficient of correlation for fitting this opsin template to the melatonin suppression data (R2 = 0.91).
Comparison of action spectra
The action spectrum for the photoreceptor system that provides input to the pineal gland appears to be distinct from the action spectra for the classical human visual photoreceptor systems. To illustrate this, the maximal spectral absorbencies and long wavelength limbs of the human rod and cone photoreceptors that support vision (Stockman and Sharpe, 1999) are illustrated in Figure6, along with the maximal spectral absorbance and long wavelength limb of the melatonin action spectrum. The shaded area around the melatonin action spectrum illustrates ±SD for this function.

This figure illustrates a comparison of the melatonin suppression and visual action spectra. The maximal spectral response and long wavelength limb of the melatonin suppression template is plotted along with the maximal spectral response and long wavelength limbs of the human rods and cones that support vision (Stockman and Sharpe, 1999). The shaded area around the 464 nm template represents ±SD from the data presented above.
DISCUSSION
The action spectrum presented here is based on univariant fluence–response curves for melatonin suppression by eight monochromatic light wavelengths in healthy subjects. These data fit a vitamin A1 opsin template with 446–477 nm, providing the strongest circadian input for melatonin regulation. These results suggest that a novel photopigment in the human eye may be primarily responsible for melatonin regulation and may be distinct from the individual rod and cone photoreceptors for vision.
In developing a fluence–response curve, a complete within-subjects experimental design produces the most reliable results. When subjects are studied over a 2–4 month period, however, lack of stability in the subjects' circadian entrainment can introduce variability in light-induced melatonin suppression. This study accepted only volunteers who reported regular bed and wake times, and their melatonin rhythms appeared to have been stable during the course of the study. As shown in the 2:00 A.M. melatonin values (Fig. 2, top), there were no significant differences between sets of preexposure values, indicating that baseline melatonin levels were consistent across the different study nights. This phenomenon has been documented for the 505 nm fluence–response group, as well as in other similarly controlled studies (Brainard et al., 1997, 2000a, 2001; Wang et al., 1998). This within-subject stability of the melatonin rhythm over time has been confirmed frequently in the literature (Waldhauser and Dietzel, 1985;Arendt, 1988, 1998).
The data from each of the eight wavelengths between 440 and 600 nm fit a univariant four-parameter sigmoidal curve with a high coefficient of correlation. The univariance of these curves is consistent with, but does not prove, the hypothesis that melatonin suppression is modulated by a single photoreceptor type. At this time, it is not certain that there is a univariant fluence–response function at 420 nm because only one intensity has been tested. It will be important to test for a full fluence–response curve at 420 nm to (1) clarify the precise sensitivity of the melatonin system to this wavelength and (2) determine if this wavelength is univariant with the fluence–response curves of the other eight wavelengths. Previous studies with animals and humans have illustrated similar fluence–response relationships for melatonin suppression and other circadian responses with monochromatic and broad-spectrum light (Brainard et al., 1983, 1988; Podolin et al., 1987; McIntyre et al., 1989; Nelson and Takahashi, 1991;Dkhissi-Benyahya et al., 2000; Zeitzer et al., 2000). The initial attempts to define circadian and neuroendocrine responses to photons of different wavelengths began with polychromatic action spectra, which tested single irradiances of broader light bandwidths in various rodent species. These polychromatic action spectra were reasonably consistent in indicating that the spectral region between 450 and 550 nm provides the strongest stimulation of circadian and neuroendocrine responses in rodents (for review, see Brainard et al., 1999a). Analytic action spectra, based on sets of fluence–response curves at different monochromatic wavelengths, are superior for identifying photoreceptors that mediate photobiological responses (Lipson, 1994; Coohill, 1999).
There are four analytic action spectra for circadian and neuroendocrine regulation in hamsters, rats, and mice (Takahashi et al., 1984;Bronstein et al., 1987; Provencio and Foster, 1995; Yoshimura and Ebihara, 1996). Data from these action spectra have been fitted to spectral sensitivity curves for retinal-based visual photopigments. This curve fitting is predicated on the assumption that a retinal-based molecule transduces light stimuli for circadian regulation and allows the prediction of the shape of the photopigment absorption spectrum, as well as its peak sensitivity (λmax). Across these studies, which used different circadian endpoints, the predicted λmax ranges from 480 to 511 nm and is surrounded by a broad region of high sensitivity. From these results, different photopigments have been suggested to be responsible for circadian regulation, including rhodopsin, a rhodopsin-like molecule, a middle wavelength cone photopigment, or an ultraviolet cone photopigment.
It is commonly believed that the photopic visual system has a peak wavelength sensitivity of ∼555 nm (Rodieck, 1998). Many investigators have hypothesized that the photopic visual system mediates circadian and neuroendocrine responses, because this part of the visual system is responsive to “bright” daytime levels of illumination. Previous data (Brainard et al., 2001) and those presented above do not support this hypothesis. The results clearly demonstrate that 555 nm is significantly weaker in suppressing melatonin compared with an equal photon density of 460 nm. Thus, the photopic system is not likely to be the primary input for circadian regulation. Demonstrating that the photopic visual system is not the principal phototransducer for melatonin regulation does not preclude it from having any role in circadian input. Indeed, recent studies suggest that visual cones may be involved in circadian regulation. Recordings from SCN neurons in rats indicate that the visual rods and cones provide input to cells of the rat SCN (Aggelopoulos and Meissl, 2000). Similarly, a human phase-shifting study suggests that, under some circumstances, the visual long wavelength-sensitive cone may also mediate circadian vision in humans (Zeitzer et al., 1997).
The data presented here do not support the hypothesis that any of the known visual photoreceptors provide the primary input for melatonin regulation. Figure 6 shows that none of the action spectra for individual visual photoreceptor systems match the action spectrum for melatonin suppression. If the photoreceptors that mediate vision in humans are not the primary photoreceptors for circadian regulation, what are the alternative candidates? Recent studies with various vertebrate species have identified several new molecules that may serve as circadian photopigments. These putative photopigments include both opsin-based molecules, such as vertebrate ancient opsin (Soni and Foster, 1997), melanopsin (Provencio et al., 1998), and peropsin (Sun et al., 1997), as well as non-opsin molecules, such as bilirubin (Oren, 1996) and cryptochrome (Miyamoto and Sancar, 1998). Among these new photopigments, only melanopsin has been specifically localized to the human neural retina (Provencio et al., 2000), and cryptochrome has been localized to the mouse neural retina (Miyamoto and Sancar, 1998). Cryptochromes have been studied extensively as circadian photoreceptors in plants and insects (Ahmad and Cashmore, 1993; Stanewsky et al., 1998) and have been proposed as circadian photoreceptors in mammals (Miyamoto and Sancar, 1998; Thresher et al., 1998). The contention that cryptochromes serve as circadian photoreceptors in humans or other mammals, however, remains controversial (Griffin et al., 1999; van der Horst et al., 1999; von Schantz et al., 2000).
The action spectrum presented here matches a vitamin A1-retinaldehyde photopigment template that supports the hypothesis that one of the new opsin photopigment candidates provides primary photic input for melatonin regulation in humans. The molecular identification of candidate opsin or non-opsin photoreceptors and their localization in the retina and/or neural components of the circadian system make them well suited to act as circadian phototransducers. However, functional data confirming any of these molecules as having a direct role in mammalian circadian photoreception is currently lacking. Furthermore, caution should be exercised in generalizing results from plants, insects, fish, amphibians, and rodents to humans.
Are the effects of light on melatonin suppression relevant to general circadian regulation? Studies have shown that hamsters have a higher intensity threshold for light-induced phase-shifts of wheel-running rhythms than for melatonin suppression (Nelson and Takahashi, 1991). Recently, however, a study on humans showed that the 50% response sensitivity for circadian phase shifting (119 lux) was only slightly higher than that for melatonin suppression (106 lux) with white light (Zeitzer et al., 2000). It is possible that there are separate photoreceptors for mediating circadian entrainment versus acute suppression of melatonin. It is reasonable, however, to hypothesize that a variety of nonvisual effects of light, such as melatonin suppression, entrainment of circadian rhythms, and possibly some clinical responses to light, are mediated by a shared photoreceptor system. Additional experiments are needed to test this hypothesis.
In general, relatively high light illuminances ranging from 2500 to 12,000 lux are used for treating winter depression, selected sleep disorders, and circadian disruption (Wetterberg, 1993; Lam, 1998). Although these light levels are therapeutically effective, some patients complain that they produce side effects of visual glare, visual fatigue, photophobia, ocular discomfort, and headache. Determining the action spectrum for circadian regulation may lead to improvements in light therapy. Total illuminances for treating a given disorder can be reduced as the wavelength emissions of the therapeutic equipment are optimized.
Modern industrialized societies use light extensively in homes, schools, work places, and public facilities to support visual performance, visual comfort, and aesthetic appreciation within the environment. Given that light is also a powerful regulator of the human circadian system, future lighting strategies will need to provide illumination for human visual responses, as well as homeostatic responses. The action spectrum presented here suggests that there are separate photoreceptors for visual and circadian responses to light in humans. Hence, new approaches to architectural lighting may be needed to optimally stimulate both the visual and circadian systems.
In conclusion, this study characterizes the wavelength sensitivity of the ocular photoreceptor system for regulating the human pineal gland by establishing an action spectrum for light-induced melatonin suppression. The results identify the 446–477 nm portion of the spectrum as the most potent wavelengths providing circadian input for regulating melatonin secretion. These data suggest that the primary photoreceptor system for melatonin suppression is distinct from the rod and cone photoreceptors for vision. Finally, this action spectrum suggests that there is a novel retinaldehyde photopigment that mediates human circadian photoreception. These findings open the door for optimizing the use of light in both therapeutic and architectural applications.
Footnotes
This work was supported by National Institutes of Health Grant RO1NS36590 and NASA Cooperative Agreement NCC 9-58 with the National Space Biomedical Research Institute (to G.C.B.) and National Science Foundation Grant IBN9809916 and Department of Defense Grant R070HY (to M.D.R.). Input from many individuals was invaluable to this project. We gratefully acknowledge the support and technical assistance of Christine Alocillo, Jon Cooke, William Coyle, James Gardner, Frank Giunpa, Rick Guyer, Robert Glasgow, John McDevitt, John Monnier, Charles Nelson, Jeff Santman, and Donna Wittkowski. We also deeply appreciate the assistance from Laine Brainard, Dr. Ignacio Provencio, Dr. Britt Sanford, and Dr. William Thornton in assessing the data, developing graphs, and reviewing this manuscript. The inspiration for this work came from the 281 series of the Edgar Cayce readings.
Correspondence should be addressed to Dr. George C. Brainard, Department of Neurology, Thomas Jefferson University, 1025 Walnut Street, Suite 310, Philadelphia, PA 19107. E-mail:george.brainard{at}mail.tju.edu.


