

Abstract
The accumulation of amyloid β protein (Aβ) in the Tg2576 mouse model of Alzheimer's disease (AD) was evaluated by ELISA, immunoblotting, and immunocytochemistry. Changes in Aβ begin at 6–7 months as SDS-insoluble forms of Aβ42 and Aβ40 that require formic acid for solubilization appear. From 6 to 10 months, these insoluble forms increase exponentially. As insoluble Aβ appears, SDS-soluble Aβ decreases slightly, suggesting that it may be converting to an insoluble form. Our data indicate that it is full-length unmodified Aβ that accumulates initially in Tg2576 brain. SDS-resistant Aβ oligomers and most Aβ species that are N-terminally truncated or modified develop only in older Tg2576 mice, in which they are present at levels far lower than in human AD brain. Between 6 and 10 months, when SDS-insoluble Aβ42 and Aβ40 are easily detected in every animal, histopathology is minimal because only isolated Aβ cores can be identified. By 12 months, diffuse plaques are evident. From 12 to 23 months, diffuse plaques, neuritic plaques with amyloid cores, and biochemically extracted Aβ42 and Aβ40 increase to levels like those observed in AD brains. Coincident with the marked deposition of Aβ in brain, there is a decrease in CSF Aβ and a substantial, highly significant decrease in plasma Aβ. If a similar decline occurs in human plasma, it is possible that measurement of plasma Aβ may be useful as a premorbid biomarker for AD.
- Alzheimer's disease
- neurodegeneration
- Tg2576 transgenic animal model
- amyloid β protein
- cerebrospinal fluid
- plasma
Amyloid β protein (Aβ), the principal protein in the senile plaques of Alzheimer's disease (AD), is an ∼4 kDa secreted polypeptide that is derived from several isoforms of a large protein referred to as the amyloid β protein precursor (βAPP) (Glenner and Wong, 1984; Masters et al., 1985; Kang et al., 1987). Secreted Aβ is readily detected in CSF, plasma, and in medium conditioned by a wide variety of cultured cells (Cai et al., 1993; Citron et al., 1994, 1997; Suzuki et al., 1994; Scheuner et al., 1996; Younkin et al., 1998). In each situation, most secreted Aβ is Aβ1–40, but a small percentage (5–15%) is Aβ1–42. Aβ1–42 is especially important in AD. Synthetic Aβ1–42 forms amyloid fibrilsin vitro much more readily than Aβ1–40 (Jarrett et al., 1993), and there is good evidence that Aβ1–42 is deposited early and selectively in senile plaques (Iwatsubo et al., 1994).
Early onset Alzheimer's disease can be caused by mutations in theAPP (Chartier-Harlin et al., 1991; Goate et al., 1991; Murrell et al., 1991; Mullan et al., 1992), presenilin 1 (PS1) (Sherrington et al., 1995), and presenilin 2 (PS2) (Levy-Lahad et al., 1995) genes. Studies of human plasma, human fibroblasts, transfected cells, and transgenic mice have shown that each of these genetic forms of AD either selectively increases the extracellular concentration of Aβ42 (Suzuki et al., 1994; Borchelt et al., 1996; Duff et al., 1996; Scheuner et al., 1996;Citron et al., 1997) or increases both Aβ42 and Aβ40 (Cai et al., 1993; Citron et al., 1994; Scheuner et al., 1996). Thus, in all of these genetic forms of AD, Aβ metabolism is altered in a way that fosters Aβ aggregation and deposition.
The Tg2576 mouse model of Alzheimer's disease (Hsiao et al., 1996) expresses the Swedish mutation of APP (APPK670N,M671L) at high level under control of the hamster prion protein (PrP) promoter. It is well established that this mutation causes concomitant increases in secreted Aβ42 and Aβ40 (Cai et al., 1993; Citron et al., 1994; Scheuner et al., 1996). As Tg2576 mice age, classic neuritic plaques with Congo red-positive amyloid cores appear that are similar to those seen in Alzheimer's disease (Irizarry et al., 1997). In addition, Tg2576 mice develop age-dependent behavioral deficits as assessed by Y maze, T maze, and Morris water maze testing (Hsiao et al., 1996; Chapman et al., 1999;Westerman et al., 2000).
To exploit the Tg2576 model of AD, it is essential to obtain baseline information on the amount and rate at which various forms of Aβ are deposited in the Tg2576 model compared with human AD. In this study, we obtain this information using an analytic paradigm that combines sandwich ELISAs, immunoblots, and immunocytochemistry based on antibodies to specific domains in the various forms of Aβ.
MATERIALS AND METHODS
Transgenic mice and extraction. Transgenic mice and nontransgenic littermates, bred by mating Tg2576 males with C57B6/SJL F1 females, were killed at 1–25 months (M). Plasma was collected in 0.1% EDTA, and CSF was obtained according to the method of Carp et al. (1971). One hemibrain was frozen in liquid nitrogen, and the other hemibrain was fixed in 4% paraformaldehyde with 0.1m phosphate buffer, pH 7.6. Plasma, CSF, and frozen brains were stored at −80°C. Frozen hemibrains were sequentially extracted. At each step, sonication (35 sec at level 10; XL-2000 Microson Ultrasonic Cell Disruptor; Misonix Inc., Farmingdale, NY) in an appropriate buffer was followed by centrifugation at 100,000 × g for 1 hr at 4°C. The supernatant was then removed, and the pellet was sonicated in the next solution used in the sequential extraction process. For four-step extraction, sonication of the frozen brain (150 mg/ml wet weight) began in Tris-buffered saline (TBS) (20 mm Tris and 137 mm NaCl, pH 7.6), which contained protease inhibitors (complete protease inhibitor cocktail, 1 tablet in 50 ml solution; Boehringer Mannheim, Mannheim, Germany). The next three sequential extraction steps used 1% Triton X-100 in TBS with protease inhibitors, 2% SDS in water with the same protease inhibitors, and 70% formic acid (FA) in water. For two-step extraction, the initial sonication of brain (150 mg/ml wet weight) took place in 2% SDS with protease inhibitors, and the resultant pellet was then extracted with 70% formic acid in water.
Antibodies. The following antibodies to Aβ were used: monoclonal, BAN-50 (anti-Aβ1–16), BA-27 (anti-Aβ1–40), BC-05 (anti-Aβ35–43), BNT-77 (anti-Aβ11–28), 4G8 (anti-Aβ17–24), and 6E10 (anti-Aβ1–16); polyclonal, 3160 (anti-Aβ1–40), Saeko (anti-C-terminal 30 amino acids of APP) (Kawarabayashi et al., 1996), and five antibodies described by Saido et al. (1995, 1996), which specifically detect N termini of Aβ, anti-AβN1(D), for the unmodified Aβ N terminus (N1(D)); anti-l-iso-Asp for isomerized forms of AβN1 (N1(iD)); anti-rectus Asp for stereoisomerized forms of AβN1 (N1(rD)); anti-AβN3-pyroglutamate (N3(pE)); and anti-AβN11-pyroglutamate (N11(pE)).
Sandwich ELISA for Aβ. Brain extracts were measured by sandwich ELISA as described previously (Suzuki et al., 1994; Gravina et al., 1995). The following systems were used: (1) BAN-50 capture and BC-05 or BA-27 detection or (2) 3160 capture and BC-05 or BA-27 detection, both of which detect Aβ1–42 and Aβ1–40, respectively, and (3) BC-05 or BA-27 capture and 4G8 detection, which detect Aβx-42 and Aβx-40, respectively. Direct comparison of many Tg2576 brains from mice of all ages showed that the amounts of Aβ42 and Aβ40 detected with 3160 capture ELISAs were essentially the same as when BAN-50 was used for capture. For measurement of plasma and CSF Aβ, BNT-77 capture and BC-05 detection was used for Aβ42, and BAN-50 capture and BA-27 detection was used for Aβ40.
The 2% SDS extracts were diluted at least 1:40 so that Aβ capture took place in EC buffer [0.02 m phosphate buffer, pH 7, 0.4 m NaCl, 2 mm EDTA, 0.4% Block Ace (Dainipponseiyaku, Suita, Osaka, Japan), 0.2% bovine serum albumin, 0.05% CHAPS and 0.05% sodium azide] containing 0.05% SDS. The TBS (at least 1:10) and Triton X-100 (at least 1:20) extracts were also diluted so that Aβ capture took place in EC buffer containing 0.05% SDS. Formic acid extracts were neutralized initially by 1:20 dilution into 1 m Tris phosphate buffer, pH 11, and then diluted as necessary in EC buffer. The program Softmax (Molecular Devices, Menlo Park, CA) was used to calculate Aβ concentration (in picomolar) by comparing the sample absorbance with the absorbance of known concentrations of synthetic Aβ1–42 or Aβ1–40 standards assayed identically on the same plate. Using the wet weight of brain in the original homogenate, the final values of Aβ in brain were expressed as picomoles per gram wet weight. Nontransgenic tissues were processed identically in parallel with the transgenic tissues.
Immunoblots. To detect SDS-soluble Aβ around the critical period (4M–10M) when deposition begins, SDS fractions were immunoprecipitated with 3160 by diluting 40 μl of each extract 40-fold with RIPA buffer (150 mm NaCl, 1% Triton X-100, 0.5% cholic acid, 0.1% SDS, and 50 mmTris, pH 8) containing protease inhibitors and immunoprecipitating with protein G-agarose that had been incubated with 1 μl of 3160. To detect SDS-soluble Aβ in 21M transgenic and AD brain, SDS fractions were directly applied to the gel. The formic acid fractions were evaporated using a Speed-Vac concentrator (Savant, Holbrook, NY), and dissolved in dimethyl sulfoxide. SDS and FA fractions were separated on 10–20 or 16% Tricine SDS gels (Novex, Wadsworth, OH) and electrotransferred to Immobilon P (Millipore, Bedford, MA) at 100 V for 1.5 hr. Membranes were labeled with primary antibody (BAN50 or 4G8) overnight at 4°C, incubated with horseradish peroxidase-linked secondary antibody (Amersham Pharmacia Biotech, Arlington Heights, IL) for 1 hr, and detected using Supersignal (Pierce, Rockford, IL). To detect full-length βAPP and C-terminal fragments, SDS fractions by two-step extraction were separated on 10% Tricine SDS gels and detected with Saeko anti-C-terminal antibody or 6E10.
Immunocytochemistry. Tissue samples were fixed in 4% paraformaldehyde in 0.1 m phosphate buffer, pH 7.6, for 8 hr at 4°C. Paraffin sections (5 μm) were pretreated with 70% formic acid for 5 min and immersed in 0.5% periodic acid for 10 min to block intrinsic peroxidase. They were then incubated with 1.5% blocking serum in PBS for 1 hr, with primary antibodies (BC-05, 0.1 μg/ml; BA-27, 0.4 μg/ml; or antibodies to specific N termini of Aβ, 2.5 μg/ml) overnight, and with horseradish peroxidase-conjugated secondary antibody (1:100; Dako, High Wycombe, UK) for 1 hr. Immunoreactivity was visualized by incubation with 0.03% 3,3′-diaminobenzidine, 0.065% sodium azide, and 0.02% H2O2. To stain anti-AβN1(D), anti-N1(iD), and anti-N1(rD), PBS containing 500 nmol/l NaCl was used to prevent cross-reaction. Methyl green was used for nuclear staining. Sections from seven AD brains were stained in parallel.
RESULTS
Human APP expression in Tg2576 mice is not confined to the brain
SDS extracts from Tg2576 brain were analyzed on immunoblots labeled with anti-C (Saeko), a rabbit polyclonal antibody that recognizes the C terminus of both human and mouse APP (Fig.1A), or with 6E10, a mouse monoclonal antibody specific for human APP (Fig.1B). The APP holoprotein and its 8–14 kDa C-terminal fragments (CTFs) were elevated in the brains of Tg2576 mice as expected and showed no increase in older mice (Fig.1A,B) as reported previously (Hsiao et al., 1996). SDS extracts of other organs from Tg2576 mice (10.9M) and their nontransgenic littermates (9.3M) were analyzed similarly (Fig. 1C–F). In nontransgenic mice, the level of endogenous mouse APP holoprotein was highest in brain and lung (Fig.1E), and none of the endogenous proteins in any mouse organ cross-reacted appreciably with the human-specific 6E10 antibody (Fig. 1F). In Tg2576 transgenic mice, human APP was present at high level not only in brain but also in spleen and lung (Fig. 1D). Moderate levels of transgenic human APP were present in Tg2576 heart, skin, bone, and muscle, and there was some human APP in pancreas, stomach, and large intestine (Fig.1D). Thus, transgenic APP expression is not confined to the brain in the Tg2576 mouse model of AD. The Aβ in various organs of 10.9M Tg2576 mice was analyzed by immunoprecipitation followed by immunoblotting. With this approach, Aβ was detected only in the brain (Fig. 1G). The more sensitive sandwich ELISA assays (Fig. 1H) were able to detect small amounts of SDS-extractable Aβ in all systemic organs (10–24 pmol/gm), but the amount of SDS-extractable Aβ in the brain was much larger (400 pmol/gm). Analysis of SDS-insoluble Aβ (formic acid extract of the pellet left after SDS extraction) in various organs from 10.9M Tg2576 mice showed that insoluble Aβ accumulates only in the brain (Fig.1G,H).

Expression of βAPP, CTF, and Aβ in brain and systemic organs of Tg2576 and nontransgenic mice. Immunoblots in A–F were labeled with anti-C (Saeko) (A, C, E), which detects both human and mouse βAPP, or with 6E10 (B,D, F), which specifically detects human βAPP. A, B, Immunoblots of βAPP and CTF in transgenic and nontransgenic mice of various ages (months). Immunoblots were prepared from 16% Tricine gels. C–F, Immunoblots of SDS extracts from systemic organs of a 10.9 month Tg2576 mouse (C, D) and a 9.3 month nontransgenic mouse (E, F). Immunoblots were prepared from 10–20% Tricine gels loaded at 20 mg/lane total protein. Tg, Transgenic;NTg, nontransgenic; Br, brain;H, heart; Lg, lung; Lv, liver; K, kidney; P, pancreas;Sp, spleen; St, stomach;Si, small intestine; Li, large intestine;M, muscle; Bo, bone; Sk, skin. G, Immunoblot of Aβ in SDS and FA extracts of systemic organs. The Aβ in SDS extracts (40 μl) was analyzed by 4G8 immunoprecipitation followed by immunoblotting with 4G8; FA acid extracts (40 μl), dried and resuspended, were also analyzed by immunoblotting with 4G8. H, Total Aβ (Aβ42 plus Aβ40) in SDS and FA extracts of systemic organs. Aβ42 and Aβ40 were analyzed by 3160/BC-05 and 3160/BA-27 ELISAs, respectively.
Cored plaques appear early in Tg2576 brain
At 7–8 months, dense cored plaques that contain both Aβ40 (BA-27) and Aβ42 (BC-05) appeared in the Tg2576 brain (Fig.2M,N). These early cored plaques were stained by Congo red and showed green birefringence with polarized light (data not shown). They increased between 7 and 10 months but, even at 10 months, only a few cores were present in each section (Fig.2K,L). At 12–15 months, diffuse plaques appeared that were labeled preferentially by the BC-05 antibody to Aβ42 (Fig. 2G–J). Between 15 and 23 months, Aβ plaques in the Tg2576 brain (Fig. 2C–H) accumulated to levels like those seen in AD brain (Fig.2A,B) as reported previously (Irizarry et al., 1997). Both meningeal and parenchymal blood vessels in the brain also showed progressive Aβ accumulation. The Aβ in blood vessels of the aging Tg2576 brain was preferentially labeled by the BA-27 antibody to Aβ40 (data not shown).

Immunohistochemistry of AD (A,B) and aging Tg2576 (C–P) brains. Serial sections of temporal cortex from AD brain and Tg2576 brains were labeled with BA-27, which is specific for Aβ40, or BC-05, which is specific for Aβ42. The age (months) of the Tg2576 brains is shown above the serial sections stained with BA-27 (top panel) and BC-05 (bottom panel). Aβ40 (stained by BA-27) and Aβ42 (stained by BC-05) are detected as dense microdeposits from 8 (M, N) to 12 (I, J) months. From 15 to 23 months (C–H), Aβ deposits increase in number and size and are detected both as cored plaques labeled by both BC-05 and BA-27 and as diffuse plaques, which are selectively labeled by BC-05. Sections are 5-μm-thick. Scale bar, 15 μm.
Most Aβ in normal mouse brain requires SDS for extraction
The brains of Tg2576 mice and nontransgenic littermates were extracted sequentially in TBS, 1% Triton X-100, 2% SDS, and 70% FA as described in Materials and Methods. The Aβ42 and Aβ40 in the supernatants produced by this four-step extraction were analyzed by 3160/BC-05 and 3160/BA-27 ELISAs, respectively (Table1). In normal nontransgenic and young transgenic mouse brains in which there is no Aβ deposition, most Aβ required SDS for solubilization and surprisingly little was extracted into TBS or Triton X-100. In 6 month Tg2576 mice, for example, the percentages of total Aβ extracted into TBS, Triton X-100, and SDS were 5% (0.7% Aβ42, 4% Aβ40), 28% (7% Aβ42, 21% Aβ40), and 67% (20% Aβ42, 47% Aβ40), respectively (Table 1). As expected, there was essentially no insoluble Aβ in normal mouse brain that required formic acid for solubilization.
Four-step extraction of Aβ in nontransgenic and Tg2576 transgenic mouse brain
Aβ that requires formic acid for extraction appears at 6–8 months in Tg2576 brain and increases with aging to a level like that seen in AD brain
It is well established that much of the Aβ deposited as amyloid in AD brain is resistant to SDS extraction and requires formic acid for solubilization (Roher et al., 1993). In the brains of 21 month Tg2576 mice, in which there are numerous amyloid-containing senile plaques (Fig. 2), there also was abundant Aβ that required formic acid for solubilization (Table 1). To track the time course of formation of this insoluble (formic acid-requiring) Aβ in Tg2576 mice, we used a simplified two-step extraction procedure in which brains were first extracted in 2% SDS and then in 70% formic acid. The results of our analysis of the resultant supernatants using 3160/BC-05 (Aβ42) and 3160/BA-27 (Aβ40) ELISAs are shown in Figure3. Aβ42 and Aβ40 first appeared in the FA fraction at ∼7 months (Fig. 3C,D). By 8–9 months, FA-requiring Aβ42 and Aβ40 appeared unequivocally in the brain of every Tg2576 mouse examined. Between 6 and 12 months, FA-requiring Aβ42 and Aβ40 increased exponentially, and both forms continued to increase substantially from 12 to 23 months, reaching levels like those seen in the AD brain (Gravina et al., 1995).

Aβ in aging Tg2576 brain. Aβ42 (A, C) and Aβ40 (B,D) were analyzed in Tg2576 brains sequentially extracted in 2% SDS (A, B) and 70% formic acid (C, D). The ELISA assay was 3160/BC05 for Aβ42 and 3160/BA27 for Aβ40. Note that the y-axes are logarithmic and that there was no detectable Aβ40 or Aβ42 in the formic acid extract of young (2–5 months) Tg2576 mice.
Remarkably, the unequivocal biochemical change that occurred between 6 and 10 months was accompanied by minimal immunocytochemical evidence of Aβ deposition, although isolated, cored plaques were observed in virtually every section on careful inspection (Fig. 2). Thus, biochemical assessment of brain Aβ is a sensitive way to quantitate the early AD-like changes that occur in Tg2576 mice.
The Aβ initially extracted into SDS decreases when FA-requiring Aβ first appears
The increase in FA-requiring Aβ that occurred between 6 and 10 months was accompanied by a small decrease in the Aβ extracted initially into SDS (Fig. 3A,B). Both declines were significant when analyzed by Spearman's rank correlation (Aβ42, p = 0.02; Aβ40,p = 0.003). In the four-step extraction (Table 1), in which TBS, Triton X-100, and SDS fractions were obtained before formic acid extraction, it was the TBS and Triton X-100 fractions that significantly decreased as FA-requiring Aβ appeared (Mann–Whitney comparison of 5M vs 7M; p = 0.009 for TBS Aβ42, TBS Aβ40, and Triton Aβ40; p = 0.05 for Triton Aβ42).
The percentage of Aβ in SDS and FA extracts of depositing Tg2576 and AD brain is influenced by the extraction procedure
The total amounts of Aβ42 and Aβ40 extracted by two-step and four-step protocols are virtually identical, although slightly more Aβ is extracted with the four-step method. In Tg2576 and AD brains, in which there is Aβ deposition, the relative amounts of Aβ extracted into SDS and FA with the two methods are considerably different. A much higher percentage of total Aβ is extracted into SDS in the four-step method. The relevant percentages in 21 month Tg2576 are 66.2% SDS versus 33.1% FA with the four-step extraction and 10.6% SDS versus 89.4% FA with the two-step procedure, and in AD brains, 81.5% SDS versus 18.2% FA with four-step and 13.8% SDS versus 86.2% FA with two-step extraction.
Compared with AD, Tg2576 brain has much less Aβ that is truncated or modified at its N terminus
In our previous examination of insoluble Aβ in 27 AD brains (Gravina et al., 1995), Aβ42 predominated in 70% and, in 33%, there was essentially no Aβ40 deposited. In the 30% in which Aβ40 was the predominant species deposited, there was typically prominent congophilic angiopathy. As shown in Table2, the amounts of total Aβ40 and Aβ42 deposited in Tg2576 brain most closely resemble the AD brains in which Aβ40 deposition predominates. In our previous study (Gravina et al., 1995), ELISAs for Aβx-42 (BC-05/4G8) and Aβx-40 (BA-27/4G8) showed that most of the Aβ in AD brain is N-terminally truncated or modified. This is not the case in Tg2576 mice (Table 2). In the brains of the oldest mice examined (21–23 month), the amount of insoluble Aβ detected by BAN-50 or 3160 capture was 95% of that detected with the BC-05/4G8 and BA-27/4G8 assays that can detect additional modified–truncated forms of Aβ. This indicates that, in Tg2576 brain, only 5% of insoluble Aβ is N-terminally truncated or modified, whereas in AD brain, the corresponding percentage is 69–85% (Table 2). Thus, it appears that N-terminally modified or truncated forms of Aβ, which predominate in AD brain (Saido et al., 1995, 1996;Hosoda et al., 1998), are minor species in Tg2576 brain that only begin to appear in very old mice.
Modified and unmodified Aβ in AD and Tg2576 mouse brain
The results obtained by sandwich ELISAs are confirmed by immunoblotting
Immunoblotting of the SDS and FA fractions obtained by two-step extraction (Fig. 4A–D) gave results that were consistent with the results from sandwich ELISAs performed on the same extracts (Fig. 3). SDS-insoluble 4 kDa Aβ labeled by both BAN-50 (Fig. 4B) and 4G8 (Fig.4D) appeared at 6–8 months and increased substantially by 10 months. To analyze the SDS-extractable Aβ, the SDS extracts were immunoprecipitated with 3160, a rabbit polyclonal antibody to Aβ1–40, and the immunoprecipitate was analyzed by immunoblotting with BAN-50 (Fig. 4A) or 4G8 (Fig.4B). As expected from ELISA analysis (Fig.3A,B), the total 4 kDa Aβ extracted into SDS decreased slightly between 6 and 8 months before beginning to increase substantially at 10 months (Fig.4A,C, arrowhead). βAPP CTFβ, which contains full-length Aβ, was detected by both BAN-50 (Fig. 4A, arrow) and 4G8 (Fig.4C, arrow) in the SDS extracts but not in the formic acid extracts (Fig. 4B,D). As expected, CTFβ in Tg2576 brain showed no change with aging.

Analysis by immunoblotting of early Aβ deposition in Tg2576 brain. Aβ in the SDS (A,C) and formic acid (B, D) extracts from 4–10 month Tg2576 brains was analyzed on immunoblots labeled with BAN-50 (anti-Aβ1–16) (A,B) and 4G8 (anti-Aβ17–24) (C,D). Proteins were separated on 10–20% Tricine gels, and each lane shows the Aβ in 40 μl of the formic acid or SDS extract as described in Materials and Methods. Immunoblotting was first performed with BAN-50. The blots were then stripped and reblotted with 4G8. Note that SDS-soluble Aβ decreases transiently at 8 months, when SDS-resistant, formic acid-soluble Aβ appears. The arrows identify CTFβ, and thearrowheads identify Aβ.
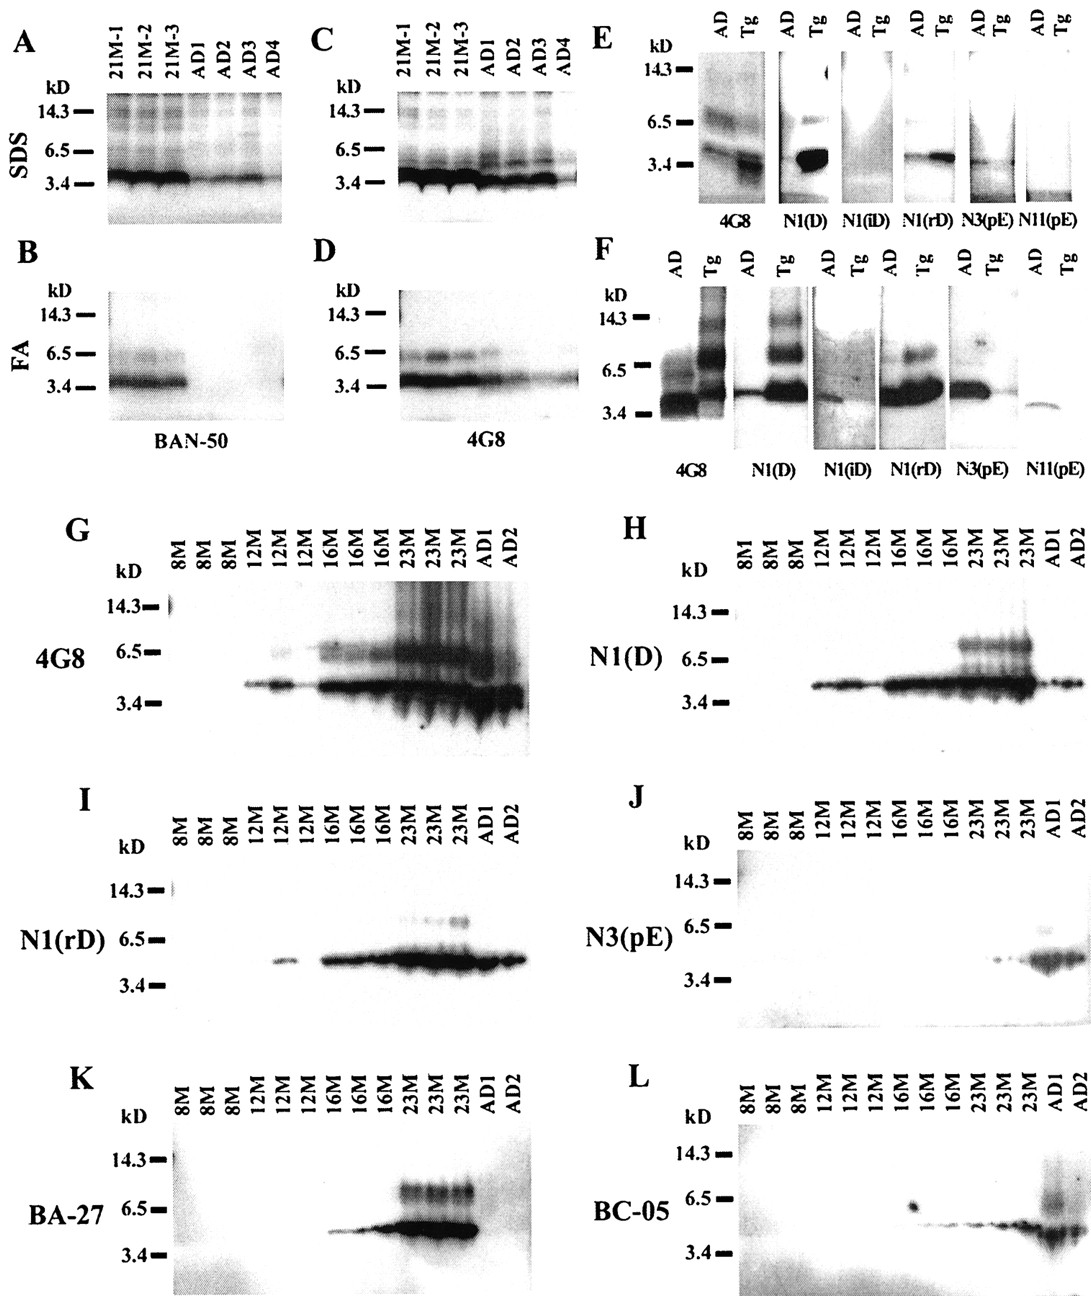
The full-length, unmodified Aβ in AD compared with 21 month Tg2576 brain was analyzed by immunoblotting two-step SDS and FA extracts (Fig.5A–D). In the FA extracts, BAN-50 (anti-Aβ1–16) detected abundant full-length 4 kDa Aβ in the three Tg2576 brains but almost nothing in any of the four AD brains examined (Fig. 5B), a result that is in good agreement with the ELISA data shown in Table 2. In contrast, 4G8 (anti-Aβ17–24), which recognizes both full-length Aβ and Aβ that is N-terminally truncated or modified, detected substantial amounts of Aβ in the FA extract of both Tg2576 and AD brains (Fig. 5D). Similarly, in SDS extracts, BAN-50 labeled far more 4 kDa Aβ in Tg2576 than in AD brains (Fig. 5A), whereas 4G8 labeled large amounts of Aβ in both Tg2576 and AD brains (Fig. 5C). It is noteworthy that the Aβ detected by 4G8 appeared to be slightly smaller in AD than in Tg2576 brain (Fig. 5C, and to a lesser extent D), consistent with the Aβ in AD brain being truncated at its N terminus.

Specific forms of Aβ in Tg2576 and AD brains.A–D, Immunoblot analysis of SDS (A,C) and formic acid (B, D) extracts of 21M Tg2576 mouse brains and AD brains labeled with BAN-50 (A, B) or 4G8 (C,D). Two microliters of the SDS or FA extract (dried and resuspended) were directly added to each lane; proteins were separated on 10–20% Tricine gels. E,F, Immunoblot analysis of SDS (E) and formic acid (F) extracts of AD and 23M Tg2576 brains labeled with the following: 4G8, which detects both N-terminally modified and unmodified Aβ; anti-AβN1(D), which detects the unmodified N terminus; anti-N1(iD), which recognizes isomerized forms (l-iso-Asp) of AβN1; anti-N1(rD), which detects stereoisomerized forms (rectus Asp) of AβN1; anti-AβN3(pE), which detects forms beginning with pyroglutamate at position 3; or anti-AβN11(pE), which recognizes forms beginning with pyroglutamate at position 11. The Aβ in 10 μl of SDS or FA extracts was examined on each lane. In the SDS extracts, Aβ was immunoprecipitated with the indicated antibody as described in Materials and Methods before separation and immunoblotting with the same antibody. In the FA extracts, Aβ was dried and resuspended as described in Materials and Methods before separation and immunoblotting. Proteins were separated on 16% Tricine gels.G–L, Time course of accumulation of formic acid-soluble Aβ in Tg2576 brains (8M–23M) and AD brains labeled with 4G8 (G), anti-N1(D) (H), anti-N1(rD) (I), anti-N3(pE) (J), BA-27 (K), or BC-05 (L). The Aβ in 10 μl of formic acid extract was examined on each lane, and proteins were separated on 16% Tricine gels.
The immunoblots in Figure 5A–D show that 4G8 and BAN-50 label Aβ oligomers that are present in both SDS and FA fractions from 21 month Tg2576 brains. Similar oligomers are observed in the SDS and FA extracts of AD brains. As shown in Figures 4A–Dand 5G, these oligomers are not detectable at 8 months but are definitely present by 12 months and increase substantially thereafter. Even with prolonged exposure, we have been unable to demonstrate oligomers in either SDS or FA extracts from brains in the critical 6–8 month period when Aβ aggregation begins.
BA-27, a monoclonal antibody that specifically detects the C terminus of Aβ40, and BC-05, which is specific for the C terminus of Aβ42, were used to analyze 6–23 month Tg2576 by immunocyochemistry (Fig. 2) and immunobloting (Fig. 5K,L). This analysis confirmed that Aβs terminating at both Aβ40 and Aβ42 accumulate in aging Tg2576 brain with Aβ40 predominating (Figs. 2,5K,L). In contrast, virtually all Aβ terminated at Aβ42 in the two AD brains examined (Fig. 5K,L), as occurs in ∼33% of AD cases (Gravina et al., 1995).
N-terminally modified Aβs accumulate in aging Tg2576 brain
Antibodies that detect specific N-terminal modifications of Aβ (Saido et al., 1995, 1996) were used to analyze 23 month Tg25676 brain by immunoblotting (Fig. 5E–J) and immunocytochemistry (Fig. 6). Comparison of 4G8, which detects virtually all Aβ regardless of modification, and anti-N1(D), which specifically detects unmodified Aβ, confirmed that most Aβ in AD brains is N-terminally modified or truncated (Fig.5G,H), whereas most Aβ in 8–23 month Tg2576 brains is unmodified (Fig. 5G,H and 6, N1(D) versus 4G8). Isomerized Aβ (N1iD) was labeled well in FA extracts of AD brain (Fig. 5F) and accumulated at a low level in 8–23 month Tg2576 brain (Fig. 6), but the amount of Aβ in Tg2576 brain was far less than in AD brain (Fig.5F). Stereoisomerized Aβ (N1rD) accumulated with aging between 8 and 23 months in Tg2576 brain and, at 23 months, was intensely labeled in Tg2576 brain (Figs. 5I, 6) as it was in AD brain (Fig. 5I). AβN3-pyroglutamate (N3(pE)) is a major form of Aβ in AD brain but a minor form in aged Tg2576 brain (Fig. 5J). Histochemical analysis (Fig. 6) showed that AβN3-pyroglutamate (N3(pE)) appears late in Tg2576 brain, accumulating between 16 and 23 months. AβN11-pyroglutamate was not detected in Tg2576 brains but was definitely detected in AD brain (Fig.5F). In both Tg2576 and AD brains, the N-terminally modified Aβs were more evident in the SDS-insoluble Aβ found in FA extracts (Fig. 5F) than in SDS extracts (Fig.5E). Collectively, these findings indicate that, with the exception of AβN11-pyroglutamate, N-terminal modifications or truncations of Aβ, which are thought to make Aβ more insoluble in human brain, also occur in the aging Tg2576 brain. With the exception of stereoisomerized Aβ, all of these modified forms are, however, far less abundant in Tg2576 than in AD brain.

Immunohistochemical analysis of modified forms of Aβ in aging Tg2576 brain. Serial sections (5 μm) of Tg2576 cerebral cortex were labeled with anti-N1(D), anti-N1(iD), anti-N1(rD), anti-N3(pE), and 4G8. The age of the mouse brain analyzed is shown at the top of each set of serial sections. Scale bar, 17 μm.
CSF and plasma Aβ decline as Aβ is deposited in the Tg2576 brain
It is well established that Aβ42 declines in the CSF of patients with typical late onset AD (Motter et al., 1995; Nitsch et al., 1995;Kanai et al., 1998; Andreasen et al., 1999), and this decrease could conceivably cause plasma Aβ42 to decline because CSF Aβ, which has a high concentration relative to plasma Aβ, is normally cleared into blood (Ghersi-Egea et al., 1996). To determine whether CSF and plasma Aβ decline in Tg2576 mice as Aβ42 and Aβ40 are deposited in the brain, we analyzed brain (Fig.7A,B), CSF (Fig. 7C, D), and plasma (Fig.7E,F) Aβ42 and Aβ40 in parallel. This analysis showed that, in aged Tg2576 brain, as in human AD brain, there is a decline in CSF Aβ42. This decline in CSF Aβ42 (p = 0.03) occurred in parallel with the marked increases in brain Aβ42 and Aβ40 that occur between 9 and 23 months, and it was accompanied by a decline in CSF Aβ40, although this decrease did not achieve significance. Remarkably, plasma Aβ42 (p = 0.008) and Aβ40 (p= 0.006) both showed highly significant decreases (Fig.7E,F) that paralleled the marked accumulation of brain Aβ and the decline in CSF Aβ that occurred between 6 and 23 months. To be sure that the declines in CSF and plasma Aβ that occur in aging Tg2576 mice are linked to Aβ deposition and not to aging alone, Aβ42 and Aβ40 were analyzed in CSF (Fig. 7G, H) and plasma (Fig.7I, J) of aging nontransgenic littermates (Fig. 7G, H). In these nontransgenic mice, there was no suggestion of a decline in Aβ because Aβ42 and Aβ40 both showed a slight upward trend in CSF (Fig. 7G,H) and plasma (Fig.7I,J) with aging.

CSF and plasma Aβ in Tg2576 mice decline as Aβ is deposited in the brain. Total brain Aβ42 (A) and Aβ40 (B) were assayed by 3160/BC05 or 3160/BA27 ELISAs, respectively; see also Figure 2 and Table 2. Tg2576 CSF and plasma Aβ42 (C, E) were assayed by BNT77/BC05 ELISA, and Tg2576 CSF and plasma Aβ40 (D, F) were assayed by BAN50/BA27 ELISA. Both nontransgenic (NTg) CSF and plasma Aβ42 (G, I) and Aβ40 (H, J) were assayed with BNT77 capture. The number of Tg2576 CSF samples assayed for the four time groups are 9, 9, 16, and 11, totaling 45. The number of Tg2576 plasma samples assayed for the four time groups are 30, 18, 64, and 19, totaling 131. The decline for CSF Aβ42 is significant (p = 0.02), and the declines for plasma Aβ40 and Aβ42 are highly significant (Aβ42, p= 0.008; Aβ40, p = 0.006; Spearman's rank correlation for the 6–23 month age range). The number of nontransgenic CSF samples assayed for the three time groups are 2, 2, and 6, totaling 10. The number of nontransgenic plasma samples assayed for the four time groups are 7, 6, 12, and 6, totaling 31.
DISCUSSION
As Tg2576 animals age, Aβ is altered beginning at 6–7 months with the appearance and subsequent increase of Aβ in the FA-extracted fraction. As insoluble (FA-requiring) Aβ appears at 6–9 months, the remaining Aβ in the brain (SDS-extracted in two-step, or TBS- and Triton-extracted in four-step) decreases slightly, suggesting that it is converting to an insoluble form. The definite biochemical change that occurs by 10 months in Tg2576 mice is accompanied by minimal histological evidence of Aβ deposition, although single plaque cores can be observed in many sections. From studies of trisomy 21 brains (Iwatsubo et al., 1994), it is generally believed that, in human AD, Aβ deposition begins with the formation of diffuse plaques. In Tg2576 brains, diffuse plaques are not observed in appreciable number until 12 months, 4 months after biochemically detectable alterations in Aβ have begun in every animal. Thus, there is an early period from 6 to 10 months in Tg2576 mice in which insoluble Aβ appears accompanied only by rare cored plaques.
Support for the view that there may be a similar early period in human brain comes from a study by Funato et al.(1998), who used the same ELISA system used here. They report that both SDS-dissociable and -insoluble forms of Aβ accumulate in human cortex, that insoluble Aβ correlates with amyloid load, and that its biochemical detection precedes plaque formation. They calculate that immunodetection of Aβ in human cortex requires 400 pmol/gm insoluble Aβ42 (or 200 pmol/gm in hippocampus) (Funato et al., 1998). These values are similar to those in 10-month-old Tg2576 mice, the time when plaques become evident.
Our immunohistochemical and biochemical analyses show that, from 10 to 21 months, there is a rapid increase in both diffuse and cored plaques in Tg2576 brain and a coordinate marked increase in SDS-dissociable and FA-requiring Aβ, with both the biochemical and histological changes rising to levels like those observed in human AD. In most AD patients, very little Aβ40 is deposited in the brain, but in ∼33%, extraordinary amounts of Aβ40 are deposited, and most of these patients show substantial amyloid angiopathy (Gravina et al., 1995). The Tg2576 model is like this latter group of AD patients in that there is marked congophilic angiopathy and the deposition of a large amount of Aβ40. It is not clear why large amounts of Aβ40 are deposited in the Tg2576 model. It may be that more than one factor contributes and that some combination of species, strain, promoter, expression level, and mutated transgene causes the large amount of Aβ40 deposition in this model.
Much of the Aβ in AD brain is N-terminally truncated or modified (Saido et al., 1995, 1996; Hosoda et al., 1998), and it has been suggested that the formation of SDS stable Aβ oligomers may be an early event in AD (Enya et al., 1999). Because N-terminally truncated or modified Aβ [especially forms beginning with pyroglutamate at position 3 (3pE)] and oligomers are resistant to proteolysis (Saido et al., 1996; Kuo et al., 1998), these modifications of Aβ are thought to be important for amyloid deposition. Our studies indicate that, in Tg2576 brain, it is full-length, unmodified Aβ that becomes insoluble initially. After this early period, oligomers and most modified forms (e.g., forms beginning at 3pE) appear, but at levels far below those observed in AD brain. It is not clear whether this late development and relative paucity of modified or oligomeric forms reflects the much shorter time over which Aβ aggregates in Tg2576 brain or is attributable to fundamental biochemical differences between the human and mouse brain. One intriguing possibility is that the Aβ modifications observed in the AD brain may play an important pathogenic role and that the relative paucity of these forms in Tg2576 brain may account for the minimal neurofibrillary pathology and neuronal loss observed in Tg2576 brain.
In Tg2576 mice, the APPK670N,M671L transgene is expressed at highest level in the brain, but there is also substantial expression in other organs (Fig. 1), although expression is driven by the hamster PrP promoter. Thus, in Tg2576 mice as in human subjects, plasma Aβ is likely to be derived from both peripheral organs and brain, where Aβ may enter the bloodstream either through the normal flow of CSF or by directly crossing CNS endothelium. In a previous study of human plasma (Scheuner et al., 1996), we showed that the Swedish APPK670N,M671L mutation increases both Aβ42 and Aβ40 and that other FAD-linked APP, PS1, and PS2 mutations selectively increase Aβ42. In that report, we suggested that cerebral Aβ deposition in FAD occurs because of an increase in CNS Aβ that develops as part of a generalized genetic effect that also increases plasma Aβ. We emphasized that Aβ deposition in FAD probably does not occur as a direct effect of increased plasma Aβ. We have reported previously a transgenic mouse line (NORβ 0304) that expresses an Aβ containing CTF of APP (Kawarabayashi et al., 1996). Because expression in NORβ 0304 is driven by the β-actin promoter, the transgenic APP CTF is expressed in all organs, and expression is much higher in many peripheral organs than in brain. Significantly, plasma Aβ is even higher in NORβ 0304 (1400 pm Aβ42; 5600 pmAβ40) than in Tg2576, but NORβ 0304 mice do not develop age-dependent Aβ deposition in brain. Thus, elevated plasma Aβ can be a good indicator that deposition will occur when it occurs as part of a generalized response in human subjects or in transgenic mice in which expression is under the control of a promoter such as PrP, which causes expression to be highest in brain. Elevated plasma Aβ does not directly drive deposition, however, because NORβ 0304 mice, which have a β-actin promoter that causes expression to be highest in the periphery, show no deposition, although they have higher plasma Aβ levels than the Tg2576 line.
We have shown recently that human plasma Aβ42 and Aβ40 increase with aging over age 65 and that plasma Aβ42 and Aβ40 are heritable traits that are increased in first degree relatives of patients with typical late onset AD (Younkin et al., 1998). These findings suggest that, in typical late onset AD as in early onset FAD, elevated plasma Aβ may be associated with the development of AD. If so, one would expect plasma Aβ to be elevated in typical late onset AD. Our initial analysis of typical AD patients (Scheuner et al., 1996) showed, however, that very few AD patients have high plasma Aβ42 when compared with age-matched controls. Other published studies of plasma Aβ in AD have shown no change or a slight increase in plasma Aβ42 (Iwatsubo, 1998; Matsubara et al., 1999). Because it is well established that CSF Aβ42 decreases in AD, one way to account for these negative results is to postulate that plasma Aβ42 also declines as AD develops. If so, then analysis of symptomatic late onset patients could miss many patients whose disease was initiated by increased Aβ in the presymptomatic period.
To test the hypothesis that plasma and CSF Aβ both decline as Aβ is deposited in the brain, plasma, CSF, and brain Aβ were analyzed coordinately in aging Tg2576 mice. This analysis showed that, coincident with the marked deposition of Aβ42 and Aβ40 in brain, there is not only a decline in CSF Aβ but also a substantial, highly significant decrease in plasma Aβ42 and Aβ40. If this also occurs in human subjects, then declining plasma Aβ could be a useful marker for subjects in whom there is cerebral Aβ deposition and who are, therefore, at risk for AD. Similarly, elevated plasma Aβ could be an excellent premorbid biomarker for AD, although it is not useful as a diagnostic marker, if it identifies those who are destined to deposit Aβ and those who are in the early stages of deposition.
Footnotes
This work was supported by National Institutes of Health Grant AG15453. We thank Dennis Dickson for help with immunocytochemistry, Virginia Phillips and Linda Rousseau for cutting sections, and Blaze Birinyi for technical assistance.
Correspondence should be addressed to Steven G. Younkin, Mayo Clinic Jacksonville, 4500 San Pablo Road, Jacksonville, FL 32224. E-mail:younkin{at}mayo.edu.


