

Abstract
Recent in vivo structural imaging studies have shown spatial and temporal patterns of brain maturation between childhood, adolescence, and young adulthood that are generally consistent with postmortem studies of cellular maturational events such as increased myelination and synaptic pruning. In this study, we conducted detailed spatial and temporal analyses of growth and gray matter density at the cortical surface of the brain in a group of 35 normally developing children, adolescents, and young adults. To accomplish this, we used high-resolution magnetic resonance imaging and novel computational image analysis techniques. For the first time, in this report we have mapped the continued postadolescent brain growth that occurs primarily in the dorsal aspects of the frontal lobe bilaterally and in the posterior temporo-occipital junction bilaterally. Notably, maps of the spatial distribution of postadolescent cortical gray matter density reduction are highly consistent with maps of the spatial distribution of postadolescent brain growth, showing an inverse relationship between cortical gray matter density reduction and brain growth primarily in the superior frontal regions that control executive cognitive functioning. Inverse relationships are not as robust in the posterior temporo-occipital junction where gray matter density reduction is much less prominent despite late brain growth in these regions between adolescence and adulthood. Overall brain growth is not significant between childhood and adolescence, but close spatial relationships between gray matter density reduction and brain growth are observed in the dorsal parietal and frontal cortex. These results suggest that progressive cellular maturational events, such as increased myelination, may play as prominent a role during the postadolescent years as regressive events, such as synaptic pruning, in determining the ultimate density of mature frontal lobe cortical gray matter.
Magnetic resonance imaging (MRI) studies of human brain maturation during the adolescent years have consistently shown subtle increases in total brain volume along with regionally variable patterns of reductions in gray matter volume and increases in total white matter volume (Jernigan et al., 1991; Reiss et al., 1996; Giedd et al., 1999; Sowell et al., 2001b). The spatial and temporal distribution of tissue density changes has also been mapped (Sowell et al., 1999a,b), revealing a pattern of maturational changes that is consistent with what would be expected given findings from postmortem studies of myelination (Yakovlev and Lecours, 1967; Benes et al., 1994) and synaptic pruning (Huttenlocher, 1979; Huttenlocher and de Courten, 1987). Specifically, a reduction in cortical gray matter density has been observed primarily in the dorsal parietal and some frontal regions between childhood and adolescence (Sowell et al., 1999b) along with an increase in white matter density in the posterior limb of the internal capsule and arcuate fasciculus (Paus et al., 1999). Results from an previous study by our group have shown dramatic acceleration in frontal and striatal gray matter density loss to occur during the postadolescent years along with a stabilization of regressive gray matter density changes in the parietal lobes (Sowell et al., 1999a). Maturation, particularly in the frontal lobes, has been shown to correlate with measures of cognitive functioning (Reiss et al., 1996; Sowell et al., 2001a).
Although there is some evidence from in vivo volumetric studies to suggest that continued brain growth during the adolescent years occurs in dorsal brain regions (Jernigan et al., 1991), a detailed spatial mapping of brain growth has not yet been accomplishedin vivo. In the present report, we use novel surface-based image analysis methods that allow us to assess relationships between gray matter density and late brain growth measured at the cortical surface. In previous studies, brain anatomy had been studied with volumetric methods in which inferences could typically be made only at the gross lobar level and with voxel-based methods (Wright et al., 1995) in which relatively crude anatomical matching techniques had been used to create statistical maps of differences between age groups. In the present report, we carefully match brain surface anatomy across individuals by defining cortical sulcal landmarks on brain surface renderings for each subject, thereby ensuring accurate localization of group differences relative to gyral landmarks. Understanding spatial and temporal relationships between brain growth on the one hand and tissue density changes on the other hand could help shed light on the biological processes contributing most to the brain maturation observed in previous volumetric structural MRI studies. Additionally, understanding the relationships between regional and temporal patterns of brain growth and cortical tissue density changes could provide additional insight into patterns of cognitive and affective development occurring during adolescence.
MATERIALS AND METHODS
Subjects. Fourteen children (7–11 years; mean age, 9.3 ± 1.3 years; 7 boys and 7 girls), 11 adolescents (12–16 years; mean age, 13.8 ± 1.6 years; 6 boys and 5 girls), and 10 young adults (23–30 years; mean age, 25.6 ± 2.0 years; 5 men and 5 women) were studied with MRI. All child and adolescent subjects were recruited as normal controls for a large, multidisciplinary neurodevelopmental research center. Age ranges for the child and adolescent groups were chosen because they correspond approximately to prepubertal and pubertal status, although no direct measures of hormonal states were collected. All children and adolescents were right-handed, and each was screened for neurological impairments and for any history of learning disability or developmental delay. Informed consent was obtained from all children and adolescents and their parents. The 10 young adult subjects were recruited as normal controls for neuropsychiatric studies of adult patient populations. These subjects were all right-handed and were thoroughly screened for medical, neurological, and psychiatric disorders. Although we did not specifically screen patients for perinatal complications or prematurity, which can result in brain morphologic abnormalities (Peterson et al., 2000), it is unlikely that significant perinatal complications were present in our participants, given that they denied any significant history of neurological or cognitive abnormalities during screening interviews. Informed consent was obtained from each subject. All of these subjects have been studied in previous reports (Sowell et al., 1999a,b).
Imaging protocol. The MRI protocol collected for each subject was a whole-brain, gradient-echo (spoiled gradient recalled acquisition in a steady state) T1-weighted series collected in the sagittal plane with repetition time of 24 msec, echo time of 5 msec, two excitations, flip angle of 45°, field of view of 24 cm, 124 slices with section thickness of 1.2 mm, no gaps, and an imaging time of 19 min.
Image analysis. MR images from each individual were processed with a series of manual and automated procedures that included the following steps: (1) automated linear transformation (Woods et al., 1993) of the images into a standard orientation with scaling to remove global differences in head size allowing assessment of local changes in brain size or tissue density; (2) classification of brain images into gray matter, white matter, and CSF (Kollokian, 1996;Sowell et al., 1999b); (3) removal of nonbrain tissue (i.e., scalp and orbits) and cerebellum from the transformed images; (4) automated extraction of the cortical surface for each individual (MacDonald et al., 1994); (5) tracing of 23 sulcal and gyral landmarks in each hemisphere on the cortical surface rendering of each individual (Sowell et al., 2001c); (6) estimating gray matter density or local gray matter proportion over the entire cortical surface of each individual's brain (Thompson et al., 2001); and (7) estimating relative local brain growth measured at each cortical surface point [i.e., the radial expansion or distance from the center (DFC) of the brain near the anterior commissure to each cortical surface point (Thompson et al., 2001)].
First, brain image volumes were transformed into standard International Consortium for Brain Mapping (ICBM)-305 space using a 12 parameter linear (with scaling), completely automated image registration algorithm (Woods et al., 1993). Semiautomated tissue segmentation was conducted for each volume data set to classify voxels based on signal value as most representative of gray matter, white matter, or CSF. A simple minimum distance classifier was used, because it had previously been shown to provide the best results (for this T1-weighted imaging protocol) in a qualitative comparison of different tissue segmentation algorithms. A detailed discussion of the reliability and validity of the tissue segmentation protocol has been published previously (Sowell et al., 1999b).
Each individual's cortical surface was extracted using automated software (MacDonald et al., 1994) that creates a spherical mesh surface that is continuously deformed to fit a cortical surface tissue threshold intensity value (signal value that best differentiates cortical CSF on the outer surface of the brain from the underlying cortical gray matter) from the brain volume aligned in standard ICBM-305 space (Mazziotta et al., 1995). The resulting cortical surfaces are represented as a high-resolution mesh of 131,072 triangulated elements spanning 65,536 surface points.
Image analysts (K.D.T. and E.R.S.) who were blind to subject gender and age drew each of 17 sulci [sylvian fissure, central sulcus, precentral sulcus, postcentral sulcus, and superior temporal sulcus (STS) main body, STS ascending branch, STS posterior branch, primary intermediate sulcus, secondary intermediate sulcus, and inferior temporal, superior frontal, inferior frontal, intraparietal, transverse occipital, olfactory, occipitotemporal, and collateral sulci] in each hemisphere on the surface rendering of each subject's brain. These sulci were chosen because they were the most readily identifiable in all subjects and because they covered most of the brain surface superiorly, inferiorly, and laterally, facilitating the whole-brain surface analyses. In addition to contouring the major sulci, a set of six midline landmark curves bordering the longitudinal fissure were outlined in each hemisphere to establish hemispheric gyral limits. Spatially registered gray-scale image volumes in coronal, axial, and sagittal planes were available simultaneously to help disambiguate brain anatomy. We have developed detailed criteria for delineating the cortical lines and for starting and stopping points for each sulcus using brain surface atlases as references (Ono et al., 1990; Duvernoy et al., 1991). These criteria have been described previously (Sowell et al., 2001c) and complete details of the written anatomical protocol can be obtained from the authors.
Points on the cortical surfaces surrounding and between the sulcal contours drawn on each individual's brain surface were calculated using the averaged sulcal contours as anchors to drive three-dimensional cortical surface mesh models from each subject into correspondence (Thompson et al., 2000, 2001). This allows the creation of average surface models for the various age groups and the creation of group average maps of various features of the brain surface such as DFC and gray matter density. The DFC measure was developed primarily to measure group differences in local growth. It is a measure of radial expansion measured from the center of the brain approximately at the midline decussation of the anterior commissure (i.e., x= 0; y = 0; and z = 0) to each of the 65,536 brain surface points. Note that the measure at each point for each individual is reflective of anatomical location in addition to radial expansion; thus only relative differences in DFC are meaningful in terms of growth. Given that the deformation maps (acquired during cortical surface matching) associate the same cortical anatomy in each subject, a local measurement of gray matter density (at each point over the surface of the brain) could be made for each subject in addition to the DFC measures and averaged across corresponding regions of cortex (Sowell et al., 2001c; Thompson et al., 2001). Briefly, a sphere with a radius of 15 mm centered at each cortical surface point was made and referenced to the same anatomical location in the gray matter maps for each subject derived previously in the tissue classification. The proportion of segmented gray matter pixels relative to the total number of pixels in this sphere was computed (at each point) and stored as a map of gray matter proportion (with values of 0.0–1.0) for each subject. The proportion of gray matter or gray matter density in each sphere in each individual is reflective, in part, of local cortical thickness that varies over different regions of the brain.
Finally, for some post hoc analyses, brain image volumes and surface renderings were transformed into standard space without scaling using manually selected anatomical landmarks. This was accomplished by delineating 80 standardized anatomical landmarks (40 in each hemisphere, the first and last points on each of 20 sulcal lines drawn in each hemisphere described above) in every individual and using a least squares rigid-body transformation to match each individual to the average of all individuals in the data set. In this way, every individual's brain was matched in space, but global differences in DFC remained intact. This step in the analysis was essential to ensure that our observations in the scaled image space were not attributable to confounds associated with normalizing brain size differences. (i.e., brain structural differences attributable to transformation rather than actual brain shape differences between groups). Because the transformation into ICBM-305 space was linear (for both scaled and nonscaled image transformations), brain shape was generally preserved, and all images and anatomical delineations were easily, automatically transformed between the nonscaled and scaled image data sets, thus eliminating any need for redundancy in detailed anatomical delineations.
Statistical analyses. After the basic preprocessing steps were conducted for each individual, statistical maps of differences between age groups (i.e., child vs adolescent and adolescent vs adult) were created for gray matter density and DFC in the scaled image data sets. In these analyses, the correlation (Pearson's r) between group membership and gray matter density or DFC at each brain surface point was calculated for the child versus adolescent comparison and the adolescent versus adult comparison. In all statistical maps, a surface point significance threshold of p = 0.05 was used to illustrate local changes in gray matter density or DFC. To correct for multiple comparisons (i.e., statistical tests at each of 65,536 surface points), subjects were randomly assigned to groups for 10,000 new correlational analyses (at each surface point), and the number of significant results (i.e., gray matter density or DFC at any surface point that significantly differed between groups at the threshold of p = 0.05) that occurred in the real group difference test was compared with the null distribution of significant results that occurred by chance in the permutation analyses. In other words, the threshold for assessing significance of statistical maps based on the permutation tests [whole hemispheres or within smaller regions of interest (ROIs)] was determined objectively by calculating the surface area (number of surface points) of significant effects in the real group difference test. That surface area within any tested ROI was used as the threshold for comparison with the random tests for that ROI, and if <5% (i.e., p < 0.05) of the results from random tests reached or exceeded the surface area of the real test, the statistical map (within ROIs or whole hemispheres) was considered significant. For the DFC analyses, total left and right hemispheres were assessed for overall growth or shrinkage with the permutation tests. Additionally, for the DFC group difference maps, an ROI was used to reduce the search area for effects in the permutation analyses. This was because we had a priori predictions that changes in DFC would be more likely to occur in regions of greatest gray matter changes. Because the greatest changes in gray matter density occur in the dorsal frontal cortex between adolescence and adulthood (Sowell et al., 1999a), this was the region that we targeted in the permutation analyses (all gray matter brain tissue anterior to the central sulcus and superior to the axial plane half the inferior–superior distance between the intersection of the precentral sulcus and the posterior extent of the inferior frontal sulcus and the intersection of the superior frontal sulcus and the precentral sulcus in each hemisphere). For the gray matter permutation analyses, total left and right hemispheres were assessed separately for the overall significance of gray matter density gain or loss.
To test the statistical significance of the difference between the maps for the child versus adolescent comparison and the adolescent versus adult comparison, maps of the difference between the correlation coefficients at analogous surface points for the two comparisons for gray matter density and the two comparisons for DFC were created using a Fisher's Z transformation (Cohen and Cohen, 1983).
The statistical map of the child versus adolescent differences in gray matter and the statistical map of the child versus adolescent differences in DFC in the scaled images were overlaid to qualitatively assess the spatial correspondence between changes with age in the two anatomical features (gray matter density and DFC). A Fisher'sZ transformation was used to statistically test the difference between the age–effect correlation coefficients for scaled gray matter and scaled DFC at each surface point. We predicted that the regions where an inverse relationship existed would appear the most different because correlation coefficients for gray matter would be most strongly negative (i.e., gray matter density loss) in the exact locations where the DFC age–effect correlation coefficients were most strongly positive (i.e., growth or increase in DFC). A similar set of analyses was conducted for the gray matter and DFC maps for the adolescent to adult contrasts. To assess relationships between changes in gray matter density and changes in DFC while correcting for multiple comparisons, we created one ROI that included all surface points where significant gray matter loss was observed (one for each hemisphere; Fig. 1, top, red regions) and one ROI that included all surface points where positive gray matter correlation coefficients were observed (Fig. 1, top, blue to pink regions) for the child to adolescent group comparison. We created similar ROIs for the adolescent to adult contrast and used permutations to test for positive and negative group differences in DFC within the gray matter ROIs. Finally, to assess general relationships between DFC and gray matter, a statistical map was created for all 35 subjects in whom gray matter density at each cortical surface point was assessed for correlations with DFC at each corresponding cortical surface point in the scaled images.
Post hoc analyses for DFC were also conducted for nonscaled brain image data sets in which we looked at the difference between groups in DFC in millimeters.
RESULTS
Regional and temporal patterns of gray matter density reduction
Statistical maps for gray matter density differences in the scaled image data sets (Fig. 1) between children and adolescents and between adolescents and adults reveal distinct patterns as expected given previous results from our laboratory (Sowell et al., 1999a,b). Between childhood and adolescence, local gray matter density loss is distributed primarily over the dorsal frontal and parietal lobes. Between adolescence and adulthood, a dramatic increase in local gray matter density loss is observed in the frontal lobes; parietal gray matter loss is reduced relative to the earlier years; and a relatively small, circumscribed region of local gray matter density increase is observed in the left perisylvian region. Again, these results are similar to those observed in the same subjects in previous studies in which different methods were used to assess gray matter density changes (Sowell et al., 1999a,b). Permutation tests confirmed that the overall amount of gray matter density reduction that occurs in the child to adolescent age range does not occur by chance (left hemisphere, p = 0.007; right hemisphere,p = 0.014). Gray matter density loss over the entire brain was highly significant between adolescence and adulthood as well according to the permutation tests (left hemisphere, p= 0.0001; right hemisphere, p = 0.002). Overall gray matter density gain was not significant in either age range according to the permutation tests. Unlike in our previous reports, here we mapped differences between the Pearson's correlation coefficients for the two gray matter age–effect comparisons, finally confirming that there are regions of accelerated gray matter loss in the postadolescent age range, primarily in the dorsal frontal cortices. Statistically significant deceleration in gray matter loss is also observed in various brain regions.

Gray matter density age effect statistical maps (left, right, andtop views) showing gray matter density changes between childhood and adolescence (A) and between adolescence and adulthood (B). Anatomically, the central sulcus and sylvian fissure are shown inblack. Shades of green toyellow represent negative Pearson's correlation coefficients (gray matter loss with increasing age), and shades ofblue, purple, and pinkrepresent positive Pearson's correlation coefficients (gray matter gain with age) according to the color baron the right (range of Pearson's correlation coefficients from −1.0 to 1.0). Regions shown in redcorrespond to correlation coefficients that have significant negative age effects at a threshold of p = 0.05 (gray matter loss), and regions shown in white correspond to significant positive age effects at a threshold ofp = 0.05 (gray matter density gain).C, Statistical map of the Fisher'sZ transformation of the difference between Pearson's correlation coefficients for the child to adolescent and the adolescent to adult contrasts (see color bar onright representing Z scores from −5.0 to 5.0). Shades of green to yellow represent regions where the age effects are more significant in the adolescent to adult contrast (B) than in the child to adolescent contrast (A). Highlighted inred are the regions where the difference between Pearson's correlation coefficients is statistically significant (p = 0.05). Shades of blue,purple, and pink represent regions where the age effects are more significant in the child to adolescent contrast than the adolescent to adult contrast. Highlighted inwhite are regions where these effects are significant at a threshold of p = 0.05.
The results are also shown in tabular format to help summarize the locations of significant gray matter density change. We list the number of clusters and the surface area in square millimeters of all significant surface points combined separated by hemisphere and by lobe (frontal, parietal, and temporo-occipital). Negative (gray matter density reduction) and positive (gray matter density increase) effects are shown separately. Table 1 represents gray matter density changes between childhood and adolescence and between adolescence and adulthood and corresponds to the statistical maps shown in Figure 1, A and B, respectively. Clusters are tabulated by lobe and by hemisphere, and negative and positive effects are shown separately. As shown, in the left hemisphere, gray matter loss is much greater in the frontal lobes between adolescence and adulthood than between childhood and adolescence, and left hemisphere parietal lobe gray matter loss is much more prominent between childhood and adolescence than between adolescence and adulthood. Differences between age groups are much less prominent in the right hemisphere, but as shown in the statistical maps in Figure 1B, there are regions of accelerated gray matter loss in the right hemisphere as well when group differences are assessed on a point-by-point basis.
Gray matter density reduction based on statistical maps shown in Figure 1
Regional and temporal patterns of brain growth
For the first time, in this report we show spatial and temporal maps of brain growth and surface contraction between childhood, adolescence, and young adulthood. It should be noted that because the brain surfaces were scaled to remove global size differences for these analyses, local brain growth and contraction observed in these maps must be considered relative to global differences in brain size between groups. Notably, the relative maps reveal little local growth (increased DFC) occurring between childhood and adolescence (Fig.2) once overall brain size differences are controlled. Permutation tests for age effects in DFC over the entire brain surface in the scaled image data sets were not significant between childhood and adolescence. It appears that some local surface contraction or shrinkage (decreased DFC) is occurring, however, in various regions over the dorsal cortex, most prominently in the parietal lobes where the surfaces of the adolescents' brains are closer to the center than the surfaces of the children's brains. When comparing the adolescents with the adults, the permutation test for positive age effects in DFC (i.e., growth) over the entire brain surface was significant (left hemisphere, p = 0.030; right hemisphere, p = 0.028), with various local regions of significant brain growth contributing to the overall significance of the DFC measure. Permutation tests for negative age effects (i.e., brain surface contraction) were not significant. Notably, during this age range there is some regional specificity with prominent local growth or increased DFC occurring in the dorsal aspects of the frontal lobes bilaterally in the same general region where we observed accelerated gray matter density reduction. When a region of interest was used to limit the search area of the permutation test to include only dorsal frontal cortex, the rather prominent continued local growth or increased DFC in this region was significant for the right hemisphere (p = 0.013) but not the left hemisphere (p = 0.132). Relative local growth has occurred in the dorsal frontal cortex such that once overall brain size differences are removed, the surface of the brain lies farther from the center in the adults than in the adolescents. Lateral growth also appears in the inferior, lateral temporo-occipital junction bilaterally where the brain surface is also significantly farther from the center of the brain in the adults than in the adolescents. Finally, some growth is also observed in the orbital frontal cortex, more prominent in the left hemisphere. Local relative shrinkage or decreased DFC is occurring in the lateral aspects of the frontal lobes, perhaps more in the left than the right hemisphere. The difference between correlation coefficients for the child to adolescent and adolescent to adult comparisons shown in Figure 2B confirms accelerated local growth in dorsal frontal regions in the older age range and accelerated local growth in the posterior temporo-occipital junction as well. Finally, there appears to be acceleration of the local shrinkage in the lateral aspects of the frontal lobes and deceleration of shrinkage or stabilization of these processes in the parietal lobes during the postadolescent years.

DFC age–effect statistical maps (left, right, and topviews) showing changes in DFC between childhood and adolescence (A) and between adolescence and adulthood (B). Anatomically, the central sulcus and sylvian fissure are shown in black. Shades ofgreen to yellow represent positive Pearson's correlation coefficients (increased DFC or brain growth), and shades of blue, purple, andpink represent negative Pearson's correlation coefficients (decreased DFC or shrinkage) according to the color bar on the right (range of Pearson's correlation coefficients from −1.0 to 1.0). Regions shown inred correspond to correlation coefficients that have significant positive age effects at a threshold ofp = 0.05 (brain growth), and regions shown inwhite correspond to significant negative age effects at a threshold of p = 0.05 (brain shrinkage).C, Statistical map of the Fisher's Ztransformation of the difference between Pearson's correlation coefficients for the child to adolescent and the adolescent to adult contrasts (see color bar on rightrepresenting Z scores from −5.0 to 5.0). Shades ofgreen to yellow represent regions where the age effects are more significant in the adolescent to adult contrast (B) than in the child to adolescent contrast (A). Highlighted in redare the regions where the difference between Pearson's correlation coefficients is statistically significant (p= 0.05). Shades of blue, purple, andpink represent regions where the age effects are more significant in the child to adolescent contrast than the adolescent to adult contrast. Highlighted in white are regions where these effects are significant at a threshold ofp = 0.05. Note the sign of the differences between contrasts is opposite to that in the difference map for the gray matter density contrasts because of the inverse relationship between gray matter density (negative effects) and late brain growth (positive effects).
The results are also shown in tabular format, where we list the central coordinates in ICBM-305 space, similar to Talairach coordinates (Talairach and Tournoux, 1988) and the area in square millimeters of each cluster of significant surface points observed in the statistical maps. Table 2 illustrates DFC differences between childhood and adolescence and between adolescence and adulthood and corresponds to the statistical maps shown in Figure 2, Aand B, respectively. Clusters are tabulated by lobe (frontal, parietal, and temporo-occipital) and by hemisphere, and negative and positive effects are shown separately.
DFC differences between childhood and adolescence and between adolescence and adulthood
Inverse relationship between growth and gray matter density changes
In Figure 3, relationships between gray matter density and DFC changes can be seen in the child versus adolescent and the adolescent versus adult comparisons. Notably, when comparing the adolescents with the adults, significant gray matter density loss in the frontal lobes is seen almost exclusively in locations where positive age effects for DFC are observed, with very little gray matter loss observed in frontal regions that are not growing in this age range. In this composite map, the regions of significant gray matter loss overlap nearly perfectly onto the regions of frontal lobe brain growth in the correlation map for DFC. It is interesting to note the correspondence in the distributions of these two features of brain development (brain growth and gray matter density reduction) despite their irregular shapes and patterns over the brain surface. Similar effects are observed in the child to adolescent comparison composite map, in which significant gray matter loss tends to be seen primarily in regions where growth is observed, although these effects are in different regions than those in the adolescent to adult age range. The difference between correlation coefficients for gray matter and DFC age effects indicate that the two phenomena are quite closely linked primarily in the frontal lobes in the older age range and more distributed over the frontal and the parietal lobes in the younger age range, statistically quantifying the similar appearance of the gray and DFC maps. A reverse pattern is observed in the left and right perisylvian cortex in the comparison between gray matter changes and DFC changes for the adolescent to adult comparison. In these regions, significant positive correlations are observed such that increased gray matter density is statistically associated with increased DFC.
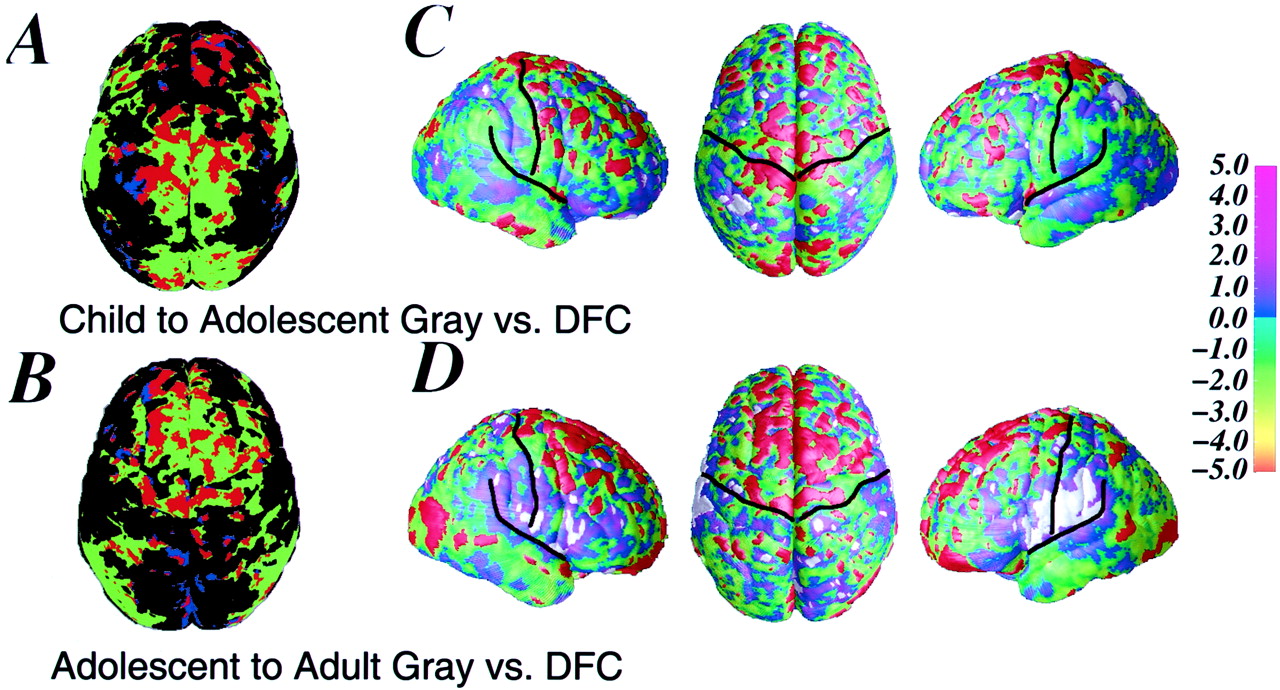
A, Composite statistical map (top view) showing the correspondence in age effects for changes in DFC and changes in gray matter in the child to adolescent contrast. Shown in green is the Pearson's correlation map of all positive correlation coefficients for DFC (also seen in Fig.2), and in blue is the probability map of all regions of significant gray matter loss (surface point significance threshold,p = 0.05, as shown in Fig. 1). Inred are regions of overlap in the gray and DFC statistical maps. B, Similar composite map for the adolescent to adult age effects. Note the highly spatially consistent relationship between brain growth and reduction in gray matter density. The shapes of the regions of greatest age-related change for the two maps (gray matter and DFC) are nearly identical in many frontal regions in the adolescent to adult contrast. Very few regions of gray matter density reduction fall outside regions of increases in DFC. C, D (left, right, andtop views), Difference between Pearson's correlation coefficients for the age effects for gray matter density and the age effects for DFC between childhood and adolescence (C) and between adolescence and adulthood (D). These maps are similar to those of the difference between correlation coefficients for age effects of gray matter and DFC shown in Figures 1 and 2 but instead highlight the correlation between regions of greatest change in the two separate features of brain maturation measured here (DFC and gray matter density). The color bar represents correspondingZ scores ranging from −5.0 to 5.0 for the difference between correlation coefficients for DFC and gray matter. Highlighted in red are regions of significant negative correlations between DFC and gray matter density (p = 0.05), showing that the relationship between regions of greatest gray matter density reduction are statistically the same as the regions with the greatest brain growth, particularly in the adolescent to adulthood years. Highlighted in white are the regions where the difference between correlation coefficients for the gray matter and DFC maps is positive, indicating that the change with age is in the same direction for both variables (i.e., increased DFC change goes with increased gray matter density change).
New permutation analyses were conducted in which we assessed for group effects in DFC within ROIs created from the gray matter statistical maps (positive and negative). Results from these analyses are presented in Table 3. In the child to adolescent analyses, trend-level significant increases in DFC are observed in regions of significant gray matter loss. An opposite pattern is observed in regions of gray matter increase, where DFC is significantly reduced in the adolescents relative to the children. Significantly increased DFC is observed in the regions of significant gray matter loss in the adolescent to adult group comparison, and significantly decreased DFC is observed in regions of gray matter gain during the same age range. These results confirm that gray matter density loss is observed in spatial and temporal conjunction with regions of brain growth.
DFC permutation analyses within gray matter ROIs
Across the entire age range between 7 and 30 years, DFC and gray matter density are highly negatively correlated such that those with a cortical surface that shows the most relative growth also have the least dense gray matter in the dorsal frontal and posterior parietal cortices (Fig. 4). No significant positive correlations between DFC and gray matter density were observed anywhere on the surface of the brain, suggesting that different biological processes may be associated with the shrinkage of the brain that occurs during this age range. Notably, growth in the posterior aspects of the temporo-occipital junction is not associated with gray matter density reduction, again suggesting distinct biological phenomena in these regions.

Statistical map of the correlation between gray matter density and DFC across all subjects studied. Anatomically, the central sulcus and sylvian fissure are highlighted. Shown in shades of blue, purple, andpink are regions where the correlation is positive (i.e., greater gray density associated with greater DFC), and in shades of green to yellow are regions where the correlation between DFC and gray matter density is negative. Highlighted in red are regions where the negative relationship is highly statistically significant (p = 0.000001). Note that none of the positive correlations between DFC and gray matter density was significant, even when p = 0.01 was used as a threshold.
Post hoc analyses of brain growth in nonscaled images
Post hoc analyses of brain growth in nonscaled images confirm the local or relative group differences in DFC observed in the scaled images (Fig. 5), particularly for the adolescent to adult comparison. The nonscaled maps show that continued brain growth does occur between adolescence and adulthood in the very dorsal-most aspects of the posterior frontal lobes bilaterally and in the posterior inferior temporal lobes bilaterally whether brain size differences are controlled or not. These results are quite robust despite the relatively large interindividual variability in total brain volume (Jernigan et al., 1991; Pfefferbaum et al., 1994) that could potentially obscure results in nonscaled data sets. As shown in Figure5, between adolescence and adulthood, large, diffuse regions of shrinkage or decreased DFC are observed in frontal and parietal regions surrounding the frontal and temporal growth areas, probably resulting from large increases in cortical CSF known to occur more prominently between adolescence and adulthood (Pfefferbaum et al., 1994). This is in contrast to the large regions of growth in frontal cortices between childhood and adolescence, with shrinkage occurring only in parietal and inferior temporal cortices bilaterally. These regions of growth and shrinkage were not as prominent in the analyses of scaled image data sets when overall differences in brain size were corrected. The analyses of nonscaled images do suggest that much of the progressive maturational change that leads to the subtle increase in total brain size occurs during the years between childhood and adolescence, with only relatively subtle growth yet to occur after adolescence in the dorsal frontal and posterior temporal cortices.

Differences between groups in DFC shown in millimeters in color (according to the color bar) between childhood and adolescence in both nonscaled (A) and scaled (C) image data sets. Differences between adolescents and adults are also shown in nonscaled (B) and scaled (D) images. Anatomically, the central sulcus and sylvian fissure are shown in black. The maps in the scaled image space allow an assessment of the magnitude (in millimeters) of differences in DFC shown as statistical maps in Figure 2. The samecolor bar applies to both nonscaled and scaled images; regions of brain growth between the younger and older age group tested are shown in dark blue, purple, andpink, and regions of shrinkage between the younger and older groups tested are shown in red,yellow, green, and light blue. Note that whether or not brain size correction is made with scaling, dorsal frontal and posterior temporal lobes show evidence for continued growth after adolescence. Other less robust regions of brain growth or shrinkage are “scaled” out when brain size correction is used to control individual differences.
DISCUSSION
In this report, for the first time we have mapped the spatial distribution of late brain growth and demonstrate that it does indeed continue in the frontal and posterior temporal lobes during the postadolescent years regardless of whether individual differences in global brain size are controlled. Interestingly, the anatomical regions within the frontal lobes where we see the most robust accelerated gray matter density loss are in precisely the same locations where we see the most robust continued postadolescent brain growth. This effect was confirmed with permutation tests. The strong correspondence in the age effects for gray matter density reduction and increased brain growth in frontal cortex may provide new insight for making inferences about the cellular processes contributing to postadolescent brain maturation. Regressive (i.e., synaptic pruning) and progressive (i.e., myelination) cellular events are known to occur simultaneously in the brain during childhood, adolescence, and young adulthood, both of which could result in the appearance of gray matter density reduction or cortical thinning on MRI.
A reduction in the number of synapses in the cortex could result in our observations of reduced gray matter density. On its own, this process would seem to have to result in a net brain volume loss (along with an increase in CSF). Notably, however, we have now shown local brain growth in the same regions where gray matter density reduction is occurring rather than brain shrinkage. An increase in the amount of myelin could also result in a reduction in the amount of brain tissue that has a gray matter appearance on MRI, given that nonmyelinated peripheral axonal and dendritic fibers do not have normal white matter signal values on T1-weighted MRI (Barkovich et al., 1988). Increased myelination would seem to necessarily result in a net brain volume increase, given that myelin consists of space-occupying glial cells (Friede, 1989). This would be consistent with the new data presented here of late growth in frontal cortex concomitant with the cortical gray matter density reduction. It is also possible that gray matter density reduction attributable to regressive factors and growth is occurring simultaneously such that the late growth presumably attributable to increased myelination fills in the space vacated by the reduction in synaptic density. Recent animal research has suggested that increased myelin is associated with neurite growth-inhibiting factors during critical periods for cortical plasticity (Schoop et al., 1997). This close temporal linkage between dendritic arborization–synaptic density changes and increased myelination could be consistent with our in vivo findings of cortical gray matter density reduction spatially concomitant with late brain growth.
Notably, significant decreases in DFC are also observed in regions of gray matter density increase whether these effects are assessed between childhood and adolescence or between adolescence and adulthood. Gray matter gain has been reported by another research group (Giedd et al., 1999), although the age range was younger than those reported here. Increased gray matter density could result from increased synaptic density (Kleim et al., 1996), increases in somal size, or perhaps even new cell generation (Gould et al., 1999). Animal studies have long shown increased dendritic arborization and cortical thickening as a result of enriched environmental experience (for review, see Diamond, 2001). However, none of these cellular events has been shown in postmortem or animal studies to occur as part of normative maturation during the adolescent years. It is not clear why brain shrinkage or decreased DFC would occur in conjunction with increased gray matter density. Again, it is possible that some relatively complex combination of progressive and regressive cellular changes are occurring simultaneously during the adolescent years, accounting for our observations. Postmortem and animal studies are needed to best interpret the cellular changes that might be associated with gray matter density increase during this age range.
In this report, we show a strong negative correlation between brain growth and gray matter density, particularly in the frontal and parietal lobes when all subjects between 7 and 30 years are examined. During this age range, the greater the brain growth in these regions, the less dense the gray matter in the cortex. Note the regional specificity of this effect given that similar phenomena are not observed in the perisylvian region or the posterior temporal and inferior parietal lobes. Together, these results suggest that different factors, perhaps variable combinations of regressive and progressive cellular events occurring simultaneously, influence regional patterns of brain growth and shrinkage at different stages of development. At some point in the developmental trajectory between birth and death, we would expect the negative relationship between brain growth and cortical gray matter density reduction to reverse, in which cortex that is reducing in density because of degenerative changes (i.e., cell death) would result in brain shrinkage (decreased DFC). The changes we observe here are likely maturational in nature and may be related to pubertal and hormonal changes that occur during the adolescent years. We might expect different factors to affect relationships between brain size and tissue density at different stages of development, but because we did not measure pubertal status in our child and adolescent subjects, we are unable to directly measure its potential influence on brain changes. Additional studies with older participants and careful assessment of hormonal status will be needed to address these issues.
Examination of the spatial and temporal patterns of brain growth, brain shrinkage, and cortical thinning over time may help explain the cognitive and behavioral changes that occur during this age range in addition to helping us further understand relationships between different cellular maturational events. Stabilization of changes in the parietal cortex appears first, where more shrinkage and greater gray matter thinning are occurring between childhood and adolescence than between adolescence and adulthood. Later in development, there is brain growth corresponding to cortical thinning in the dorsal frontal region, the region of the brain known to develop latest in terms of myelination and synaptic density (Yakovlev and Lecours, 1967; Huttenlocher and de Courten, 1987). As described in our previous report of postadolescent changes in gray matter density (Sowell et al., 1999a), it is likely that the visuospatial functions typically associated with parietal lobes are operating at a more mature level earlier than the executive functions typically associated with frontal brain regions. The new findings described here may suggest that cortical thinning or reduction in gray matter density is first accompanied by growth (as seen the frontal lobes in the postadolescent years) and later by brain shrinkage as the regressive changes overtake the progressive changes (as seen earlier on in the parietal lobes). Perhaps gray matter density reduction associated with growth (presumably increased myelination) is associated with different aspects of improved cognitive functioning than the cortical thinning associated with brain surface contraction (presumably synaptic pruning). It may not be unreasonable to hypothesize that improved accuracy (i.e., improved cognitive task performance) may result from regressive changes such as synaptic pruning, given that unused or less efficient synaptic connections are being pruned away during this age range (Huttenlocher, 1979). On the other hand, increased efficiency (i.e., reduced reaction times) might result from increased myelination observed as brain growth, given that myelinated fibers improve the conduction speed of electrical impulses between various brain regions. By looking at brain growth and gray matter density at the cortical surface simultaneously, we can test these hypotheses and parse out the relative contributions of these various factors to functional and structural brain maturation. Future studies should also use diffusion tensor imaging (Pierpaoli et al., 1996) as an approach to disentangle increased white matter from synaptic loss, because increased myelination would increase the local diffusion anisotropy, whereas synaptic pruning should not increase the directional preference of water diffusion.
Table 1 shows that gray matter loss at the cortical surface is most prominent in the frontal lobes between childhood and adolescence as well as between adolescence and adulthood, somewhat in contrast to our previous report, in which we showed gray matter density reduction to be most prominent in the parietal lobes between adolescence and adulthood (Sowell et al., 1999b). In that report, we looked at gray matter density throughout the entire brain to the depths of each sulcus, not just at the cortical surface as we have here. We also used anatomical landmarks on the brain surface to match anatomy across subjects in the present report. Perhaps poorer intersubject image registration in the previous report was masking some of the frontal lobe gray matter density reduction at the cortical surface observed here between childhood and adolescence. Nonetheless, results reported here do show a robust increase in gray matter density reduction within the frontal lobes and a decrease in parietal lobe gray matter density reduction occurring during the postadolescent years, consistent with our previous reports (Sowell et al., 1999a,b).
Using the methods described here, it is possible to find smaller regions of gray matter density gain and loss (or growth and shrinkage) within the same larger lobar regions typically measured in volumetric studies (Jernigan et al., 1991; Reiss et al., 1996; Giedd et al., 1999;Sowell et al., 2001b). For example, there are regions of gray matter density gain (Fig. 1, blue regions in the frontal lobe) distributed in close proximity to regions of gray matter density loss (Fig. 1, green and red regions in the frontal lobe) over the frontal cortex between childhood and adolescence. Generally the regions of gray matter density gain do not reach statistical significance on a point-by-point basis as do the regions of significant gray matter loss, and permutation tests suggest only significant gray matter density loss during the age range studied. As discussed above, this may be inconsistent with volumetric results from another group, which show gray matter volume increases in some brain regions between 4 and ∼12 years (Giedd et al., 1999). However, in our own volumetric studies with the same children and adolescents studied here, we did not see evidence for a gray matter volume increase (Sowell et al., 2001b). Notably, our youngest subjects were 7 years old, and it is possible that the most robust gain in gray matter observed by the other research group occurred before 7 years, which could account for the discrepancy in results. It is also possible that, in sum, the small regions of gray matter density gain could overtake the gray matter density loss in magnitude to result in a subtle net volume gain. This effect would be difficult to measure quantitatively (given that gray matter is averaged over several millimeters of cortex at a time), but it is important to note that volume changes in particular tissue compartments within specified ROIs will not necessarily be directly reflected in the tissue density measures over the entire cortical surface of the same region. It is primarily this increased spatial resolution for detecting age effects that motivated the use of surface-based rather than the more traditional volumetric methods in the present study.
The results presented in this report of local brain growth and gray matter density are clearly quite complex and are primarily interpreted in relation to previous findings in the same subjects. Given the nature of the methods used, with numerous multiple comparisons for each statistical map presented, great care must be taken in interpreting results shown in statistical maps. Permutation tests confirm the overall significance of the gray matter and DFC statistical maps. To test regional hypotheses, we used permutation tests within regions of interest based on our a priori hypotheses to ensure that we would not make type I errors in our interpretation. Changes in DFC were predicted within the frontal lobes, where we saw increased gray matter density reduction in our previous reports (Sowell et al., 1999a,b). Our results of late brain growth in the dorsal frontal cortex are also consistent with what would be expected from the cognitive behavioral literature, which shows improved frontal lobe functioning during adolescence (Passler et al., 1985). Notably, regions of late brain growth in the lateral posterior temporal lobes were not predicted and are interpreted more cautiously. In a previous study, we saw evidence for increased sulcal asymmetry in the posterior sylvian fissure, which was related to increased gray matter density in the same region (Sowell et al., 2001c). It is possible that these structural changes are functionally significant and, given their anatomical location, related to improvement in language skills that occurs throughout adolescence. Additional studies in new subject samples will be required to confirm these results and to assess relationships among cognitive function, late brain growth, increased sulcal asymmetry, and increased gray matter density in the perisylvian brain region.
Footnotes
This study was supported by National Institute of Mental Health Grant 5T32 MH16381, by National Science Foundation Grant DBI 9601356, by National Center for Research Resources Grant P41 RR13642, by National Institute of Neurological Disorders and Stroke Grant NS38753, and by the pediatric supplement of the Human Brain Project, funded jointly by National Institute of Mental Health (NIMH) and National Institute on Drug Abuse Grant P20 MH/DA52176 to A.W.T. and NIMH Grant K01 MH01733 to E.R.S. We acknowledge Terry Jernigan for efforts in collecting the image data used here and for editorial comments on a previous version of this report.
Correspondence should be addressed to Dr. Elizabeth R. Sowell, Laboratory of Neuro Imaging, University of California Los Angeles, 710 Westwood Plaza, Room 4–238, Los Angeles, CA 90095-1769. E-mail:esowell{at}loni.ucla.edu.


