

Abstract
The purpose of this study was to systematically map the forelimb area of primary motor cortex (M1) in rhesus macaques in an effort to investigate further the organization of motor output to distal and proximal muscles. We used stimulus-triggered averaging (StTAing) of electromyographic activity to map the cortical representation of 24 simultaneously recorded forelimb muscles. StTAs were obtained by applying 15 μA stimuli to M1 sites while the monkey performed a reach and prehension task. Motor output to body regions other than the forelimb (e.g., face, trunk, and hindlimb) was identified using repetitive intracortical microstimulation to evoke movements. Detailed, muscle-based maps of M1 revealed a central core of distal (wrist, digit, and intrinsic hand) muscle representation surrounded by a “horseshoe”-shaped zone of proximal (shoulder and elbow) muscle representation. The core distal and proximal zones were separated by a relatively large region representing combinations of both distal and proximal muscles. On the basis of its size and characteristics, we argue that this zone is not simply the result of stimulus-current spread, but rather a distinct zone within the forelimb representation containing cells that specify functional synergies of distal and proximal muscles. Electrode tracks extending medially from the medial arm of the proximal muscle representation evoked trunk and hindlimb responses. No distal or proximal muscle poststimulus effects were found in this region. These results argue against the existence of a second, major noncontiguous distal or proximal forelimb representation located medially within the macaque M1 representation.
Using intracortical microstimulation (ICMS) (Asanuma and Sakata, 1967) to evoke movements or electromyographic (EMG) responses in monkeys, several studies have described a central core of distal forelimb muscle representation surrounded by a proximal forelimb muscle representation in the primary motor cortex (M1) (Kwan et al., 1978a,b; Strick and Preston, 1978,1982a; Gould et al., 1986; Hepp-Raymond, 1988; Nudo et al., 1992, 1996;Stepniewska et al., 1993; Karrer et al., 1995; Nudo and Milliken, 1996). In macaque monkeys, Kwan et al. (1978a,b) concluded that the M1 representation of forelimb muscles is organized as concentric rings in which the intrinsic hand muscles are represented as a central core surrounded by rings of increasing diameter representing the wrist, elbow, and shoulder muscles.
After injecting the fluorescent tracers fast blue and diamidino yellow into different segmental levels of spinal cord in pig-tailed macaques to label forelimb corticospinal neurons supplying proximal (C2–C4 injections) and distal (C7–T1 injections) motoneuron pools, He et al. (1993) found evidence consistent with the existence of a central core of distal (wrist, digit, and intrinsic hand) muscle representation, largely contained within the wall of the precentral gyrus, surrounded by a “horseshoe”-shaped proximal (shoulder and elbow) muscle representation that was open at the area 3a/4 boundary. In addition, they suggested the existence of noncontiguous second representations of distal and proximal forelimb muscles in M1 (He et al., 1993, their Fig. 18). These second representations appeared to be located medial to the medial arm of the core proximal forelimb representation. However, there currently is no electrophysiological evidence of major noncontiguous distal and proximal forelimb representations within M1 of macaque monkeys. Multiple representations have been demonstrated electrophysiologically within the core primary distal forelimb representation in squirrel monkeys as alternating bands of wrist and digit muscles with differing sensory input. The caudal bands of wrist and digit representation receive input predominantly from cutaneous receptors, whereas the rostral bands receive input from deep receptors (Strick and Preston, 1978, 1982a,b).
Therefore, the purpose of this study was to systematically map the forelimb area of M1 in an effort to further investigate motor output organization and the issue of multiple noncontiguous representations of distal and proximal muscles. To maximize the potential for detecting multiple representations, we recorded EMG activity from 24 different forelimb muscles simultaneously while the monkey performed a movement task (Park et al., 2000). Stimulus-triggered averaging (StTAing) of EMG activity was used to detect the latency and strength of output effects on individual muscles (Cheney and Fetz, 1985; Cheney, 1996). The resulting motor output maps of M1 show a central core of distal muscle representation surrounded by a horseshoe-shaped proximal muscle representation, confirming the findings from corticospinal labeling studies (He et al., 1993). However, there was no evidence of a second, major distal or proximal forelimb representation within M1 of rhesus macaques. In addition, a large zone producing effects in both proximal and distal muscles separated the pure distal muscle core from the surrounding pure proximal muscle zone.
MATERIALS AND METHODS
Behavioral task. Data were collected from two male rhesus monkeys (Macaca mulatta; ∼9 kg, 6 years old). The monkeys were trained to perform a reach and prehension task requiring coactivation of multiple proximal and distal forelimb muscles in natural, functional synergies. Training procedures and the behavioral task have been described in detail previously (Belhaj-Saı̈f et al., 1998; McKiernan et al., 1998). Briefly, during each data collection session, the monkey was seated in a custom primate chair and placed in a sound-attenuating chamber. The left forelimb of the monkey was restrained during task performance, whereas the right forelimb had freedom of movement. The monkey was guided in performance of the task by audio and video cues provided by an IBM-compatible computer. The monkey initiated the task by placing its right hand on a pressure plate located at waist height directly in front of him. Having the hand on the plate for a preprogrammed length of time triggered the release of a food reward and a “go” signal. The monkey then reached out to a small food well located at shoulder level, a little less than one arm length away and oriented ∼20° from vertical. The monkey used a precision grip to extract a food pellet from the well and bring the pellet to its mouth. The task was completed by returning the hand to the pressure plate.
Surgical procedures. On completion of training, each monkey was implanted with a cortical recording chamber and EMG electrodes. For all implant surgeries, the monkeys were tranquilized initially with ketamine, administered atropine, and subsequently anesthetized with isoflurane gas. Both monkeys received prophylactic antibiotic before and after surgery and analgesic medication postoperatively (Park et al., 2000). All surgeries were performed in a facility accredited by the Association for Assessment and Accreditation of Laboratory Animal Care using full sterile procedures. All procedures conformed to the Guide for the Care and Use of Laboratory Animals, published by the United States Department of Health and Human Services and the National Institutes of Health.
A magnetic resonance imaging (MRI)-compatible plastic chamber allowing exploration of a 30-mm-diameter area (see Fig.3A,B) was stereotaxically implanted over the forelimb area on the left hemisphere of each monkey as described previously (Kasser and Cheney, 1985; Mewes and Cheney, 1991;McKiernan et al., 1998). The chambers were centered at anterior 21.6 mm, lateral 11.4 mm (monkey M), and anterior 16.0 mm, lateral 7.4 mm (monkey D), at a 30° angle to the midsagittal plane. For MRI compatibility, titanium screws (Bioplate, Los Angeles, CA) and titanium restraining nuts (McMaster-Carr, Chicago, IL) were used. In addition, a titanium screw (Synthes, Monument, CO) in contact with the dura served as a reference ground for electrophysiology.
EMG activity from 24 muscles of the forelimb was recorded using pairs of multistranded stainless steel wires (Cooner Wire, Chatsworth, CA) implanted during a sterile surgical operation. One monkey was implanted using a modular subcutaneous implant technique, and the other was implanted using a cranial subcutaneous implant technique. These procedures were described in detail previously by Park et al. (2000). Briefly, for both techniques, pairs of wires for each muscle were tunneled subcutaneously to their target muscles. The modular subcutaneous implant technique used four connector (ITT Canon, New Britain, CT) modules, two placed above and two below the elbow. The cranial subcutaneous implant technique used one circular connector (Wire Pro Inc., Salem, NJ) module placed near the cortical recording chamber. The wire insertion points for specific muscles were identified on the basis of external landmarks and palpation of the muscle belly. The wires of each pair were bared of insulation for ∼2 mm at the tip and inserted into the muscle with a separation of ∼5 mm. We tested proper placement by stimulating electrically through the wires with short trains or single pulses while observing the evoked movements. The wires were removed and reinserted if necessary.
EMGs were recorded from five shoulder muscles: pectoralis major (PEC), anterior deltoid (ADE), posterior deltoid (PDE), teres major (TMAJ), and latissimus dorsi (LAT); seven elbow muscles: biceps short head (BIS), biceps long head (BIL), brachialis (BRA), brachioradialis (BR), triceps long head (TLON), triceps lateral head (TLAT), and dorso-epitrochlearis (DE); five wrist muscles: extensor carpi radialis (ECR), extensor carpi ulnaris (ECU), flexor carpi radialis (FCR), flexor carpi ulnaris (FCU), and palmaris longus (PL); five digit muscles: extensor digitorum communis (EDC), extensor digitorum 2 and 3 (ED23), extensor digitorum 4 and 5 (ED45), flexor digitorum superficialis (FDS), and flexor digitorum profundus (FDP); and two intrinsic hand muscles: abductor pollicis brevis (APB) and first dorsal interosseus (FDI). At regular intervals, the monkeys were tranquilized with ketamine, and the implants were tested to confirm electrode location.
Data recording. For cortical recording and stimulation, we used glass- and mylar-insulated platinum–iridium electrodes with typical impedances between 0.7 and 1.5 MΩ (Frederick Haer & Co., Bowdoinham, ME). Electrode penetrations were made systematically in precentral and postcentral cortex in a 1 mm grid interval. In some areas, electrode tracks were placed in the center of the 1 mm square formed by four adjacent tracks to achieve greater spatial resolution. The electrode was advanced with a manual hydraulic microdrive, and stimulation was performed at 0.5 mm intervals, starting from the first cortical electrical activity encountered. In some tracks, stimulation was performed at 0.25 mm intervals. Cortical electrical activity and EMG activity were simultaneously monitored along with task-related signals.
While the monkey performed the reach and prehension task, stimuli (15 μA at 15 Hz) were applied through the electrode and served as triggers for computing StTAs. Individual stimuli were symmetrical biphasic pulses: a 0.2 msec negative pulse followed by a 0.2 msec positive pulse. EMGs were digitized at a rate of 4 kHz, and averages were generally compiled over a 60 msec epoch, including 20 msec before the trigger to 40 msec after the trigger. Stimuli were applied throughout all phases of the reach and prehension task, and the assessment of effects was based on StTAs of at least 500 trigger events. Segments of EMG activity associated with each stimulus were evaluated and accepted for averaging only when the average of all EMG data points over the entire 60 msec epoch was ≥5% of full-scale input. This prevented averaging segments in which EMG activity was minimal or absent (McKiernan et al., 1998).
At some stimulation sites, averages were computed at 30 μA if no poststimulus effects (PStEs) were obtained at 15 μA. When no PStEs were detected with 30 μA, repetitive ICMS (R-ICMS) was performed to determine the motor output representation, if any, from that site. R-ICMS consisted of a train of 10 symmetrical biphasic stimulus pulses (negative–positive with total duration of 0.4 msec) at a frequency of 330 Hz (Asanuma and Rosén, 1972) and intensity of 15 and/or 30 μA. Evoked movements and muscle contractions detected with palpation were noted.
Data analysis. At each stimulation site, averages were obtained from all 24 muscles. Poststimulus facilitation (PStF) and suppression (PStS) effects were computer-measured as described in detail by Mewes and Cheney (1991). The focus of this study was on maps of PStF effects; hence, PStS effects were excluded. Nonstationary, ramping baseline activity (Lemon et al., 1986) was routinely subtracted from StTAs using custom analysis software. Mean baseline activity and SD were determined for the average of EMG activity in the pretrigger period consisting of the first 12.5 msec of each average. StTAs were considered to have a significant PStF effect if the envelope of the StTA crossed a level equivalent to 2 SD of the mean of the baseline EMG for a period ≥0.75 msec. Onset and offset latencies of PStF were defined as the points at which the envelope of the StTA crossed a level equivalent to 2 SD of the mean of the baseline EMG. The peak of each effect was defined as the highest point in PStF between the onset and offset latencies.
The strengths of PStF effects were categorized as follows. Peaks <2 SD of baseline and peaks that remained >2 SD for <0.75 msec period were considered insignificant, and the average was categorized as having no effect (Fig. 1A). Weak PStF effects had peaks >2 SD of mean baseline activity but ≤5 SD of mean baseline activity (Fig. 1B). Moderate and strong effects had peaks >5 SD and, for the purposes of this study, were lumped together (Fig. 1C). Our maps were based on either moderate and strong effects alone or moderate and strong effects combined with weak effects.

Examples of stimulus-triggered averages of rectified EMG activity (15 μA at 15 Hz) illustrating the criteria used for categorizing the strength of poststimulus facilitation (PStF) effects. Time 0 corresponds to the stimulus event used as a trigger for averaging. A pretrigger period of 12.5 msec (baseline) was used to determine mean baseline activity (mean) and SD for each average.A, Peaks <2 SD of baseline and peaks that remained >2 SD for <0.75 msec period were considered insignificant, and the average was categorized as having no effect. B, Weak effects had peaks >2 SD of mean baseline activity but ≤5 SD of mean baseline activity. C, Moderate and strong effects had peaks >5 SD of mean baseline activity. LAT, Latissimus dorsi; FDI, first dorsal interosseus;APB, abductor pollicis brevis. The numberof trigger events is given in parentheses.
Magnetic resonance imaging and analysis. MRI was used for confirmation of electrode track locations rather than actual histology, because the monkeys are part of another ongoing study. MRI studies were performed ∼5 months after the cortical recording chamber implant but before the EMG implant. The monkeys were tranquilized with ketamine and atropine and subsequently anesthetized with isoflurane gas. To give the magnetic resonance (MR) images a reference framework, a custom-designed chamber cap filled with MR opaque marker (liquid vitamin E) was used to identify the x and y axes [anterior–posterior (A-P) and medial–lateral (M-L) axes, respectively] of the cortical recording chamber (see Fig. 3A,B) as a cross.
MRI studies were performed using a 1.5 Tesla Siemens 63SPA system (Siemens, Iselin, NJ) with a circularly polarized knee coil. Three-dimensional Magnetization Prepared Rapid Gradient Echo (3D-MPRAGE) sequence was acquired with the following parameters: repetition time = 10 msec, echo time = 4 msec, inversion time = 750 msec, flip angle 10, matrix 192 × 256, slice thickness 1.5 mm, and field of view 250 mm. MR images were transferred by local area network to an HP9000 C360 computer system (Hewlett-Packard, Palo Alto, CA) with an FX-4 graphics subsystem. MR image analysis was performed using Omniview 2D and 3D visualization software (3D Biomedical Imaging, Inc., Shawnee Mission, KS). The 3D-MPRAGE protocol was used to obtain axial images with a slice thickness of 1.0 mm. This protocol typically yielded 100–130 MR axial images and offered excellent spatial resolution because of thin slice thickness, minimizing volume-averaging effects. The thin slice thickness made it possible to maintain adequate resolution after multiplanar image reformations.
MR image analysis software allowed visualization of an acquired image set in any plane of interest. Thus, computer-assisted multiplanar image reformations were performed with respect to the reference framework previously highlighted with vitamin E marker. The resulting oblique parasagittal images were orthogonal to the M-L axis and in register with the chamber coordinate system. The images were parallel to a series of electrode tracks having the same M-L coordinate. For example, an oblique parasagittal image at lateral 4 would represent a slice through the cortex showing all electrode tracks for which the M-L chamber coordinate was lateral 4. The reformed images were then traced to highlight gray matter, white matter, and the central sulcus (Fig.2C).

Method for flattening and unfolding cortical layer V in the anterior bank of the central sulcus for two-dimensional representation. A, Parasagittal diagram representing the stimulated cortex, constructed from electrode tracks with the same M-L coordinate (4L) organized in an anterior-to-posterior order. Identification of white matter–gray matter border (thin line), central sulcus (CS), and sensory cortex were based on electrophysiological observations. Then, reference lines (dashed lines), similar to those used by Sato and Tanji (1989), were placed onto the diagram to represent cortical layer V. Ahorizontal reference line(h) was placed at 1.5 mm depth, and avertical reference line (v) was placed at 1.5 mm from the estimated central sulcus to approximate the position of layer V. The intersection of the reference lines (asterisk) was defined to be the convexity of the precentral gyrus. Projecting the selected stimulation sites (●) onto the reference lines, when necessary, flattened the curvature of layer V. In the case of track 2P, stimulation at a depth of 1.0 mm (●) is projected onto the reference line h (○). In this track, the 1.5 mm site was not used because the effects at 1.0 mm were much stronger. B, Flattened and unfolded two-dimensional map of cortical layer V. Layer V was unfolded by rotating the reference line v with respect to the convexity of the precentral gyrus (asterisk). This straightened the two reference lines into one line (dashed line). Completing this manipulation for all tracks yielded a two-dimensional map of M1. C, Tracing of an MR image through the same parasagittal plane as 4L with overlaid electrode tracks and stimulation sites corresponding to layer V (●). A, Anterior;P, posterior; L, lateral;M, medial.
Unfolding the cortex. A two-dimensional rendering of cortical layer V in the anterior bank of the central sulcus required flattening and unfolding its curvature. First, all electrode tracks were grouped according to their M-L coordinate. Within each group, the tracks were then ordered according to their A-P coordinate. On the basis of electrophysiological data and observations, a parasagittal diagram was constructed to represent the cortex that was explored and stimulated (Fig. 2A). White matter was identified by a sharp decrease or loss of background cell activity. Sensory cortex was identified by the presence of distinctive spike activity and characteristic receptive fields (Widener and Cheney, 1997). For each electrode track, sites corresponding to cortical layer V were identified using a combination of electrode depth, strength of PStF effects, and reconstruction of precentral geometry in relation to MRI sections. Electrode penetrations on the convexity of the gyrus traversed cortical layers perpendicularly, and in these cases, it was relatively easy to identify the stimulation site closest to layer V. For electrode penetrations traversing the depth of the precentral gyrus and extending roughly parallel to the cortical layers, it was more difficult to identify layer V sites. In these cases, output effects from sites at the same depth from different electrode tracks along the A-P axis were compared. Selection of sites closest to layer V was based on the strength of PStF and reconstruction of the position of the sites in relation to MRI parasagittal sections oriented along the same A-P axis as the electrode tracks. This analysis yielded a series of reconstructed parasagittal cortical sections oriented along the A-P axis of the chamber in the plane of the electrode tracks (Fig.2A,C).
Reference lines, similar to those used by Sato and Tanji (1989), were then placed on the diagram to represent cortical layer V. A horizontal reference line (h) was placed at a depth of 1.5 mm, and a vertical reference line (v) was placed typically at 1.5 mm anterior to the estimated location of central sulcus (Fig.2A). The intersection of the reference lines, marked with an asterisk in Figure 2A, defined the convexity of the precentral gyrus. Stimulation data (PStEs) from sites corresponding to cortical layer V were projected onto the reference lines (Fig. 2A). Then, layer V was unfolded by rotating the reference line v with respect to the convexity of the precentral gyrus. This straightened the two reference lines into one line. The resulting unfolded reference line then gave rise to the coordinates for each stimulation site on the two-dimensional map (Fig.2B).
RESULTS
Data were collected from the left M1 in two rhesus monkeys. There were a total of 248 electrode tracks, 115 tracks in monkey D (Fig.3A) and 133 tracks in monkey M (Fig. 3B). StTAing (15 μA) of rectified EMG activity from 24 forelimb muscles was performed at 2477 sites, 1072 (43.3% of total) sites in monkey D and 1405 (56.7% of total) sites in monkey M, resulting in a total of 59,448 StTA records. In addition, R-ICMS was performed at 359 sites, 210 in monkey D and 149 in monkey M. R-ICMS was performed at sites where no PStEs were observed with StTAing at intensities up to 30 μA. On the basis of the criteria described earlier, stimulation sites corresponding to cortical layer V were selected, and only their PStEs and evoked movements were used for mapping. This yielded a total of 361 sites and 8664 StTA records (209 sites in monkey D and 152 sites in monkey M). Forty-eight percent of PStF effects were in extensor muscles, and 52% were in flexor muscles (excludes intrinsic hand muscles). Forty-nine percent of sites facilitated a combination of at least one flexor muscle and one extensor muscle at the same joint (cofacilitation site). Overall, effects in distal muscles were two times greater than effects in proximal muscles. StTAs were obtained from all 24 muscles at each stimulation site. An example of PStEs obtained at one layer V site is shown in Figure 4. In this case, clear PStF effects were observed in both proximal and distal forelimb muscles. Accordingly, this site was categorized as one producing effects in both proximal and distal muscles.

A, B, Cortical recording chambers implanted over M1 cortex in monkeys D and M, respectively. The coordinate system (5 mm grid) is overlaid in yellow, and locations of electrode tracks are indicated with black-outlined red dots. Thelarge black rectangle overlying each chamber identifies the cortical area represented in maps C–F. In monkey D, a 15 mm incision was made in the dura for visual identification of the central sulcus. C–F, Maps of motor cortex for two monkeys represented in two-dimensional coordinates after unfolding the precentral gyrus. C, D, Maps for monkeys D and M, respectively, based on strong and moderate PStF effects together with R-ICMS-evoked movements. E,F, Maps for monkeys D and M, respectively, based on weak, moderate, and strong effects together with R-ICMS-evoked movements.

Distribution of PStF effects in forelimb muscles from a PDC site. Time 0 corresponds to the stimulus event used for the average. Stimulation was 15 μA at 15 Hz. Moderate and strong PStF effects were observed in both proximal (BIS,BIL, BRA, BR,TLON, PEC) and distal (APB, FDI, FDP,ED23) forelimb muscles. The range of number of trigger events for different channels is given in parentheses.
Ninety (25.1%) of the total R-ICMS sites (45 sites in monkey D and 45 sites in monkey M) were judged as corresponding to layer V. R-ICMS was used mainly to identify sites that did not produce any poststimulus effects, i.e., representations of trunk, hindlimb, and face. However, in one monkey, evoked movements from R-ICMS were also used to define some forelimb sites. Specifically, 14 of 71 sites (20%) mapped as proximal sites were defined solely by R-ICMS. However, these sites were located between sites already defined by PStE (for example in the center of the 1 × 1 mm grid defined by StTA). Because the site category based on R-ICMS matched the category of adjacent sites based on PStE, many of these sites did not affect the map boundaries. Only 8 of 71 sites (11%) helped to define the anterior (6 sites) and medial (2 sites) borders of the proximal muscle representation. Also, only 1 of 47 sites (2%) was categorized as producing effects in both proximal and distal muscles solely on the basis of R-ICMS data.
Motor output maps (Fig. 3C–F) constructed from effects at all layer V sites revealed a central core of distal forelimb muscle representation contained largely within the wall of the precentral gyrus. This core distal representation extended mediolaterally along the caudal border of M1 and was surrounded on all sides, except at the area 4/3a border, by a horseshoe-shaped zone of proximal forelimb muscle representation. The medial and lateral arms of the horseshoe extend posteriorly down the wall of the precentral gyrus and terminate at the area 4/3a border. Also, there was a substantial region separating the core distal and proximal representations at which StTAing produced effects in both proximal and distal forelimb muscles. On the basis of arguments presented in Discussion, we believe this area is not simply the result of current spread to the core distal and proximal representations. Accordingly, we will refer to it as the proximal–distal cofacilitation (PDC) zone. In a few places, the proximal muscle representation is fragmented into small islands by the PDC zone. Similarly, in both monkeys, the PDC zone is fragmented into noncontiguous medial and lateral components by the distal representation. The inclusion of weak PStF effects in the motor output maps (Fig. 3E,F) did not significantly alter the general features of the maps (Fig.3C,D). However, when weak effects were included, the PDC zone did appear as one contiguous representation, although small islands of proximal muscle representation remained.
The boundary of the core forelimb representation was determined carefully. Stimulation sites immediately anterior to the primary forelimb representation yielded no PStE with StTA at 15 and 30 μA, and no movements were evoked with R-ICMS at 15 and 30 μA. Stimulation sites posterior to the primary forelimb representation or deep in the sulcus were characterized as being either sensory cortex or white matter. Stimulation sites extending laterally from the horseshoe also produced no PStE with StTA at 15 and 30 μA. However, at these sites, R-ICMS at both 15 and 30 μA evoked movements of the upper and lower lips, thus revealing a face representation. Similarly and most notably, stimulation sites extending medially from the medial arm of proximal muscle representation produced no PStE with StTA at 15 and 30 μA. However, at these sites, R-ICMS at both 15 and 30 μA revealed components of a trunk and hindlimb representation. No evidence of a second noncontiguous distal or proximal forelimb representation was found (Fig. 3C–F).
Figures 5 and 6 illustrate the StTAs obtained from sites in M1 for a proximal muscle, BIS, and for a distal muscle, EDC. Each record in these figures is color-coded for strength of the PStF (see color key at the top of the Figures). The distribution of PStF effects for BIS and EDC revealed multiple foci of strong effects (SD > 5.0) for individual muscles represented over the forelimb area of M1. In the case of BIS, these multiple foci are separated by sites that yielded no effects, whereas in the case of EDC, the multiple foci represent peaks in output separated by valleys in which weaker but clear effects were present. Most importantly, the sites with EDC PStF effects are contained completely within the distal muscle zones. This includes both the distal-only zone (dark blue) and the PDC zone (purple). Similarly, the sites with BIS PStF effects are contained completely within the proximal muscles zones. This includes both the proximal-only zone (pink) and sites yielding effects on both distal and proximal muscles (purple).

Stimulus-triggered averages of rectified EMG activity (15 μA at 15 Hz) of a proximal muscle, biceps shorthead (BIS), for monkey D plotted on a two-dimensional map of M1. Each record is color coded for strength of PStF according to the number of SDs above pre-trigger baseline activity (color bar at top of Figure). The color-shaded motor representation map is taken from Figure 3E.Yellow line, Convexity of the precentral gyrus;black dashed line, fundus.
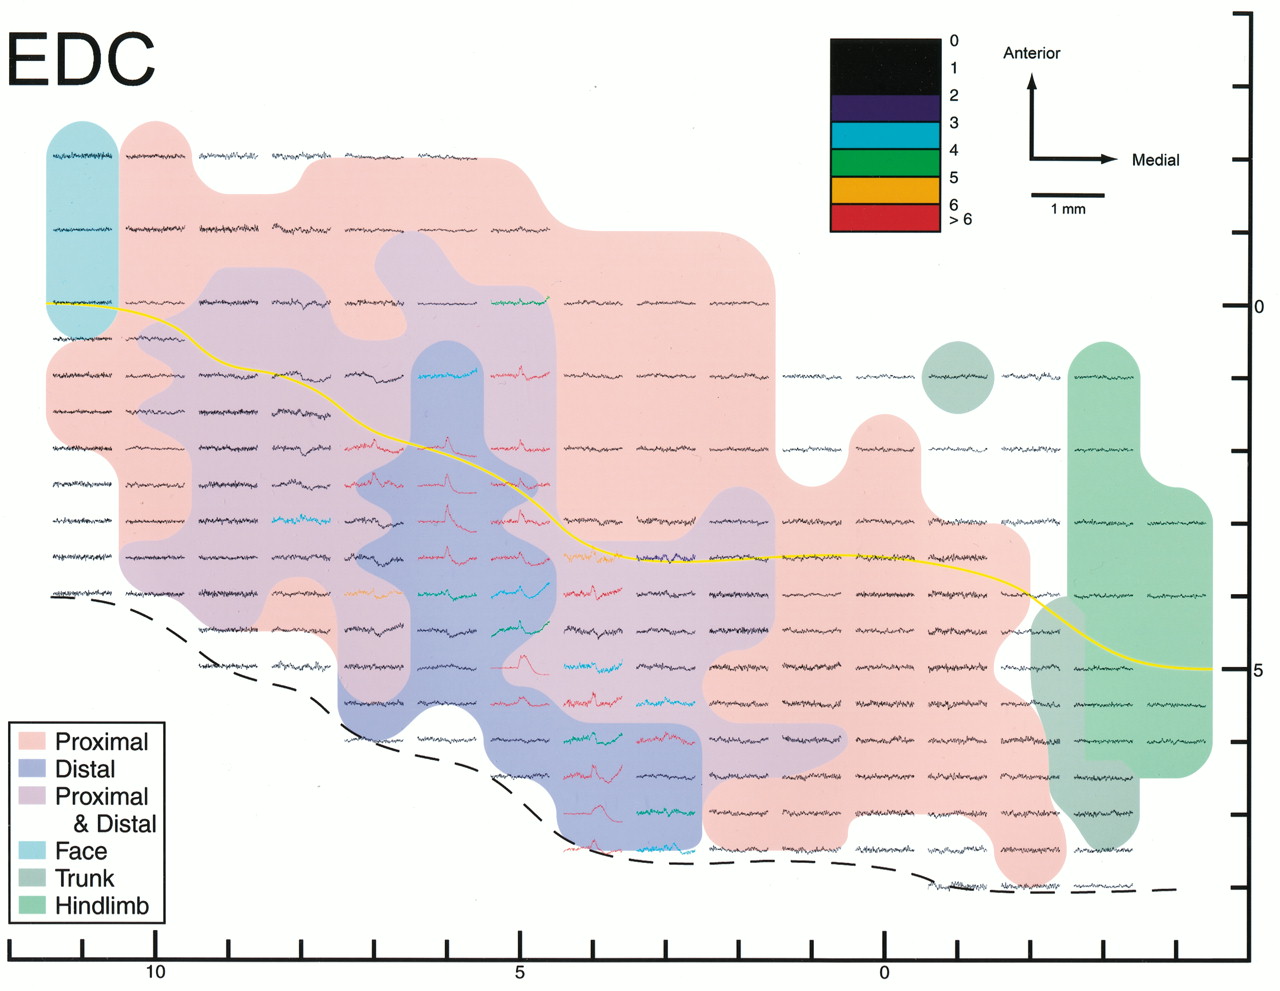
Stimulus-triggered averages of rectified EMG activity (15 μA at 15 Hz) of a distal muscle, extensor digitorum communis (EDC), for monkey D plotted on a two-dimensional map of M1. Each record is color coded for strength of PStF according to the number of SDs above pre-trigger baseline activity (color bar at top of Figure). The color-shaded motor representation map is taken from Figure3E. Yellow line, Convexity of the precentral gyrus; black dashed line, fundus.
DISCUSSION
Figure 7 summarizes the consistent features of M1 intra-areal forelimb muscle representation in the rhesus macaque based on our StTAing data. A central core of distal forelimb muscle representation, oriented mediolaterally along the caudal border of M1, is surrounded by a horseshoe-shaped zone of proximal forelimb muscle representation. The proximal muscle representation is discontinuous at the area 4/3a border. This pattern of representation is consistent with the work of others using R-ICMS in stumptail macaques (Kwan et al., 1978a,b) and squirrel monkeys (Strick and Preston, 1978, 1982a; Nudo et al., 1992, 1996; Nudo and Milliken, 1996). Separating the core distal representation from the surrounding core proximal representation is a zone yielding effects in both distal and proximal muscles (PDC zone). A small zone of overlap between the distal and proximal core representations would be expected because of the spread of stimulus current at the boundary separating the two representations. However, the width of the PDC zone suggests that it is a genuine, separate field with neurons that represent combinations of distal and proximal muscles as functional synergies. At different points, the width of the PDC zone ranges from <1 to ∼2.8 mm in one monkey and from <1 to ∼3.5 mm in the second monkey. This is based on measurements of a line oriented perpendicular to the distal zone boundary and reaching to the inner boundary of the proximal zone. We estimate that the effective physical spread of current from a 15 μA stimulus would have a radius of 105 μm. This is based on an intermediate k of 1350 μA/mm2in the expression:
 where ro is the radius of the cortical volume containing the directly activated cells, iis the stimulus current, and k is the proportionality constant (Stoney et al., 1968; Ranck, 1975; Cheney and Fetz, 1985). Even using the most minimal value of k (250 μA/mm2) yields 245 μm as the effective radius of physical stimulus spread. With 105 μm as the effective radius of physical spread, the width of the boundary zone exhibiting combined distal and proximal effects attributable simply to current spread would be 210 μm, far less than the observed width of the PDC zone. An effective current spread of 245 μm would yield a boundary zone width of 490 μm, which again is far less than the observed width. Also worth noting is the fact that if the PDC zone were solely the result of physical spread of stimulus current, it would be expected to have a relatively uniform width at different points along its length, yet the width is highly variable. Finally, if physical spread were a factor, we would have expected R-ICMS to yield a sizable zone producing effects in both proximal forelimb muscles and either trunk–hindlimb muscles medially or facial muscles laterally, but that was not observed.

Summary of proximal and distal forelimb muscle representation in M1 of rhesus macaques based on the motor output effects in stimulus-triggered averages. Three separable zones are consistent across monkeys, a central zone oriented mediolaterally along the caudal border of M1 representing distal muscle synergies, surrounded by a zone representing synergies involving both distal and proximal muscles, which, in turn, is surrounded by a zone representing only proximal muscle synergies. The latter two zones are not complete circles; rather, they are horseshoe-shaped and open at the 3a/4 border. The proximal muscle forelimb representation in M1 is bordered laterally by a face representation and medially by a trunk and hindlimb representation. We found no evidence supporting the existence of major distal or proximal muscle representations, separate from the core representations. A, Anterior; L, lateral;CS, central sulcus; Fundus, fundus of the central sulcus; P, proximal; D, distal;PDC, proximal–distal cofacilitation.
One additional factor possibly contributing to the PDC zone merits discussion. Although it seems clear that physical spread of stimulus current cannot adequately account for the PDC zone, physiological spread of excitation well beyond the site of stimulation is possible through horizontally oriented connections within the cortex as well as branching afferent inputs to cortex. However, on the basis of the measurements of Huntley and Jones (1991), horizontally oriented axons generally travel for distances of ≤0.5 mm within the cortex. Moreover, cortical cell cross-correlation studies suggest that the radius over which cells show cross-correlation peaks because of underlying synaptic coupling is largely limited to the area recorded by a single electrode (Allum et al., 1982) or 0.5 mm (Fetz et al., 1990). On the other hand,Baker et al. (1998) showed that single ICMS (20 μA) delivered to the digit representation of forelimb cortex is capable of facilitating the discharge of cortical cells in other parts of the digit representation located 1.5–2.0 mm away from the site of stimulation. However, although these more distant effects exist in response to ICMS, it is difficult to explain how they might account for the PDC zone observed in this study. Finally, the existence of a genuine PDC zone is also supported by our spike-triggered averaging (SpTAing) data showing that 45.5% of individual cortical cells for which activity was modulated during a reach and prehension task facilitated at least one distal and one proximal muscle (McKiernan et al., 1998). We suggest that the PDC zone contains corticospinal cells representing different combinations of distal and proximal muscles and that these cells are substrates for coordinated, multijoint movements underlying the reach and prehension task.
Systematic mapping based on stimulus-triggered averaging of EMG activity from 24 muscles simultaneously in the presence of movement is a highly sensitive and focal method for which spatial resolution is exceeded only by SpTAing of EMG activity (Cheney, 1996). StTAing reveals the motor output effects of neuronal aggregates activated by the stimulus in the vicinity of the electrode tip (Fetz and Cheney, 1980; Cheney and Fetz, 1985). Previous work has shown that although the individual effects are stronger, the pattern of the PStF across muscles obtained with StTAing in the intensity range from 5 to 15 μA closely matches the pattern of postspike facilitation obtained with SpTAing from cells at the same site (Cheney and Fetz, 1985). This result suggests the presence of cell aggregates or modules in which each cell of the module possesses a similar target muscle field. Such minimal cortical output modules can be viewed as representing different combinations of muscles that constitute functional synergies for the execution of single and multijoint limb movements.
Our data also directly address the issue of multiple distal and proximal muscle representations within M1. On the basis of retrograde labeling studies in rhesus macaques, He et al. (1993) suggested the existence of a second distal representation and possibly even a second proximal representation located medial to the core proximal representation, although in their summary diagram (He et al., 1993, their Fig. 18), the existence of these second representations is qualified by question marks. We were unable to find clear evidence for the existence of a major noncontiguous second representation of either distal or proximal muscles within primary motor cortex, despite running additional electrode tracks to increase the spatial resolution in regions in which we anticipated the presence of second representations based on the maps of He et al. (1993). Stimulation sites located medial to the medial arm of the proximal muscle representation yielded no effects in StTAs, but using R-ICMS to evoke movements revealed a representation of trunk and hindlimb muscles. Similarly, tracks located laterally to the lateral component of the proximal forelimb representation yielded no effects in StTAs of forelimb muscle activity, but R-ICMS revealed a representation of facial muscles. Although it is true that islands of proximal muscle representation are present along the lateral and caudal borders of the forelimb representation, these islands are relatively small, and their position is inconsistent with the second representations described by He et al. (1993). Moreover, the distal representation in our maps appeared as one continuous representation lacking even small noncontiguous islands. Given the sensitivity of the StTA method, we consider it unlikely that major second representations of distal or proximal muscles exist within M1.
The accuracy of motor output maps depends on the spatial resolution of the assessment technique. Most of the data for our maps was based on an electrode track spacing of 1 mm. Although a 0.5 mm surface grid interval would have provided finer spatial resolution, it would have required four times the number of electrode penetrations. We could not justify this disproportional increase in the number of additional electrode penetrations. However, to increase spatial resolution in critical regions, additional electrode penetrations were placed in the center of the squares formed by the 1 mm grid. Stimulation was performed at 0.5 mm intervals over the depth of our electrode penetrations, providing higher resolution for sites located in the bank of the precentral gyrus. Given that a 15 μA stimulus current should have a 105–245 μm radius of physical spread, coupled with our spacing of stimulation sites, it seems improbable that we missed possible second representations within M1.
Footnotes
This work was supported by National Institute of Neurological Disorders and Stroke Grant NS39023 and National Institute of Child Health and Human Development Grant HD02528.
Correspondence should be addressed to Dr. Paul D. Cheney, Mental Retardation Research Center, University of Kansas Medical Center, Kansas City, KS 66160-7336. E-mail: pcheney{at}kumc.edu.


