

Abstract
Noninvasive in vivo calcium imaging was used to observe and characterize inhibitory circuitry in intact larval zebrafish. In the teleost hindbrain, the inhibitory network onto the major pair of reticulospinal neurons known as Mauthner cells (M-cells) has been described in detail. There are three sources of inhibition onto M-cells: recurrent inhibition mediated by an ipsilateral collateral of the M-cell axon, feedforward inhibition driven by sensory afferents, and reciprocal inhibition between bilaterally opposed M-cells. To visualize these inhibitions, M-cells were retrogradely loaded with the calcium indicator calcium green dextran. Recurrent inhibition attenuated the Ca2+ response associated with an action potential in M-cells. Whole-cell recording revealed recurrent IPSCs, the conductance of which may underlie the shunting effect on action potentials and the attenuation of the Ca2+ signal in M-cells. Blocking synaptic transmission within the recurrent network abolished both the Ca2+ signal attenuation and the IPSCs. Electrical stimulation of the otic vesicle to activate VIII nerve afferents resulted in feedforward suppression of antidromically evoked test Ca2+ responses in the contralateral M-cell. Orthodromic activation of M-cells produced a reciprocal reduction of the test Ca2+ response in the contralateral M-cell. Thus, in the present study, we visualized the three types of inhibition and demonstrated that they are functional at 4 d after fertilization. The use of noninvasive techniques to image inhibitionin vivo suggest the plausibility of studying the hypothesis previously tested in adult goldfish that use-dependent changes in inhibitions underlie sound conditioning in escape behavior.
- Mauthner cell
- confocal Ca2+ imaging
- zebrafish larva
- local inhibitory circuits
- glycinergic synapse
- recurrent IPSCs
Inhibitory networks are crucial for neural processing of sensory information and motor control. Feedback and feedforward inhibition are present in diverse neural structures and are the principal systems for restricting neural activity (Windhorst, 1996). Optical imaging has provided a means for noninvasively studying local circuitry in the intact animal. However, it has not yet been applied to monitor synaptic inhibition in vivo. For resolving neural activity at single-cell resolution in an intact animal, one of the key technical requirements is a high signal-to-noise ratio in the optical signal (Tsien, 1988; Fetcho and O'Malley, 1997;McPherson et al., 1997). With the use of fluorescent Ca2+ indicators, a large optical signal can be obtained from an individual neuron even without signal averaging (Fetcho and O'Malley, 1995; O'Malley et al., 1996; Di Prisco et al., 1997; Svoboda et al., 1997). Callaway et al. (1995) took advantage of the robustness of the optical signal from calcium indicators to monitor synaptic inhibition in vitro. We therefore have applied this approach in vivo, taking advantage of the transparency of the zebrafish, to studying the inhibitory network in zebrafish larva.
Mauthner cells (M-cells), a large pair of reticulospinal neurons, are a good model for in vivo inhibitory imaging at single-cell resolution, because they can be clearly identified opticallyin vivo (O'Malley et al., 1996; Di Prisco et al., 1997), and inhibitory networks onto teleost M-cells have been well documented (Furukawa and Furshpan, 1963; Faber and Korn, 1978; Zottoli and Faber, 1980; Triller and Korn, 1981; Kimmel et al., 1985; Hatta and Korn, 1998). In adult fish, three types of glycinergic inputs, recurrent, reciprocal, and feedforward inhibition, critically control the excitability of the M-cell (Oda et al., 1995, 1998; Hatta and Korn, 1999) (Fig. 1B). The feedforward inhibition from eighth nerve afferents controls the firing threshold of both M-cells. Once one of the paired M-cells is activated, it is immediately inhibited by recurrent inhibition via the collateral pathway. At the same time, the contralateral M-cell is suppressed by reciprocal inhibition. M-cell activity manifests itself in the escape behavior of the animal (Zottoli, 1977; Eaton and Kimmel, 1980; Eaton et al., 1981;Liu and Fetcho, 1999; Zottoli et al., 1999). The direction of the initial turn of the fast escape response (C start) is determined by which of the two M-cells is activated. Thus, these three types of inhibitory networks are very important for the proper control of M-cell activation and subsequent escape.
Because the antidromic (AD) spike of the M-cell propagates almost passively from the initial segment to the soma, the inhibitory postsynaptic conductances activated by these pathways exert shunting effects on the AD spikes (Furukawa and Furshpan, 1963; Faber and Korn, 1982; Oda et al., 1995; Hatta and Korn, 1998) (Fig. 1C). To visualize the function of these three types of inhibitory networks in intact zebrafish larvae, we assessed the attenuation of the M-cell optical response associated with the shunting effects on the AD spike.
MATERIALS AND METHODS
Retrograde labeling of M-cell. Larvae were obtained from a zebrafish (Danio rerio) colony raised at 28.5°C and maintained according to established procedures (Westerfield, 1995). All procedures were performed in compliance with the guidelines stipulated by the Osaka University Committee on Animal Research. Four to 8 d postfertilization (dpf) zebrafish were anesthetized with 0.02% 3-aminobenzoic acid ethyl ester (MS-222) in chilled (4°C) 10% HBSS and placed on the stage of an upright microscope (Nikon Biophot). HBSS consisted of (in mm): 13.7 NaCl, 0.54 KCl, 0.025 Na2HPO4, 0.044 KH2PO4, 1.3 CaCl2, 1.0 MgSO4, and 4.2 NaHCO3, pH 7.2. To label M-cells retrogradely in intact fish, a solution consisting of 25% calcium green dextran (CGD, 10,000 molecular weight; Molecular Probes, Eugene, OR) in (in mm): 134 NaCl, 2.9 KCl, 2.1 CaCl2, 1.2 MgCl2, 10 HEPES, and 10 glucose, 290 mOsm, pH 7.8, was pressure-injected via a glass microcapillary into the spinal cord at the 15-somite (anus) level (modified from the method of O'Malley et al., 1996) by using a Picospritzer II (General Valve, Fairfield, NJ). This solution, without CGD, was also used as the bathing solution for brain-exposed preparations (see below). After the injection, the fish were maintained in 10% HBSS (28.5°C) to recover. An imaging study of M-cell somata was performed 5–24 hr after CGD injection. The transparency of the fish allowed us to see neurons as well as to observe the heartbeat and blood flow to monitor the viability of the fish.
CGD detects relative changes in Ca2+concentration. We did not use a UV calcium indicator, such as fura-2, suitable for monitoring the absolute value of internal calcium, because too much intrinsic fluorescence in zebrafish larvae would have been excited by UV light.
Calcium imaging with confocal microscopy. All procedures were performed at room temperature (25°C). Fish anesthetized with 0.01% MS-222 were embedded in low-melting point (gelling at 28°C) agarose (5%; Invitrogen, Gaithersburg, MD) on a recording chamber. After the agarose was congealed, holes were cut in it to permit the introduction of bipolar tungsten electrodes to stimulate the spinal cord and otic vesicle. The preparation was kept in a chamber filled with 10% HBSS and was placed on a manipulation stage (Narishige, Tokyo, Japan). The zebrafish brain was scanned by a confocal system (FV300; Olympus Optical, Tokyo, Japan) mounted on an Olympus BX50WI upright microscope with a water immersion lens (40×, 0.8 numerical aperture objective; Olympus). The confocal system was completely isolated from the manipulation stage.
Ca2+ responses at the M-cell were monitored without signal summation either by collecting a sequence of images (512 × 512 pixels) at 260 msec intervals or by scanning a single line through the M-cell soma at 2 msec intervals. To ensure that an increase in the fluorescence of the cell was not a result of its movement to a brighter plane, we focused at the brightest focal plane before each trial.
The spinal cord was stimulated at a position rostral to the site of CGD injection to activate the M-axon. Stimulus currents consisted of bipolar pulses, 80 μsec for each polarization applied every 2 min. The test AD stimulus intensity was kept slightly stronger (mean 1.3-fold) than the threshold (T) for a Ca2+ response in the M-cell. To assess the recurrent inhibition of the M-cell, double AD shocks with interpulse intervals ranging from 5 to 500 msec were delivered. To block the recurrent pathway that was mediated by glycinergic and cholinergic synapses, strychnine (1 μg/g of body weight) or mecamylamine (2.5 μg/g of body weight) was injected into the tail. To monitor the feedforward inhibition from eighth nerve afferents onto the contralateral M-cell, an electric shock was applied as the conditioning stimulus to the otic vesicle with subthreshold intensity (<0.8T) for ipsilateral M-cell firing and paired with a following test AD stimulus at intervals ranging from 0.5 to 100 msec. The intensity of the conditioning stimulus was raised (<1.2T) for firing the ipsilateral M-cell orthodromically to investigate the reciprocal inhibition to the contralateral M-cell.
To examine the contribution of voltage-activated calcium channels on the fluorescence response, CdCl2 (30–100 μm final) was added to the extracellular solution, which consisted of (in mm): 134 NaCl, 2.9 KCl, 2.1 CaCl2, 1.2 MgCl2, 10 HEPES, and 10 glucose, 290 mOsm, pH 7.8, bubbled with ambient air in the recording chamber. In this experiment, the whole brain was exposed after removing the eyes, otic vesicles, gut, dorsal skin, and notochord but leaving the caudal body intact.
Data analysis. The fluorescence intensity of an M-cell soma at a single horizontal plane was measured (Fluoview version 3.15;Olympus). Decay time constants of the Ca2+response and the half-recovery time of inhibitory shunts were obtained by single exponential fits and Boltzmann equation fits, respectively, with Origin 3.0 (Microcal). Results are presented as means ± SEM. The fraction of Ca2+ concentration increase under synaptic inhibition was calculated as ΔA/A, where A or ΔArepresents the peak amplitudes of Ca2+responses elicited by a single AD shock or that elicited by test AD shock after the conditioning stimulus, respectively.
To show the fluorescence images in the figures, the fluorescence intensity of M-cells was pseudocolored by using the Confocal Assistant 4.02 program (freeware produced by T. C. Brelje).
Whole-cell recordings. Zebrafish larvae of 4–5 dpf were anesthetized with 0.01% MS-222 and immobilized withd-tubocurarine (3 μg/g of body weight). The whole brain was exposed after removing rostral structures but leaving the spinal cord intact as described above. The preparation was set in the recording chamber that was continuously perfused with the extracellular solution (see above; Drapeau et al., 1999). Preparations were placed on a stage (Gibraltar; Burleigh) of an upright microscope (BX50WI;Olympus). M-cell somata and the proximal portion of their lateral dendrites were easily identified under an infrared differential interference contrast CCD camera system (C2741; Hamamatsu, Hamamatsu City, Japan) with a water immersion lens for infrared light (40×, 0.8 numerical aperture; Olympus).
Whole-cell currents were recorded using an Axoclamp 200B amplifier (Axon Instruments), low-pass-filtered at 5 kHz, and digitized at 20 kHz. Patch-clamp electrodes were filled with (in mm): 105.3 K gluconate, 25 KCl, 2 MgCl2, 10 HEPES, 10 EGTA, and 4 Na4ATP, 290 mOsm, pH 7.2. Data were acquired with pClamp 8.0 software and analyzed off-line with Clampfit 8.0 software (Axon Instruments).
After the recording session, the M-cell was labeled by injection of Lucifer yellow (Sigma, St. Louis, MO) from the patch pipette. A confocal image of the M-cell was used for final identification.
RESULTS
The inhibitory conductances that underlie local inhibition of the M-cell can be studied electrophysiologically by their shunting effect on the AD spike in the soma. The time course of the shunting effect corresponds to that of the inhibitory postsynaptic current on the M-cell (Furukawa and Furshpan, 1963; Faber and Korn, 1982; Oda et al., 1995; Hatta and Korn, 1998) (Fig.1C). To visualize local inhibition in the intact animal, we retrogradely labeled M-cells in intact larvae with CGD (Fig. 1A1,A2) and performed optical measurements of changes in intracellular Ca2+ concentration without signal averaging. Here we demonstrate that the intracellular Ca2+ change associated with the generation of an action potential in the M-cell is mediated by Ca2+ influx through voltage-activated calcium channels. We have taken advantage of the fact that inhibitory shunting can induce a reduction in this Ca2+ influx to examine optically the synaptic inhibition mediated by each of the three inhibitory pathways.
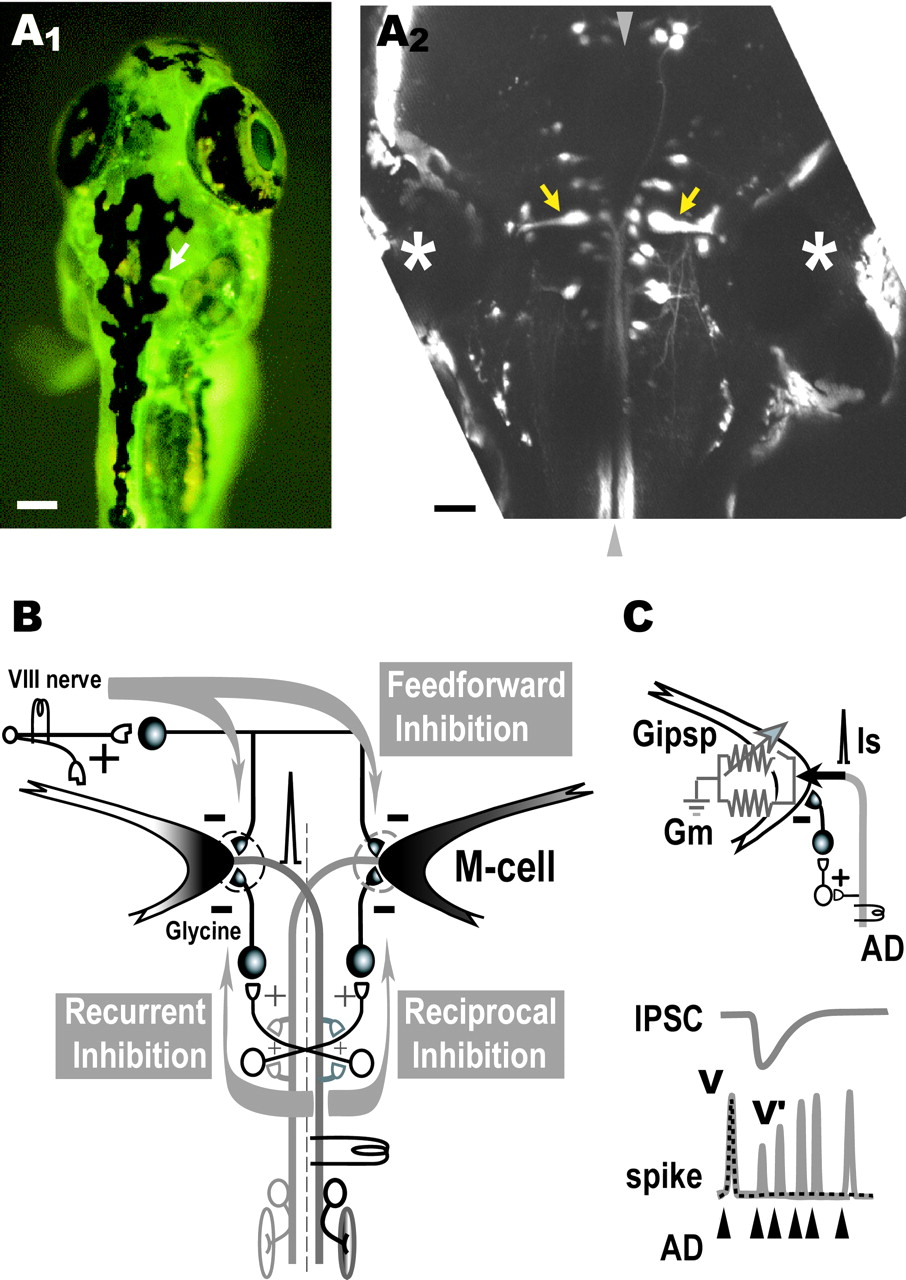
Retrograde labeling of the Mauthner cells.A1, Dorsal view of a living zebrafish at 6 dpf that had been injected in the spinal cord with CGD. An M-cell (arrow) can be observed in the intact fish by fluorescence microscopy. Scale bar, 100 μm. A2, Projected confocal stack of the array of reticulospinal neurons in horizontal plane in another larva labeled by bilateral injection of CGD into the spinal cord. The pair of M-cells (arrows) are easily identified as the largest neurons with a lateral dendrite and a commissural axon and are located beside the otic vesicle (asterisk). Rostral is at top.Arrowheads represent the midline. Scale bar, 50 μm.B, The M-cell of an adult zebrafish receives feedback inhibition from the axon collateral as well as feedforward inhibition from eighth nerve afferents. The feedback inhibition consists of recurrent and reciprocal pathways that are mediated by T-reticular neurons (open symbols) and glycinergic interneurons (filled symbols). Note that T-reticular neurons appear to be homologous to cranial relay neurons in the goldfish and giant fiber neurons in the hatchetfish (Kimmel et al., 1985).C, Because the AD action potential of the M-cell propagates almost passively from the initial segment to the soma, the spike amplitudes in the absence (V) or presence (V′) of inhibition are expressed respectively as V =Is/Gm orV′ =Is/(Gm +Gipsp), whereGm and Gipsprepresent the resting and inhibitory synaptic conductances, respectively, and Is represents the spike current. Hence,Gipsp/Gmis estimated from the ratio of V/V′ (cf.Furukawa and Furshpan, 1963; Faber and Korn, 1982; Oda et al., 1995;Hatta and Korn, 1998).
Ca2+ response of M-cell elicited by spinal cord stimulation
A pioneering electrophysiological study using extracellular field potential recording in the zebrafish larva showed that an AD action potential in the M-cell could be generated by spinal cord stimulation (Eaton and Farley, 1975). The antidromically driven Ca2+ response can be evoked at a lower stimulation intensity in M-cells than in other reticulospinal projection neurons, because the large diameter of the M-cell axon (Kimmel et al., 1982) gives it the lowest threshold for extracellular stimulation. Fluorescence intensity in CGD-labeled M-cells increased abruptly after an electrical shock applied to the spinal cord (Fig.2A1). The elevated fluorescence intensity returned slowly to resting levels, with a decay time constant (τ) of 1.8 sec (Fig. 2A2). In 30 fish studied, the peak fluorescence increase and decay time constant were 60.2 ± 4.1% and 1.8 ± 0.1 sec, respectively. A consistent increase in the fluorescence intensity was produced in the same cell using a range of suprathreshold stimulus intensities (<2.5T, six of six fish) (Fig. 2B1,B2). As shown in Figure2B2, the linear regression line for the peak amplitude versus strength of the suprathreshold stimulus was flat (0.13 ± 0.14%/T, six fish). Thus, the fluorescence change is consistent with the AD spike of the M-cell, which occurs in an all-or-nothing manner.

Fluorescence increase elicited in M-cell by antidromic stimulation. A1, Transient fluorescence increase was observed after an electrical shock was applied to the spinal cord (asterisk). The time (seconds) before and after the stimulus is denoted in each frame. The color scale on the left represents fluorescence intensity (blue, lowest; red, highest). Scale bar, 20 μm. A2, The fluorescence intensity of somata, the yellow region of interest of the last panel in A1, exhibited an abrupt increase and slow decay with a time constant of 1.8 sec (red dotted line, single-exponential fit). Increase in fluorescence (ΔF) was normalized by the resting level (F). B1, Transient fluorescence changes in a M-cell induced by several different intensities of spinal cord shock (arrowhead) were superimposed. The stimulus strength was expressed as a fraction of the M-cell firing threshold (T). B2, Relationship between peak fluorescence increase (ΔF/F;y-axis) and stimulus intensity (x-axis) in the M-cell as exemplified in B1. The fluorescence increase induced by suprathreshold stimulus (<2.5T) was constant (solid line represents a linear regression line). Thus, the Ca2+ response appeared in an all-or-none manner, like antidromic M-cell spike generation.
To examine whether the fluorescence elevation was produced by Ca2+ influx through voltage-activated Ca2+ channels, we added cadmium, a Ca2+ channel blocker, to the bathing solution of brain-exposed zebrafish larvae (Fig.3A). The fluorescence increase elicited by suprathreshold stimulation was abolished within 10 min after 30 μm cadmium application in 10 of 10 fish (Fig. 3B). It recovered, at least partially, after 30 min washing with saline in six of eight fish. The effect of cadmium could not be attributed to an artificial shift in the spike threshold of the M-cell, because no fluorescence response was observed in M-cells even when the stimulus intensity was raised to 2.0–4.0T (nine fish). These results indicate that the fluorescence change evoked by AD stimulation reflects the Ca2+ influx through voltage-activated Ca2+channels.

The fluorescence change mediated by voltage-activated Ca2+ channels. A, Ventral view of an exposed brain of a zebrafish larva (see Materials and Methods). A fluorescent image of retrograde labeling of a left M-cell (arrow) and a transmitted light image were merged. Bipolar stimulus electrodes (bottom left) were inserted into the caudal hindbrain and positioned near the M-axon (arrowhead). Rostral is at the top. Scale bar, 50 μm. B, The fluorescence increase (square) in response to stimulation of the M-axon was almost completely abolished (circle) within 10 min by bathing with cadmium (30 μm)-containing solution. The response partially recovered (triangle) after 46 min washout. Stimulus intensity was 1.2T in control and washout but 2.5T during cadmium application.
Ca2+ release from internal stores (Santalova and Moshkov, 1999) is one possible basis for the Ca2+ response. However, application of thapsigargin, an inhibitor of intracellular Ca2+ release, affected neither the peak amplitude (A) nor the decay time constant (τ) of the Ca2+ response elicited by an AD stimulation (control vs thapsigargin: A, 67.8 ± 2.4 vs 67.7 ± 5.1%; p > 0.5; τ, 1.5 ± 0.2 vs 1.7 ± 0.3 sec; p > 0.1; five fish, pairedt test). In addition, after subtracting the inferred Ca2+ response that would have been evoked by the first AD spike alone, the decay time constant of the second AD Ca2+ response was identical to that of the first AD response (τ of the first response, 1.8 ± 0.1 sec vs τ of the corrected second response, 1.8 ± 0.1 sec; 10 fish). These observations do not support a contribution of Ca2+ release from internal stores to the Ca2+ response (Sabatini and Regehr, 1995).
Accumulated Ca2+ response elicited by double-shock AD stimuli
To visualize the effects of recurrent inhibition, double AD shocks were applied with various interpulse intervals to elicit the shunting effect on the second AD spike (Fig. 1C). Figure4A illustrates the Ca2+ response obtained by line scanning an M-cell soma every 2 msec. A single shock applied to the spinal cord produced a Ca2+ increase (Fig.4A, left, B,orange). Double AD shocks at 200 msec (Fig.4A, right, B, red) but not at 5 msec (Fig. 4B, green) intervals caused a further Ca2+ increase. The absence of an additional Ca2+ increase at the 5 msec interstimulus interval could be attributable to the shunting effects on the second spike (Fig. 4C). The line scanning method is adequate to assess the Ca2+ response with high temporal resolution but does not provide a sufficiently high signal-to-noise ratio to quantify the degree of Ca2+increase without averaging the signal. Two-dimensional scanning of a restricted area of the M-cell soma used in the present study produces a much higher signal-to-noise ratio. Its temporal resolution was also sufficient to monitor the time course of the shunting effect. Thus, the area of the M-cell soma was scanned to assess the time course of the inhibitory effect quantitatively.

Shunt of Ca2+increase in an M-cell. A, An M-cell soma was scanned by a line (yellow line in bottom panel) that passed through the M-cell soma. The fluorescence of the line acquired repeatedly every 2 msec is displayed from top to bottom. Fast Ca2+ elevation was evoked after AD shocks (arrowhead). The Ca2+ increase elicited by double shocks with an interval of 200 msec (right) was larger than the response evoked by a single shock (left). Scale bar, 20 μm; calibration, 100 msec.B, Approximately 30% of the Ca2+increase was elicited by a suprathreshold single AD shock (orange). Additional Ca2+ elevation to ∼50% was observed when the second AD stimulation was applied 200 msec later (red). In contrast, no additional elevation was induced with 5 msec interval (green). Everypoint represents the fluorescence of the soma. Baselines of resting fluorescence levels are represented by the dotted line. C, An AD spike of an M-cell induces the recurrent IPSC with large synaptic conductance. Left, When the second AD spike is evoked after the IPSC is completed, the spike is not shunted, and additional Ca2+elevation (ΔA) is observed. Right, When a second AD spike is evoked during an IPSC, the spike amplitude is shunted, and the second Ca2+ elevation is reduced.
The peak amplitude of the Ca2+ response reveals the integrated Ca2+ influx elicited by double AD shocks. As shown in Figures5B2 and 6A, double AD shocks with interstimulus intervals of 50–500 msec produced much larger Ca2+ elevations than those evoked by a single shock (Figs. 5A, 6A). In contrast, for intervals of 5–30 msec, only a fractional or no increase above the single-shock control response was observed (Figs.5B1, 6A). Similar inhibition in Ca2+ responses was observed in zebrafish aged from 4 to 8 dpf (Table 1). Figure6B shows the summarized time course of the attenuation in Ca2+elevation elicited by double AD shocks (11 fish). It indicates the time course of recurrent inhibition elicited by the first AD stimulus.

Ca2+ elevation in an M-cell in response to single (A) or double (B1, B2) AD shocks. The time (seconds) before and after the stimulus is denoted in each frame. Thecolor scale on the right is the same as in Figure 2. A single shock (A) and double AD shocks with a 5 msec interval (B1) produced similar levels of Ca2+ increase. In contrast, the double shocks with a 50 msec interval evoked a much larger Ca2+ increase. Scale bar, 20 μm.
Ca2+ increase reduced by recurrent inhibition

Time course of the inhibitory shunt of an M-cell.A, Superimposed traces of the Ca2+responses (filled squares) evoked in an M-cell by double AD shocks spaced at the intervals denoted below. The peak Ca2+ response elicited by double AD shocks was attenuated when the interval was <50 msec. Note that the peak amplitude for an interval of 5 msec was quite similar to that evoked by a single pulse (AD ×1, open squares). A notch was observed in the rising phase of the Ca2+response at an interval of 500 msec, because the second Ca2+ elevation was combined with the decay phase of the first response, as shown in Fig. 4B.B, Relationship between the ratio of an additional increase of Ca2+ response (ΔA) evoked by the second pulse and that by a single pulse (A, y-axis) and intervals of double pulses (x-axis, in log scale) summarized from 11 fish. The dotted line expresses the Boltzmann fit to the data. The half-recovery time was 25.3 ± 2.5 msec. The effective periods of the inhibitory shunt resemble those obtained in previous electrophysiological studies (cf. Furukawa and Furshpan, 1963; Faber and Korn, 1982; Oda et al., 1995, 1998; Hatta and Korn, 1998).
Blocking the recurrent inhibitory pathway diminished the attenuation
To confirm that the attenuation of the Ca2+ response was attributable to recurrent inhibition, we examined the effects of blocking synaptic transmission pharmacologically on the Ca2+ response in one of the following ways. First, we applied strychnine, a glycine receptor blocker, to remove the synaptic inhibition onto the M-cell, because the inhibitory interneurons in the recurrent pathway are mainly glycinergic (Furukawa et al., 1964). Second, we applied mecamylamine, a nicotinic acetylcholine receptor blocker, to block the synaptic transmission between the M-axon and the T-reticular neurons, because the M-cells are thought to be cholinergic (Furukawa et al., 1964; Day et al., 1983; Waldeck et al., 2000). The attenuation of the Ca2+ response almost disappeared after injection of strychnine or mecamylamine into the tail (Fig.7A,B). Under these conditions, the Ca2+ responses elicited by paired AD shocks at 5 msec intervals were comparable with those at 50–500 msec. Summarized data (Fig. 7C) show that ΔA/A values at an interstimulus interval of 5 msec under strychnine (55.4 ± 7.7%; 8 fish) or mecamylamine (48.9 ± 6.9%; 11 fish) were significantly larger (p < 0.0001, t test) than that in control fish (5.8 ± 1.6%; 25 fish). Thus, the inhibitory shunt of the Ca2+ response evoked by double shocks is mediated by the recurrent inhibition of the M-cell.

Effects of blocking a recurrent inhibitory pathway. A, The inhibitory shunt of the Ca2+ response was totally eliminated after the glycinergic receptor blocker strychnine was injected to the tail of the intact zebrafish. Ca2+ responses were superimposed as in Figure 6A. Ca2+elevation in response to double AD shocks with a 5 msec interval was not reduced and resembled those obtained at intervals of 10–500 msec.Insets, Pseudocolor images of fluorescence intensity at rest (a) and after single shock (b) and double shocks at intervals of 5 (c), 50 (d), or 500 (e) msec. B, The inhibitory shunting of Ca2+ response was lost by injecting the nicotinic acetylcholine receptor blocker mecamylamine into the tail. Ca2+ increases in response to double shocks with intervals of 5–500 msec were constant. Insets, Pseudocolor images as denoted as in A. C, ΔA/A for the double AD shocks at interval of 5 msec in control and strychnine- and mecamylamine-injected fish. The inhibitory shunt (ΔA/A, 5.8 ± 1.6%; 25 fish; control) was significantly reduced in strychnine (ΔA/A, 55.4 ± 7.7%; 8 fish; p < 0.0001, t test) or mecamylamine (ΔA/A, 48.9 ± 6.9%; 11 fish; p < 0.0001, t test).
Under both normal and mecamylamine-blocked conditions, the Ca2+ response evoked by double shocks at a 2 msec interval exhibited a small increase (examined in three fish) from the response evoked by a single AD pulse (Fig. 7B), suggesting that the second AD spike was partially blocked at the interval of 2 msec by refractoriness of the membrane.
Whole-cell recordings of recurrent IPSC
To confirm that the inhibition induced by AD stimulation of the M-cell occurred via the recurrent pathway, we performed whole-cell recordings from larval M-cells. Because the chloride equilibrium potential was adjusted to −40 mV, IPSCs would appear as inward currents at the holding potential of −70 mV, as exemplified in Figure 8. After a spike evoked by a brief depolarization of the M-cell, postsynaptic inward currents were observed. The inward currents and the spiking of the M-cell occurred coincidentally and in an all-or-nothing manner (Fig.8A). The inward currents started 2.9 ± 0.1 msec after the M-cell spike and reached their peak at 2.5 ± 0.1 msec from the onset with a half-width of 6.9 ± 0.5 msec (six fish). The inward currents were eliminated by 1 μmstrychnine (four of four fish) and recovered in three of four fish after washout (Fig. 8B). Thus, the inward currents represented the recurrent IPSCs of the M-cell mediated by glycinergic synapses. The shape of IPSCs suggested the kinetics of the synaptic conductance underlying them. These results support the idea that the reduction in Ca2+ response as observed above (Figs. 4-6) is attributable to the inhibitory shunt resulting from recurrently activated glycinergic inputs onto the M-cell.

Recurrent inhibitory postsynaptic currents of M-cell. A, IPSCs were monitored by whole-cell recording with a KCl-filled patch electrode (ECl, −40 mV) from an M-cell of a 4 dpf zebrafish. Each trace was averaged from seven responses. Recurrent IPSCs (asterisk) were elicited in an all-or-nothing manner associated with the preceding spike of the M-cell (arrow) evoked by brief depolarization (to +20 mV). The holding potential was −70 mV. Input resistance was 23 MΩ.B, Recurrent IPSCs (black) were completely abolished (blue) within 30 min by bathing with strychnine (1 μm)-containing solution. The currents recovered (gray) after 23 min washout.C, Confocal fluorescence image of another M-cell after injecting Lucifer yellow from the recording patch pipette. The lateral dendrite and soma of the cell were clearly observed, with the thick axon descending through the contralateral side of medulla. Scale bar, 50 μm.
Visualization of feedforward inhibition from sensory afferent to M-cell
To visualize the feedforward inhibition onto the contralateral M-cell resulting from stimulation of eighth nerve afferents, afferent stimulation and AD stimulation were applied together. The otic vesicle in zebrafish larvae (4–5 dpf) was electrically stimulated as the conditioning stimulus to activate eighth nerve afferents at an intensity below threshold for firing the ipsilateral M-cell (Fig.9A). No apparent Ca2+ response was observed in either the ipsilateral or contralateral M-cells in response to this stimulus. When a test AD stimulus was paired at intervals of 2–20 msec with the preceding conditioning stimulus, the test Ca2+ response was clearly reduced in amplitude (Fig. 9B). A maximal reduction occurred 2 msec after the onset of the conditioning stimulus. Less reduction was observed for longer intervals. No attenuation of the Ca2+ response was observed for intervals of ≦1 msec (p > 0.1, ANOVA), suggesting that the feedforward inhibition starts between 1 and 2 msec after the stimulus. As summarized in Figure 9C, the normalized amplitude of the Ca2+ response (ΔA/A) was maximally inhibited at an interval of 2 msec (ΔA/A = 52.4 ± 6.1%) and then gradually recovered to control levels with longer intervals. Thus, the feedforward inhibitory input from eighth nerve afferents to the M-cell could be monitored optically in larval zebrafish.

Feedforward inhibition from eighth nerve afferents to the contralateral M-cell. A, An otic vesicle was electrically stimulated with subthreshold intensity (0.8T) for the ipsilateral M-cell. B, Superimposed Ca2+ responses evoked in an M-cell by pairing the afferent and AD stimuli at intervals denoted below. The Ca2+ response was maximally reduced when the two stimuli were paired at a 2 msec interval. AD ×1, Ca2+ response to the AD stimulus alone.C, Relationship between normalized amplitude of the paired response (ΔA/A,y-axis) and intervals of the paired stimuli (x-axis), summarized from five fish. ΔA/A at intervals of 2–20 msec were significantly reduced from control (***p < 0.0005; **p < 0.002, t test). Thedotted line expresses the Boltzmann fit to the data points from 2 to 100 msec. The half-recovery time was 15.0 ± 2.6 msec (n = 5). The time course of the feedforward inhibitory shunt matches that obtained in a previous electrophysiological study (cf. Oda et al., 1998).
Reciprocal inhibition to the contralateral M-cell
Next we assessed the reciprocal inhibition between the two M-cells. Suprathreshold stimulation of the otic vesicle in larval zebrafish (4–5 dpf) caused an apparent Ca2+ increase in the ipsilateral but not in the contralateral M-cell (Fig.10A). When a test AD stimulus was paired with the suprathreshold conditioning stimulus at intervals of 2–10 msec, the test Ca2+response was completely abolished (Fig. 10B). It gradually recovered within 50 msec. The larger shunt of the Ca2+ response reflects the reciprocal inhibitory effect between the M-cells in addition to the commissural feedforward inhibition (Fig. 9), because the additional powerful shunt appeared synchronously with the firing of the ipsilateral M-cell. Because the test Ca2+ influx is mediated by voltage-activated Ca2+ channels (Fig.3), the complete optical shunt could be explained by its sigmoidal current–voltage relationship (Fox et al., 1987). Figure 10Csummarizes the time course of the inhibitory shunt elicited by the paired shocks (six fish). ΔA/A was attenuated at intervals of 2–30 msec compared with control AD test shocks. The onset of inhibition was between 1 and 2 msec after the conditioning stimulus.

Combination of reciprocal and feedforward inhibitions onto the M-cell. A, A suprathreshold stimulus (1.2T) applied to the otic vesicle to drive ipsilateral M-cell firing elicited an apparent Ca2+ increase in the ipsilateral (left), but not the contralateral (right) M-cell. The arrowhead shows the onset of the otic vesicle stimulus (conditioning stim.). The longer decay time constant (τ = 4.2 ± 0.3 sec; 11 responses) might reflect Ca2+ influx through NMDA-type glutamate receptors (Pereda and Faber, 1996).B, Superimposed traces of the Ca2+response evoked in the contralateral M-cell by pairing the two stimuli at intervals denoted below. The Ca2+ response was diminished when the intervals ranged from 2 to 10 msec and gradually recovered with longer intervals. Note that peak amplitudes of Ca2+ response obtained at intervals of <2 msec were the same as the test response (AD ×1). Shaded circles indicate the peak amplitude of each Ca2+ response. C, Relationship between ΔA/A(y-axis) and intervals of the paired stimuli (x-axis), summarized from six fish. ΔA/A values at intervals of 2–30 msec were significantly reduced from control (****p < 0.0001; **p < 0.003, t test). Thedotted line expresses the Boltzmann fit to the data points from 2 to 100 msec. The half-recovery time was 27.6 ± 2.5 msec (n = 6). The larger shunt of the Ca2+ response indicates the reciprocal inhibition produced by ipsilateral M-cell firing that was superposed on the commissural feedforward effect (Fig. 9). D, Use-dependent depression of reciprocal inhibition. An AD test response evoked 5 msec after the second pulse of the paired conditioning pulse with interpulse intervals (Δt) is denoted.Horizontal bars indicate the peak amplitude of the test AD response without a shunt. The inhibitory shunt was clearly reduced at a 100 msec interval. E, Relationship between ΔA/A (y-axis) and intervals of the double conditioning stimuli (x-axis), summarized from seven fish, suggesting that the reciprocal inhibition followed after 200 msec interstimulus intervals but not after short intervals of 100 msec.
In this experiment, the conditioning stimuli were applied at a very low frequency (0.01 Hz). It has been shown in the adult goldfish that use-dependent synaptic depression at the axoaxonic connection between the M-cell and the cranial relay neuron, which appears to be homologous to the T-reticular neuron in the zebrafish (Kimmel et al., 1985), is induced at higher frequencies (Waldeck et al., 2000). To quantify the activity-dependent depression of the combined (reciprocal and feedforward) inhibition in the present preparation, a paired pulse conditioning paradigm was used. The test AD response was evoked 5 msec after the second pulse of the conditioning paired stimuli with interpulse intervals ranging from 100 to 3000 msec. The inhibitory effect of the second conditioned stimulus could be observed when the interval of the paired pulse was >200 msec but was obviously weakened with a 100 msec interval (Fig. 10D,E). We consider that the remaining optical inhibition reflects the feedforward effect. Together, the use-dependent depression of the reciprocal inhibition was also detectable by the optical approach.
DISCUSSION
The present work is the first attempt to visualize synaptic inhibition on identifiable neurons in the CNS in an intact vertebrate. We have visualized the recurrent, feedforward, and reciprocal forms of inhibition on the M-cell by examining the shunting of Ca2+ responses in the intact zebrafish larvae. With this optical approach, it is evident that all three types of inhibitory networks onto the M-cell are already functional in early larval zebrafish.
Attenuation of the Ca2+ response reveals recurrent inhibition
The maximum optical shunt associated with recurrent inhibition was observed at an interval of 5 msec (Fig. 6). This attenuation is likely to reflect real recurrent inhibition, because the inhibitory shunt of the Ca2+ response at an interval of 5 msec was dramatically abolished when the recurrent pathway was blocked (Fig.7). On the contrary, attenuation was still observed at the 2 msec intervals both under normal conditions (11 fish; data not shown) and under blockade of synaptic transmission in the recurrent circuit (Fig.7B). This probably reflects refractoriness of the M-axon after the first AD spike, as suggested by whole-cell recording, which indicated that the onset of the recurrent IPSCs of the M-cell was 2.5–3.0 msec after the spike (Fig. 8). In addition, axonal refractoriness at a 2 msec interspike interval has been reported previously (Furukawa and Furshpan, 1963). The effects of refractoriness on the Ca2+ response at intervals over 5 msec are negligible in comparison with the recurrent inhibitory conductance (Fig. 7). A previous electrophysiological study in adult goldfish demonstrated that the attenuation of the spike at an interval of 6 msec was only ∼7% when the recurrent inhibition was blocked (Furukawa and Furshpan, 1963). Together these data show that the attenuation of ΔA/A observed at intervals of 5–30 msec (Fig. 6) demonstrated a powerful shunting effect of the recurrent inhibition.
Optical signals associated with double AD spikes
The Ca2+ response elicited by double AD shocks with intervals of >50 msec (Fig. 6) exhibited no sign of inhibition. A similar ΔA/A was observed with double shocks for intervals ranging from 5 to 500 msec with blocking of the recurrent inhibition (Fig. 7A,B). Despite this lack of inhibition, the ΔA/A was nonetheless only ∼65% of the control responses to a single shock. This is probably attributable to the relatively high Ca2+affinity of the CGD (O'Malley et al., 1999) rather than a real decrease in Ca2+ influx for the full-sized second spike. A similarly diminished increase (∼60%) in the optical signal of CGD was reported for the response evoked by double stimulation of the parallel fibers on cerebellar Purkinje cells (Kreitzer et al., 2000; Kreitzer and Regehr, 2001). This did not occur when the low-affinity calcium indicator fluo-4 dextran was used. Thus, the ΔA/A of the M-cell suggests that a full-sized AD spike was evoked by the second AD stimulus at intervals of >50 msec.
Functions of the local inhibitory network of the M-cell
During early development in mammals, glycinergic or GABAergic synapses can often function as excitatory inputs, even triggering action potentials (Cherubini et al., 1991). However, at least at the developmental stages we used in the present study, glycinergic inputs to M-cells in zebrafish larvae are unlikely to exert an excitatory effect on the postsynaptic neuron sufficient to trigger action potential firing for the following reasons. First, no excitatory Ca2+ response was induced in the contralateral M-cell by eighth nerve input or via reciprocal inhibitory input (Fig. 10A). Second, the blockade of the recurrent pathway increased, rather than decreased, the ΔA/A for intervals of <40 msec (Fig. 7). Third, no repetitive firing of the M-cell has been observed in field potential recordings in larvae of >4 dpf (Eaton and Farley, 1975).
Furthermore, our observations suggest that the recurrent inhibitory network onto the M-cell is fully functional by 4 dpf. First, there was no developmental change in the recurrent inhibitory shunt of the Ca2+ response between 4 and 8 dpf (Table 1). Second, the kinetics of recurrent IPSCs in larval M-cells (Fig. 8) was similar to that reported in adult fish (Hatta and Korn, 1998). In addition, because the same group of T-reticular neurons are involved in both reciprocal and recurrent pathways (Kimmel et al., 1985), the similar frequency susceptibility of the reciprocal inhibitory shunt (Fig. 10) suggests that the M-cell output synapses of the larva have physiological characteristics similar to those of adult fish (Waldeck et al., 2000). Thus, the recurrent and probably also reciprocal inhibitory networks on the M-cell develop during the first 4 d after fertilization.
Inhibitory synaptic plasticity was first described in the M-cell and was linked to behavioral conditioning (Korn et al., 1992;Oda et al., 1995). In the adult goldfish, use-dependent changes in inhibition have been shown to underlie the sound conditioning of escape behavior (Oda et al., 1998). The present noninvasive approach provides the possibility of studying this phenomenon in the intact animal. In addition, the use of zebrafish opens the possibility of analyzing disruptions of plasticity or circuitry development in mutants as well as genetic perturbations of plasticity in transgenic lines (Haffter et al., 1996; Lorent et al., 2001).
Footnotes
This work was supported by research fellowships of the Japan Society for the Promotion of Science to M.T. and Grants-in-Aid for Scientific Research A-12358013 and 10680743 and Priority Area Grants A-11168216, 11170231, and 12053246 to Y.O. We thank Drs. E. S. Ruthazer, W.-J. Song, N. Yamamoto, F. Murakami, H. Kobayashi, and N. D. Cook for helpful comments. We also thank Y. Murayama for the collaboration in our early electrophysiological study.
Correspondence should be addressed to Yoichi Oda, Neuroscience Laboratories, Graduate School of Frontier Biosciences, Osaka University, Machikaneyama 1–3, Toyonaka, Osaka 560-8531, Japan. E-mail: oda{at}fbs.osaka-u.ac.jp.


