

Abstract
Considerable experimental evidence suggests that serotonin (5-HT) at sensory neuron→motor neuron (SN→MN) synapses, as well as other neuronal sites, contributes importantly to simple forms of learning such as sensitization and classical conditioning inAplysia. However, the actual release of 5-HT in the CNS induced by sensitizing stimuli such as tail shock has not been directly demonstrated. In this study, we addressed this question by (1) immunohistochemically labeling central 5-HT processes and (2) directly measuring with chronoamperometry the release of 5-HT induced by pedal tail nerve (P9) shock onto tail SNs in the pleural ganglion and their synapses onto tail MNs in the pedal ganglion.
We found that numerous 5-HT-immunoreactive fibers surround both the SN cell bodies in the pleural ganglion and SN axons in the pedal ganglion. Chronoamperometric detection of 5-HT performed with carbon fiber electrodes implanted in the vicinity of tail SN somata and synapses revealed an electrochemical 5-HT signal lasting ∼40 sec after a brief shock of P9. 5-HT release was restricted to discrete subregions (modulatory fields) of the CNS, including the vicinity of tail SN soma and synapses ipsilateral to the stimulation. Increasing P9 shock frequency augmented the amplitude of the 5-HT signal and, in parallel, increased SN excitability and SN synaptic transmission onto tail MNs. However, the relationship between the amount of 5-HT release and the two forms of SN plasticity was not uniform: SN excitability increased in a graded manner with increased 5-HT release, whereas synaptic facilitation exhibited a highly nonlinear relationship. The development of chronoamperometric techniques in Aplysia now paves the way for a more complete understanding of the contribution of the serotonergic modulatory pathway to memory processing in this system.
- chronoamperometry
- in vivoelectrochemistry
- carbon fiber electrodes
- synaptic facilitation
- excitability
- neuromodulation
Heterosynaptic plasticity, a process that modifies the response of a neural network to a given stimulus through activation of an independent modulatory pathway, has been implicated in several forms of learning, such as sensitization and classical conditioning (for review, see Kandel and Schwartz, 1982;Dudai, 1989; Byrne and Kandel, 1996). This phenomenon has often been described in the CNS. For example, in the mammalian cortex, visual, somatosensory, and auditory responses can be facilitated by acetylcholine (for review, see Rasmusson, 2000). Moreover, long-term potentiation in the hippocampus can be modulated by a variety of transmitters and hormones, including serotonin (5-HT), catecholamines, acetylcholine, and corticosterone (Gold et al., 1984; Corradetti et al., 1992; Kim and Yoon, 1998). Studying the direct contribution of modulatory pathways to information processing is often compromised by the technical difficulties of measuring release of modulatory transmitters. Indeed, many of these transmitters exert their effects through second messenger pathways, which often do not produce detectable postsynaptic potentials. In this respect, Aplysiaprovides a useful model system to explore the features of a modulatory system, because considerable experimental evidence supports the view that heterosynaptic plasticity of sensory neuron→motor neuron (SN→MN) synapses is mediated by 5-HT (Byrne and Kandel, 1996), a neurotransmitter readily detectable by electrochemical methods (Jackson et al., 1995; Bunin and Wightman, 1998).
In Aplysia, sensitization and classical conditioning of defensive reflexes can be induced by using tail shock as a reinforcing stimulus (Carew et al., 1981; Hawkins et al., 1983; Walters and Byrne, 1985). Tail shock modulates SN→MN transmission through an increase in SN excitability and through facilitation of SN→MN synapses (Carew et al., 1971; Walters et al., 1983). Considerable evidence suggests that 5-HT is responsible, at least in part, for the sensitizing effects of tail shock. For example, consider the following: (1) Depleting 5-HT levels by injection of the neurotoxin 5,7-dihydroxytryptamine blocks the ability of tail shock to sensitize the gill withdrawal reflex (Glanzman et al., 1989), and the 5-HT receptor antagonist cyproheptadine blocks the facilitating effects of tail nerve stimulation on SN→MN synapses (Mercer et al., 1991). (2) Exogenously applied 5-HT mimics the effects of tail shock by facilitating SN→MN synaptic transmission and increasing SN excitability (Brunelli et al., 1976; Walters et al., 1983). (3) Numerous serotonergic cells exist in the Aplysia nervous system, especially, in the abdominal, pedal, and cerebral ganglia (Kistler et al., 1985; Hawkins, 1989; Nolen and Carew, 1994). Moreover, a pair of identified serotonergic neurons, the cerebral B cluster (CB1) cells located in the cerebral ganglion, increase their firing after tail stimulation and directly induce facilitation of siphon SN→MN synapses (Mackey et al., 1989). (4) Finally, 5-HT is present in Aplysia hemolymph, and its concentration is increased in sensitized animals (Levenson et al., 1999).
Although serotonergic terminals have been shown to make synaptic contacts onto SN cell bodies (Zhang et al., 1991), direct evidence for 5-HT release in the Aplysia CNS is still lacking. Moreover, the concentration, duration, and regional specificity of 5-HT release evoked by tail shock have not been investigated. In this study, we characterized 5-HT release in the Aplysia CNS by (1) labeling the serotonergic processes surrounding the somata and processes of tail SNs, and (2) detecting 5-HT release evoked by tail nerve stimulation in the vicinity of SN somata or SN→MN synapses by chronoamperometry. We found that a brief tail nerve shock induced 5-HT release locally at SN somata and SN→MN synapses for ∼40 sec. Moreover, 5-HT release is graded as a function of the frequency of nerve stimulation and is accompanied by two forms of SN plasticity: increased excitability and synaptic facilitation. Interestingly, although SN excitability increased gradually with 5-HT release, synaptic facilitation increased in a clearly nonlinear manner. Finally, our studies have allowed us to characterize important features of the organization of the 5-HT modulatory system in Aplysia, including its functional lateralization and the existence of modulatory fields within subregions of the CNS.
Parts of this paper have been presented previously in abstract form (Marinesco and Carew, 2000)
MATERIALS AND METHODS
Preparation of tissue samples and nerve stimulation procedure. Wild-caught adult Aplysia californica(Marinus, Long Beach, CA) weighing 180–400 gm were used throughout this study. Animals were first anesthetized by injection of 150–200 ml of 0.35 m MgCl2 and immediately dissected to remove one set of pleural–pedal ganglia attached to the cerebral ganglion by the pleural–cerebral and the pedal–cerebral nerves, preserving at least 5 cm of the pedal tail nerve P9. The ganglia were then fixed in 0.4% glutaraldehyde for ∼30 sec to inactivate most muscle fibers that give rise to movements of the ganglia in response to tail nerve shock. The ganglia were then desheathed in 50:50 artificial seawater (ASW) with 0.35m MgCl2, to expose pleural tail SNs and pedal tail MNs (ASW contains, in mm: 460 NaCl, 55 MgCl2, 11 CaCl2, 10 KCl, and 10 Tris). For the experiments testing the lateralization of 5-HT release within theAplysia CNS, the entire ring ganglia were kept in the recording dish (both sets of pleural–pedal and cerebral ganglia), but only the right pleural and pedal ganglia were desheathed. In some experiments, the tissue was perfused in 0 Ca2+, 3× Mg2+-ASW (in mm: 295 NaCl, 176 MgCl2, 10 KCl, and 10 Trizma, pH 7.4). The ganglia were perfused with ASW for at least 30 min before the beginning of intracellular recording. Tail nerve shock was applied with a suction electrode using a 2 sec train of 5 msec 15 V pulses at various frequencies applied through a constant voltage stimulus isolation unit connected with a Grass stimulator (resulting current was ∼2 mA). Tail nerve shock usually evoked antidromic spikes in ∼10% of the cells in the sensory cluster. Although the results obtained from these cells were very similar to those from nonactivated neurons, we discarded them to exclude activity-dependent processes from our experiments.
Intracellular recordings. Tail SNs and MNs were impaled with intracellular glass micropipettes (5–15 MΩ) filled with 3m KCl. For physiological experiments examining synaptic transmission, the MN was hyperpolarized to −70 mV to prevent spiking. We took three tests at 15 min intervals to assess the baseline amplitude of the evoked EPSP in the MN. For each test, a single action potential was elicited in the SN by a 4 msec current pulse, and the resulting EPSP was measured in the MN. Synapses showing evidence of depression (>20% decrease over the three tests) were discarded. Approximately 10% of the preparations were excluded on the basis of this criterion (5 of a total of 48). Short-term synaptic facilitation (STF) 5 min after tail nerve stimulation was expressed as the percentage of increase from the baseline level (average of three pretests). This 5 min delay was chosen because it revealed maximal changes in EPSP amplitudes. Spike duration, determined in the same experiments, was measured as the time between peak and 33% of peak (Stark et al., 1996). Only those recordings in which the current pulse terminated well before the onset of the spike, both at the last pretest and the first post-test, were accepted in the data set to provide an unequivocal estimation of spike duration (20 of a total of 30 cases).
To assess changes in SN excitability induced by tail nerve shock, a single SN was depolarized for 300 msec every 2 min, using a current intensity sufficient to elicit two spikes in baseline conditions. One minute after tail nerve shock, the number of spikes produced by the same depolarizing pulse provided an estimate of the increase in SN excitability. This 1 min delay was chosen because pilot experiments showed that maximal changes in excitability were evidenced at this time point. The same SN was used to determine the effects of shocks at 5, 10, 20, and 40 Hz applied in a random order, at 30–40 min intervals.
Immunohistochemistry. In three preparations, we performed intracellular recordings of tail SNs to find two cells with a monosynaptic connection to a single tail MN. The MN was injected with dextran coupled to Texas Red (Molecular Probes, Eugene, OR) by ionophoresis for 30 min (5% dextran in 1 m KCl, +5 nA current pulses, each pulse 500 msec, at 1 Hz). Each SN was injected with Neurobiotin (Vector Laboratories, Burlingame, CA; same injection parameters). The intact ganglia were then fixed overnight with 4% paraformaldehyde (in 0.01 m PBS with 20% sucrose) at 4°C in preparation for 5-HT immunohistochemistry. Nonspecific binding was blocked by immersion in 2% goat serum (Sigma, St. Louis, MO) with 0.5% Triton X-100 for 1 hr before exposure to the rabbit polyclonal anti-serotonin antibody (Diasorin, Stillwater, MN) at 1:1000 for 2.5 d at 4°C. Visualization of the primary antibody to 5-HT was performed with a goat anti-rabbit secondary antibody directly coupled to Cy5 (Amersham Biosciences, Arlington Heights, IL; dilution 1:100, 2.5 hr at room temperature). Neurobiotin injected in both SNs was then revealed using avidin coupled to Alexa Fluor 488 (Molecular Probes; 10 μg/ml). Fluorescence images were acquired with a Bio-Rad (Hercules, CA) confocal microscope. Excitation was performed at 488, 568, and 647 nm wavelengths by a Kr-Ar mixed gas laser. We used standard T1/E2 filters with three detection filters of 522/35 nm (green pseudocolor), 605/32 nm (red), and 680/32 nm (blue). Fluorescence images shown in Figure 1 were obtained by projection of 10–15 optical sections spaced by 10 μm.
Electrochemical methods. Carbon fiber electrodes (CFEs) were made of a 7-μm-diameter carbon fiber (Goodfellow Cambridge Ltd., Huntington, UK) glued to an electric wire with electroconductive paint (RS Components) and threaded through a glass micropipette, the part extending out of the pipette being cut at 300 μm. Chronoamperometric recordings were performed with a VA10 voltammeter (NPI Electronic, Tamm, Germany) connected to a three-electrode potentiostat. The three-electrode design necessitated the use of reference and auxiliary electrodes both made of a chlorided silver wire (Medwire, Mount Vernon, NY). The auxiliary electrode was necessary to avoid passing current through the reference electrode, which could have slightly changed its potential. Data acquisition was achieved through a 16 bit acquisition card run with a homemade software based on Igor 3.14 procedures (Wavemetrics Inc., Lake Oswego, OR).
Two major electrochemical techniques were used in this study. For slower events that lasted several minutes, such as exogenous perfusion of 5-HT onto Aplysia ganglia, we used differential normal pulse voltammetry (DNPV). DNPV provides detailed measurements of dopamine (DA) or 5-HT concentrations, together with an estimate of oxidation potentials and background currents, two important parameters that could vary during the course of prolonged recordings (for review, see Kawagoe et al., 1993). DNPV consisted of a series of double voltage steps (prepulse, 40 msec; pulse, 15 msec/50 mV) applied every 300 msec, with the prepulse amplitude varying between 0 and 500 mV by 3 mV steps. Typical DNPV recordings provided differential voltage sweeps showing oxidation peaks associated with DA or 5-HT (see Figs. 2, 7). To measure faster events, we used chronoamperometry, which allows high-speed detection of oxidation currents. This technique was performed with four successive voltage steps (80 mV, 40 msec; 230 mV, 15 msec; 250 mV, 40 msec, and 400 mV, 15 msec) applied between the working and reference electrodes at 1 Hz. The amplitude of these pulses was set to induce DA oxidation at the second pulse and 5-HT oxidation at the fourth one. Pulse duration was empirically determined to obtain a stable baseline recording. Calibration experiments were performed in a flow-injection chamber (dimensions, 35 × 10 × 5 mm) perfused with ASW at a rate of ∼25 ml/min. 5-HT was injected into the chamber for 1 min by manually switching the perfusion line to a 5-HT solution. All drugs [5-HT, DA, and 5-hydroxytryptophan (5-HTP)] were purchased from Sigma.
Statistics. Statistical analyses were performed using a two-tailed Student's t test, except for comparisons between three or more groups, in which we used an ANOVA followed by a least significant difference (LSD) multiple-range test. The significance level was set at p = 0.05.
RESULTS
Immunohistochemical labeling of 5-HT fibers
To determine the location of serotonergic fibers relative to SN somata and SN→MN synapses, we performed triple-labeling experiments. Sensory neurons injected with Neurobiotin were visualized with a 522/32 nm filter (Fig. 1, green) with avidin-Alexa Fluor 488. SN processes originating in the pleural ganglion could be clearly resolved, traveling into the pedal ganglion, ∼5 mm away from the cell body. In three preparations, Neurobiotin was injected into SNs that were connected monosynaptically to an MN (confirmed by electrophysiological recordings), and the MN was injected with Texas Red-dextran and visualized with a 605/32 nm filter (Fig. 1,red). The putative region of SN→MN synaptic contacts could therefore be determined where SN axons came into close apposition with MN processes.

Immunohistochemical localization of serotonergic fibers in close proximity to tail SNs. A, Schematic diagram of the preparation. Two SNs (green) in the pleural ganglion (g.) were identified in electrophysiological experiments as monosynaptically connected to a tail MN (red) in the pedal ganglion. Serotonergic fibers (blue) envelop the SN cell bodies in the pleural ganglion. Only one stained soma is apparent in the confocal plane. 5-HT-immunoreactive neurites overlaying the stained SN cell body appearwhite (B). Serotonergic fibers also travel into the pedal ganglion (C, D), where the SNs are known to synapse onto the MNs. Arrowheads show serotonergic varicosities. White boxes show examples of regions where 5-HT, SN, and MN processes are in close proximity. Scale is the same in B and D.
Serotonergic fibers were visualized with a 680/32 nm filter (Fig. 1,blue) using the fluorophore Cy5. Staining disappeared with omission of the primary anti-serotonin antibody, showing that it was specific for 5-HT (data not shown). Confirming previous observations (Zhang et al., 1991), we found widespread serotonergic processes in the vicinity of SN cell bodies and axons (for related observations in the abdominal ganglion, see Kistler et al., 1985). The densest innervation was present in the pleural ganglion, around the SN somata (Fig.1B). Serotonergic fibers formed a network of fine varicose processes around the SN cell bodies that allowed visualizing numerous SNs not stained with Neurobiotin. Indeed, these cells appeared as spheres embedded in a basket of 5-HT fibers. Serotonergic processes were also present along the course of SN axons, in the pleural–pedal connective and the pedal ganglion, where SN→MN synapses are located (Fig. 1C,D). Serotonergic fibers were often seen in close proximity to SN and MN processes (Fig. 1C,D,boxes). Because the fluorescence images shown in Figure 1represent the projection of optical sections over ∼100–150 μm of tissue (see Materials and Methods), the minimal distance between these three elements was often difficult to accurately determine. In some cases, however, 5-HT, SN, and MN processes were observed within 10–20 μm on the same confocal plane (data not shown). Numerous 5-HT fibers showed varicosities (white arrows) that could represent active release sites in these areas (Soghomonian et al., 1988; Zhang et al., 1991). These varicosities were often seen in close proximity to SN and MN cell bodies and processes, suggesting that 5-HT is released at these sites and can exert modulatory effects on both the SN somata and processes.
Chronoamperometric detection of 5-HT
Electrochemical measurements in Aplysia require ASW as the supporting electrolyte instead of the usual phosphate buffers (Dugast et al., 1994), HEPES buffers (Jackson et al., 1995) or Ringer's solutions. Compared with PBS, ASW produced a 45% decrease in 5-HT sensitivity (n = 6; p < 0.05), as evidenced by a diminution in the DNPV oxidation peak height obtained in solutions of 200 nm 5-HT (Fig.2A,B, see Materials and Methods). Oxidation potentials were also shifted 40 mV more positive in ASW compared with PBS, with DA and 5-HT oxidizing at 170 and 340 mV (vs Ag/AgCl), respectively. This shift could be attributed to the slightly different pH of ASW (7.6 vs 7.4 for PBS) and the higher concentration of Cl− ions that changed the reference potential of the Ag/AgCl wire. Overall, these changes are compatible with the higher ionic strength of ASW, because Ca2+ and Mg2+ions are known to diminish the sensitivity of CFEs to electroactive cations (Kume-Kick and Rice, 1998). After implantation in anAplysia ganglion, the CFEs showed an additional decrease in sensitivity. After removal from the ganglion, the height of DNPV oxidation peaks obtained in solutions of 200 nm5-HT in ASW was diminished by ∼60% compared with its value before the experiment (n = 24; p < 0.05; Fig.2A,B). This decrease, however, did not depend on the time spent in the tissue, because it was similar after 15, 30, 60, and 150 min of implantation (n = 8, 5, 6, and 5, respectively; Fig. 2B). This type of decrease in the sensitivity of CFEs in neural tissue is a common observation in mammalian systems (Stamford, 1986). It occurs during the first few minutes of implantation in the tissue and likely reflects rapid diminution in the sensitivity of the CFE that is attributable to protein coating of the carbon surface. The most important feature of these experiments is that, ∼15 min after implantation, the CFEs provided reliable measurements of 5-HT release for >2 hr.

Effects of ASW and nervous tissue on electrode sensitivity for 5-HT. A, Examples of DNPV recordings obtained in a solution of 200 nm 5-HT diluted in PBS and ASW before implantation in the nervous tissue and after implantation. Oxidation peaks are highlighted by shading. Sensitivity is assessed by the height of the oxidation peak. It is greater in PBS than in ASW, and implantation of the electrode in the nervous tissue further decreases 5-HT sensitivity. B, Summary experiments of all DNPV recordings. Histograms represent the height of 5-HT oxidation peaks before and after a 15–150 min implantation in ganglia. The loss of sensitivity after implantation in the ganglion is similar after 15, 30, 60, and 150 min spent in the ganglion, suggesting stable reliable 5-HT detection in this time range.NS, Not significant. ∗p < 0.05.
Because epinephrine and norepinephrine have never been detected in theAplysia nervous system, the major possible interfering molecule in this potential range is DA. The DNPV voltammogram shown in Figure 3A was obtained in a solution containing 200 nm 5-HT and 1 μm DA. The oxidation peaks were well separated, suggesting that the oxidation currents from both transmitters could be easily differentiated and that selective measurement of 5-HT was possible. Indeed, we were able to measure oxidation currents corresponding to both substances using a chronoamperometric sequence consisting of four pulses at 80, 230, 250, and 400 mV, respectively, applied to the CFE once every 1 sec. The typical currents flowing through the CFE are shown in Figure 3B. The difference between the currents at the end of the second and first pulses represented oxidation currents in the DA range, whereas the difference between the currents at the end of the fourth and third pulses (δI = I4 −I3) reflected oxidation in the 5-HT range. This difference δI was referred to as “5-HT oxidation current” or “oxidation current in the 5-HT range” throughout this study.

Chronoamperometry allows rapid and selective detection of 5-HT. A, DA and 5-HT are oxidized, respectively, at 170 and 340 mV versus Ag/AgCl. DNPV recordings were obtained in a solution containing 200 nm 5-HT and 1 μm DA diluted in ASW. B, Chronoamperometry measurements were made with four pulses at 80, 230, 250, and 400 mV. The difference in the current at the end of the first two pulses represents substances oxidizing in the 80–230 mV range (DA), whereas the difference measured at the end of the last two pulses (δI) reflects oxidation of compounds in the 250–400 mV range (5-HT).C, Chronoamperometric recordings obtained in a flow-injection chamber where 5-HT was injected at various concentrations for 1 min. The corresponding electrodes had already been implanted in a ganglion. The bottom recording was performed on injection of DA (500 nm). D, The difference δI is linear with 5-HT concentration through the relation [5-HT] (nanomolar) ∼ 5.2 × δI (picoamperes). The light lines reflect individual electrodes; the bold line reflects the best linear fit to the responses of all electrodes.
This technique was first validated in a flow-injection chamber where 5-HT was injected for 1 min at concentrations ranging from 50 to 500 nm (see Materials and Methods). The oxidation current in the 5-HT range was quickly elevated after injection of the 5-HT bolus into the chamber, reaching a plateau within ∼30 sec (Fig.3C). The exact response time of the CFE could not be evaluated, however, because it took several seconds to completely replace the medium in the chamber. When DA was injected instead of 5-HT, very little oxidation current was recorded in the 5-HT range, probably because our carbon fiber had a low sensitivity to DA compared with 5-HT (Fig. 3A), because most of the DA molecules were already oxidized at the second and third pulses, or both. This result indicates that interference between the two recording ranges was minimal. Some cross talk could still be detected, because 500 nm DA injected into the flow injection chamber produced a small signal in the 5-HT potential range (Fig.3C), less than that of 50 nm 5-HT. This oxidation current produced by DA could possibly be an artifact induced by the constant flow of electroactive molecules in the chamber that could have changed the diffusion parameters around the carbon fiber, washing away oxidized molecules and providing new ones for oxidation at a faster rate than in the ganglion and, therefore, increasing the number of DA molecules available for oxidation at the fourth pulse. However, to check for possible contamination of the signal by DA, recordings were always performed in both the DA (80–230 mV) and the 5-HT (250–400 mV) range. These data show that our CFEs allow primarily independent and selective measurements of both compounds, confirming previous studies by Nakazato and Akiyama (1999)in the rat CNS.
A representative sample of six CFEs was calibrated after being implanted in a ganglion to provide the closest evaluation of their performance in the tissue. For this purpose, the CFEs were removed from the ganglion and tested in the flow-injection chamber with fresh 5-HT solutions. The detection limit for 5-HT was ∼30 nm, and the response of CFEs to 5-HT was linear with concentration through the relationship: [5-HT] ∼ 5.2 × δI(r = 0.94; Fig. 3D). Because the sensitivity of the CFEs was slightly variable between different electrodes, this relationship provides an approximate estimation of 5-HT concentration, the linearity factor being 5.21 ± 0.85 nm/pA (n = 6). This factor was used throughout the study to convert 5-HT oxidation currents into estimates of concentration.
The CFEs were implanted in ganglia at two different locations in the neuropil: underneath SN cell bodies, in the pleural ganglion, and underneath MN cell bodies, in the pedal ganglion (Fig.4). Usually, two or three DNPV recordings were first performed between −50 and 450 mV at 5 min intervals. Voltammograms were typically U-shaped (no oxidation peaks), like those obtained in ASW, indicating that no metabolites were present in the tissue at detectable levels (see Fig. 7B, first two voltammograms). This situation differed from DNPV recordings obtained in mammals, where several oxidation peaks are apparent in control conditions, corresponding to ascorbic acid, dihydroxyphenyl-acetic acid, 5-hydroxyindoleacetic acid, and uric acid (Gonon et al., 1980; Cespuglio et al., 1986). Thus, in contrast to the mammalian CNS, where 5-hydroxyindoleacetic acid (5-HIAA) and uric acid oxidize at approximately the same potential as 5-HT and interfere with its detection, the Aplysia nervous system provides a much simpler situation without any oxidizable metabolite being present in the 5-HT range. Indeed, 5-HT in Aplysia is not deaminated into 5-HIAA, as in mammals, but is metabolized into a sugar conjugate (Goldman and Schwartz, 1977), which was not detected by our CFEs in the ganglia.

Typical chronoamperometric recordings obtained in the CNS. The CFEs were implanted in the pleural ganglion, under the SN cell bodies and in the pedal ganglion, under the MN cell bodies (A, schematic diagram). The recorded oxidation current (δI) is increased after tail nerve shock in the 5-HT range (top pair of traces) but not in the DA range (bottom pair of traces). 5-HT signals were similar in the pleural (B) and the pedal (C) ganglia. The area under the 5-HT signal is highlighted by shading in this and subsequent figures. A 2 sec stimulation artifact was generated during tail nerve stimulation.
Chronoamperometric recordings were then performed while the tail nerve P9 was stimulated for 2 sec at 40 Hz (Fig. 4A; see Materials and Methods). Tail nerve shock typically elicited a rapid increase in the 5-HT oxidation current, without any noticeable effects in the DA range (Fig. 4B,C). In a few cases, however, an increase in the DA oxidation current could also be detected but was always considerably smaller than the effect in the 5-HT range (10–15% of all recordings). Because the sensitivity of our CFEs is low for DA, the possibility of modest DA release in our experiments cannot be excluded. However, our data show that even if it exists in the ganglia, DA release cannot account for the signal detected in the 5-HT range. The 5-HT oxidation current reached its maximum between 4 and 6 sec after the end of the shock and returned to baseline after ∼40 sec, as shown on traces in Figures 4-9. The 5-HT signal was calculated as the difference between the maximal oxidation current recorded after tail nerve stimulation and the average oxidation current during the 5 sec preceding the shock. The rapid rise in the oxidation current measured in the 5-HT range was inconsistent with possible effects of metabolites, which usually show much slower kinetics (Houdouin et al., 1990, 1991), and further confirmed that the electrochemical signal measured in the 5-HT range reflected neurotransmitter release.
The 5-HT signals in both ganglia were comparable: 19.2 ± 16.3 pA in the pleural ganglion (n = 59) and 17.5 ± 12.3 pA in the pedal ganglion (n = 67). In the same animal, the signal could be obtained very reliably several times. Typically, P9 shock was applied 5 times at 20 min intervals, with only an ∼10% decrease between the first and last evoked signals (control experiments in Figs. 5,6).

The electrochemical signal evoked by tail nerve stimulation relies on chemical synaptic transmission. The 5-HT signal is reversibly blocked by perfusion of 3× Mg2+, 0 Ca2+ ASW (see Materials and Methods).A, Individual traces obtained before, during, and after Ca2+ omission. B, Summary data obtained with six experiments. Low-Ca2+ treatment resulted in a complete (0%) block of the signal in all preparations. The amplitude of the signal was restored to its control level after 20 min in normal ASW. Error bars indicate SEM. ∗p < 0.05.

The 5-HT precursor 5-HTP increases the electrochemical signal evoked by a tail nerve shock. A, Typical recordings before and after 5-HTP application.B, Summary data showing that the effect of 5-HTP lasts at least 1 hr after washout (n = 8). * indicates significant difference from control recordings (p < 0.05). Error bars indicate SEM. Data are normalized to the amplitude of the first 5-HT signal at time0. Stim, Stimulation.
In another set of experiments, the dependency of the electrochemical signal on synaptic transmission was tested by perfusing the tissue with ASW containing three times the usual concentration of Mg2+ and no Ca2+ (see Materials and Methods). By this procedure, Mg2+ ions compete with the Ca2+ ions and block neurotransmitter release (Katz and Miledi, 1967). After 20 min in 3× Mg2+, 0 Ca2+ASW, the electrochemical signal evoked by tail nerve stimulation was completely blocked in all preparations (n = 6;p < 0.01) and returned to its control amplitude 20 and 40 min after normal ASW was restored (Fig. 5). The disappearance of the electrochemical signal in low-calcium conditions could be attributable to the inhibition of Ca2+-dependent 5-HT release, the diminution of excitatory input onto 5-HT neurons, or both. In any case, this result shows that the electrochemical signal evoked by P9 nerve stimulation was not an artifact attributable to tail nerve stimulation per se but depended on normal chemical synaptic transmission in the CNS.
Finally, to further confirm the relationship between the 5-HT signals recorded at our CFEs and the actual 5-HT release in the ganglia, the 5-HT precursor 5-HTP was applied to the bath at 1 mm for 20 min after one baseline measurement. In both ganglia, when the tail nerve was stimulated in the presence of 5-HTP, the signal rose to ∼400% from its control amplitude. This augmentation persisted for >1 hr after washout [the data in Fig. 6 reflect the combination of experiments in the pleural ganglion (n = 2) and in the pedal ganglion (n = 6)]. A two-way ANOVA revealed a significant effect of time and treatment, with a significant difference between 5-HTP and control signals at all time points after application of the drug (p < 0.05). Because 5-HTP is the rate-limiting precursor of 5-HT and specifically increases 5-HT synthesis and release, as shown by microvoltammetric experiments byFickbohm and Katz (2000), this result indicates that the electrochemical signal recorded in our experiments is very likely to represent 5-HT release in the vicinity of the CFE.
Comparison between endogenous release and exogenous 5-HT application
We next estimated the peak 5-HT concentration released in the SN→MN synaptic neuropil using a calibration factor obtained in a representative sample of electrodes (tested in a flow-injection chamber after being implanted in the ganglia). After nerve stimulation, the peak 5-HT concentration reached the 100 nm range ∼4–6 sec after tail nerve stimulation. This value reflected the diffusion of 5-HT from release sites where exocytosis occurred in the neuropil. Is this estimate representative of the 5-HT concentration necessary to bind 5-HT receptors and activate second messenger pathways involved in synaptic plasticity? In most studies, SN plasticity inAplysia ganglia is induced by exogenous application of 5-HT into the recording chamber (Brunelli et al., 1976; Walters et al., 1983; Mercer et al., 1991; Byrne and Kandel, 1996; Stark et al., 1996;Sherff and Carew, 1999). Under these conditions, because of active 5-HT transport mechanisms as well as possible diffusion barriers, it is likely that only a small fraction of the 5-HT applied into the chamber diffuses into the neuropil and binds to specific 5-HT receptors.
We have found that both tail nerve stimulation at 40 Hz and exogenous application of 10–50 μM 5-HT produce maximal effects on tail SN plasticity under our current experimental conditions. This raises the question of whether nerve stimulation and exogenous 5-HT lead to similar 5-HT concentrations in the neuropil. Using CFEs implanted underneath the tail MN cell bodies in the pedal ganglion, we estimated the 5-HT concentration that reached the putative region of SN→MN synapses after exogenous application of 50 μm 5-HT (Fig.7A). Because the time course of 5-HT penetration in the neuropil is slow, and variations in baseline currents can occur during 5-HT application, we used DNPV to evaluate the oxidation currents in the 5-HT potential range. With this method, background current shifts do not interfere with the measurement of oxidation currents, and oxidation potentials can be recorded (see Materials and Methods). As reported previously, baseline voltammograms were U-shaped because no oxidation peaks were present in control conditions (Fig. 7B). Three to 20 min after 5-HT application, an oxidation peak appeared at ∼350 mV, reflecting 5-HT or 5-HT-related molecules. The CFE was then taken out of the ganglia and tested with 500 nm 5-HT to provide an estimation of the 5-HT concentration measured in the neuropil (Fig.7B). The estimated concentration was highly dependent on the position of individual CFEs, probably reflecting a steep gradient of 5-HT concentration, because this molecule diffused from the bath into the neuropil against the 5-HT reuptake system. Assuming the oxidation peaks detected in the ganglia reflected 5-HT only, the mean 5-HT concentration at 5 min of 50 μm 5-HT application was ∼990 nm (median of eight different recording sites in four ganglia, 970 nm–2.7 μm interquartile range). This estimated concentration reached a plateau at ∼1.7 μm after 10 min (Fig. 7C). With 10 μm 5-HT application, concentrations in the neuropil reached a median of 80 nm after 5 min (seven recordings in four different animals, 0–290 nm interquartile range) and continued to increase up to 430 nm (360–830 nminterquartile range) after 20 min (Fig. 7D). However, the 5-HT concentration produced by exogenous application might have been overestimated for two reasons: (1) given the high concentration of 5-HT applied to the tissue, 5-HT metabolites might have been raised above the detection limit of our CFEs, and this may possibly have interfered with the oxidation peaks measured at 350 mV; and (2) the CFE was implanted near the surface of the pedal ganglion. Penetration of the carbon fiber was at a 15° angle, ∼500 μm deep. It is possible that exogenous 5-HT had better access to the CFE than to the neuropil by diffusing along the shaft of the electrode. Therefore, these results provide an upper limit for the concentrations of exogenous 5-HT required to induce plasticity at tail SNs. This limit (between 80 and 990 nm for 10 and 50 μmexogenous 5-HT, respectively) is consistent with our estimated effective concentration of 5-HT release of ∼100 nm evoked by tail nerve stimulation.

Exogenously applied 5-HT reaches physiological concentrations in the tail SN→MN synaptic neuropil. A, Schematic representation of the preparation. B, Representative voltammograms measured in the pedal SN→MN synaptic neuropil during perfusion of 50 μm 5-HT into the bath. Oxidation peaks at the 5-HT oxidation potential (340 mV) areshaded. At the end of the experiment, the electrode was removed from the ganglion and tested in a standard solution of 500 nm 5-HT (std) to estimate the concentrations that had reached the neuropil during 5-HT perfusion. C, Summary graph of estimated 5-HT concentrations in the SN→MN synaptic region during perfusion of 50 μm 5-HT (data are medians ± interquartile range; n = 8).D, Summary graph for 10 μm 5-HT (data as in C). The median concentration after 5 min of 5-HT is 80 and 990 nm (for 10 and 50 μm,respectively), which is close to the estimated 5-HT release evoked by tail nerve shock (see Results).
Spatial organization of 5-HT release
Because serotonergic cell bodies or processes are present in the entire CNS, and 5-HT is known to exert diverse modulatory actions, it was of interest to determine whether 5-HT release evoked by tail nerve stimulation is widespread or restricted to specific regions of the CNS. To examine this question, we first measured 5-HT signals in two different locations within the pedal ganglion. The CFEs were first implanted as before, underneath the tail MNs (Fig.8, top, region A), and then moved to a second recording site, 500 μm more caudal (Fig.8, top, region B). Serotonin signals evoked by tail nerve stimulation were recorded in both sites. Tail nerve stimulation for 2 sec at 40 Hz evoked clear 5-HT release in the vicinity of the tail MNs (35 ± 14 pA; n = 8) but not 500 μm more caudally (Fig. 8, bottom). Indeed, 5-HT signals were completely undetectable at this second location in all but one of the eight preparations examined. This effect was not attributable to a loss of sensitivity of the CFEs after deeper penetration into the ganglia, because when the electrode was pulled back to the first recording area, clear 5-HT release was again still detected (n = 2).

The 5-HT signal in the pedal ganglion is localized to a discrete subregion of the neuropil. Top, The carbon fiber electrode was inserted in the pedal ganglion, underneath the MN cell bodies for the first recording (region A), and moved 500 μm more caudal for the second recording (region B). Bottom, The 5-HT signal was maximal in the MN area, undetectable 500 μm more caudal, and restored when the electrode was moved back to region A.
In a second set of experiments, we determined the degree of lateralization of 5-HT release within the CNS. The ring ganglia were kept intact (Fig. 9A), with the right pleural and pedal ganglia desheathed as before (see Materials and Methods). The left and right tail nerves were then connected to suction electrodes to allow electrical stimulation of the ipsilateral or contralateral side. Serotonin signals in the pleural and pedal ganglia were comparable, with maximal signals always evoked by ipsilateral stimulation (44 ± 17 pA in the pleural ganglion and 44 ± 15 pA in the pedal ganglion; n = 6) and minimal signals by contralateral shock (5 ± 5 pA in the pleural ganglion and 4 ± 4 pA in the pedal ganglion; n = 6; p < 0.01; Fig. 9B,C). The signals evoked by contralateral shocks were often close to the detection limit of the CFE but could be identified unequivocally in 5 of 12 cases (Fig.9B, Pedal). Thus, there is clear functional lateralization of 5-HT release in response to tail nerve stimulation.

The 5-HT signal is lateralized to the ipsilateral side of the stimulation. A, Schematic view of the ring ganglia, ventral side up, with both tail nerves connected to a stimulating electrode. B, Chronoamperometric recordings were performed in the pleural and pedal ganglia. The 5-HT signal was maximal after ipsilateral (Ipsi) tail nerve stimulation and was barely detectable after a contralateral (Contra) shock. C, Summary of six different preparations. The 5-HT signal evoked by contralateral stimulation was ∼10% of the one induced by ipsilateral stimulation. Error bars indicate SEM. * indicates significant difference between ipsilateral and contralateral stimulation,p < 0.05.
Correspondence between 5-HT signals and SN plasticity
Tail shock has been shown to sensitize various defensive reflexes by enhancing SN excitability and synaptic transmission from SNs to MNs (Walters et al., 1983). To determine whether these forms of cellular plasticity are correlated with 5-HT release, we varied the strength of tail nerve stimulation by gradually increasing the frequency of the pulses used to produce tail nerve shock. The effects of P9 shock at 5, 10, 20, and 40 Hz on SN excitability are shown in Figure10B. The number of spikes increased progressively with shock frequency, from two or three spikes with 5 Hz shock to approximately seven spikes with 40 Hz stimulation (n = 8; p < 0.05; Fig.10C). An ANOVA revealed a significant effect of stimulation frequency on SN excitability (F(4,35)= 13.6; p = 0.001). An LSD post hoc analysis showed a significant difference between no shock and 10, 20, and 40 Hz (p = 0.049, 0.001, and 0.001, respectively), between 5 and 20 and 40 Hz (p = 0.002 and 0.001, respectively), and between 10 and 20 and 40 Hz (p = 0.017 and 0.001, respectively).

Varying the frequency of tail nerve stimulation modulates the amplitude of 5-HT release and its ability to increase SN excitability. A, Representative 5-HT responses evoked by 2 sec tail nerve shocks with frequencies ranging from 5 to 40 Hz applied at 30 min intervals. Right panel, Summary of chronoamperometry data. The evoked 5-HT signal progressively increases with shock frequency, ranging from 50 nm (5 Hz) to 170 nm (40 Hz) (n = 6). B, Example of SN excitability after 5, 10, 20, and 40 Hz stimulation.Right panel, Excitability also increases progressively with shock frequency (n = 8). Error bars indicate SEM. * and ** indicate significant difference from control and 5 Hz conditions, respectively (see Results). Stim, Stimulation.
In different animals from the same experimental group, 5-HT release in the vicinity of SN cell bodies (see Figs. 1B,3A) also progressively increased with shock frequency, from ∼55 nm at 5 Hz to ∼160 nm at 40 Hz (n = 6;p < 0.05; Fig. 10A). An ANOVA revealed a significant effect of stimulation frequency on the 5-HT signal (F(4,25) = 5.6;p = 0.002). An LSD post hoc analysis showed a significant difference between no shock and 10, 20, and 40 Hz (p = 0.013, 0.002, and 0.001 respectively) and between 5 and 40 Hz (p = 0.011). These data thus show that, under our experimental conditions, a progressive increase in 5-HT release onto SN cell bodies is strongly correlated with the progressive increase in SN excitability after P9 shock.
In a parallel set of experiments, we assessed the effect of tail nerve shock at different frequencies (3, 5, 10, and 30 Hz) on facilitation of SN→MN synapses and 5-HT release in the synaptic region (Fig.1D). A monosynaptic connection between a tail SN and a tail MN was monitored every 15 min (see Materials and Methods). SN→MN synapses typically showed STF after 10 and 30 Hz stimulation, but interestingly, facilitation at 3 and 5 Hz was only marginal (n = 6; Fig. 10B), although there was clear release of 5-HT at these frequencies (Fig.11A; see below). Facilitation was not significantly different between 10 and 30 Hz, each reaching a level of an approximately +150% increase from baseline 5 min after nerve shock (+175 ± 22% and +145 ± 11%, respectively; Fig. 11B). Among the six synapses tested with a 5 Hz shock, one showed complete STF (+105%), whereas the others were only marginally facilitated (+23 ± 11%). When no shock was applied, the synapses remained at their baseline level with a slight tendency toward depression (−6 ± 7%; n = 6). An ANOVA showed a significant effect of shock frequency on STF (F(4,25) = 34.6; p = 0.001). An LSD post hoc test showed a significant difference between control and 5, 10, and 30 Hz (p = 0.043, 0.001, and 0.001, respectively), between 3 and 10 and 30 Hz (p = 0.001 in both cases), and between 5 and 10 and 30 Hz (p = 0.001 in both cases).
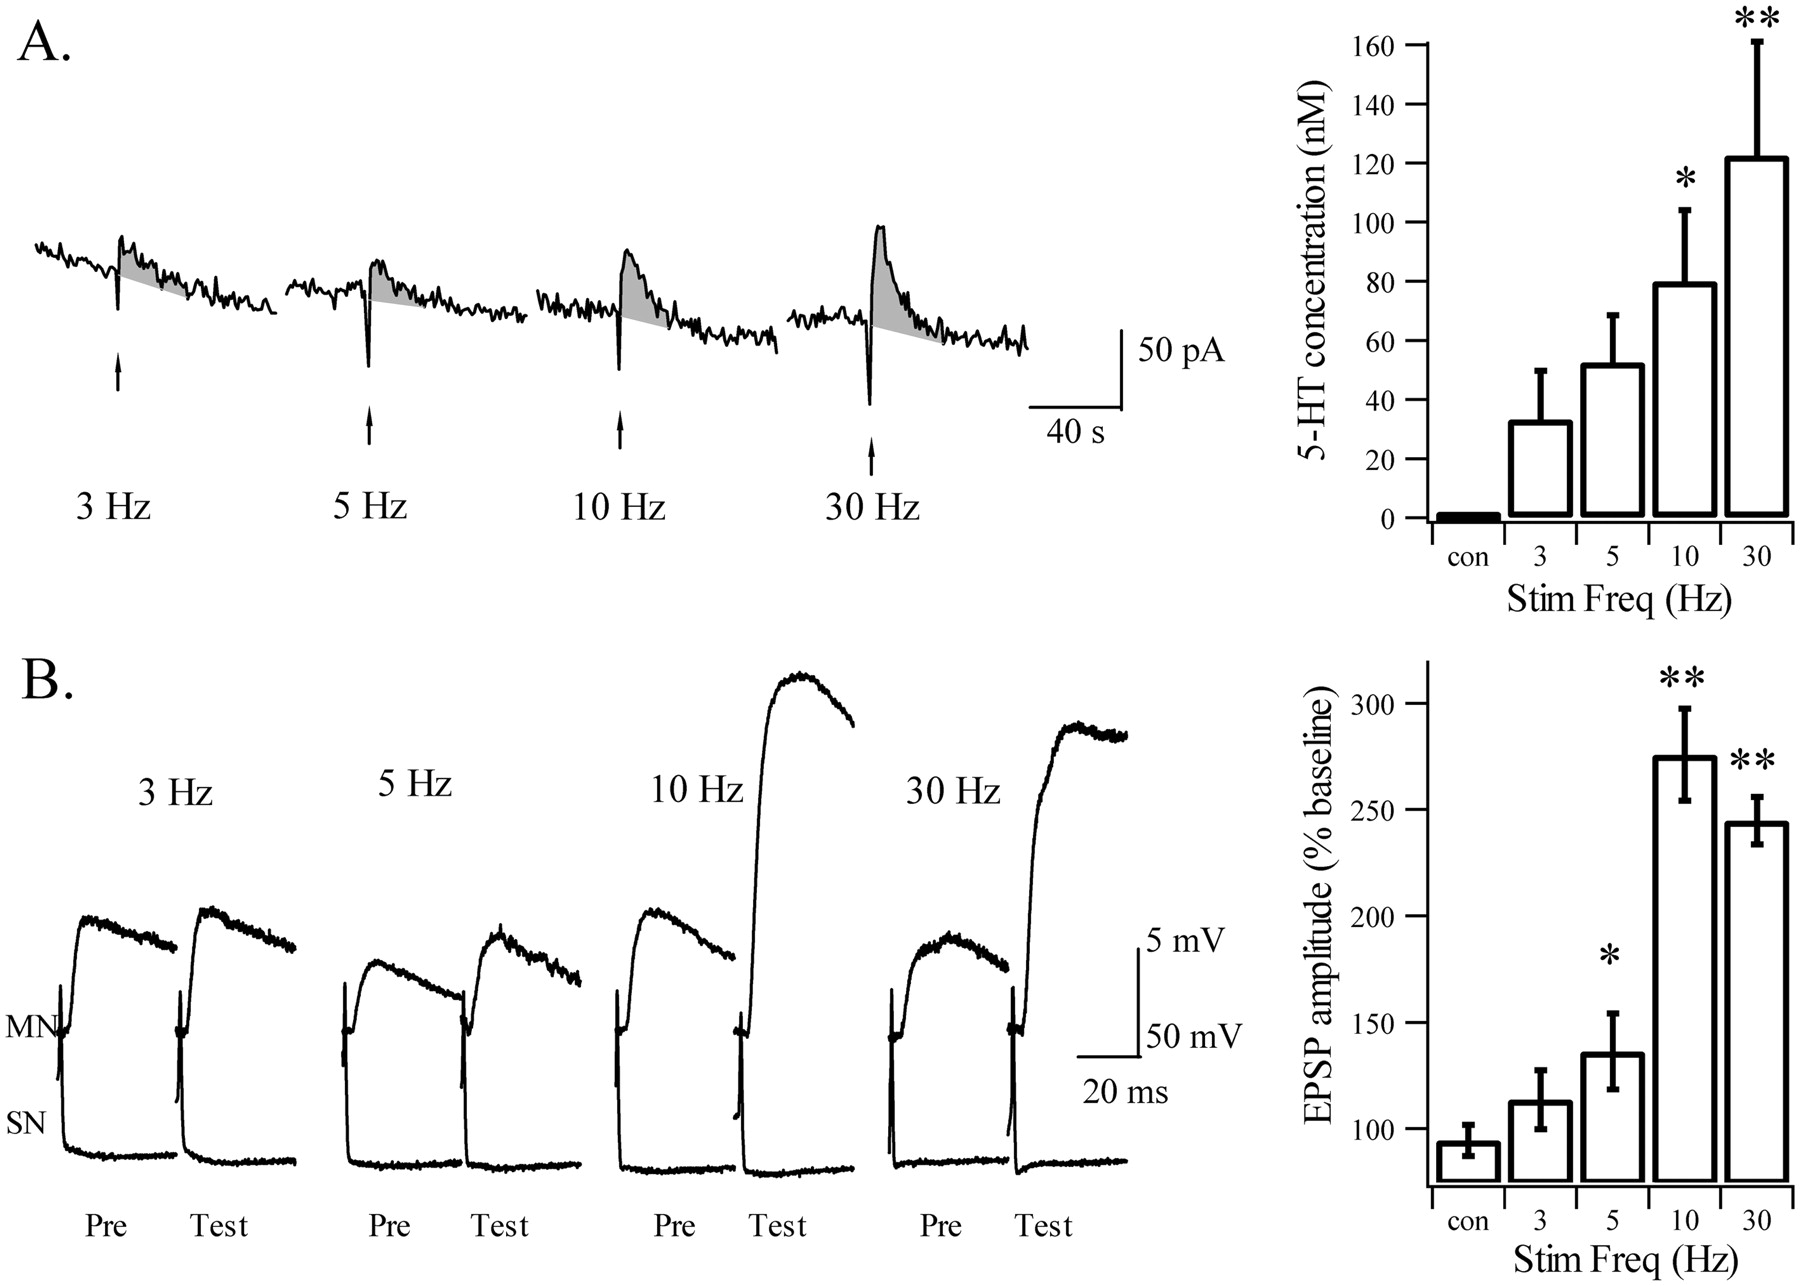
Effects of tail nerve shock on facilitation of SN→MN synapses. A, Examples of 5-HT signals evoked by 2 sec shock frequencies ranging from 3 to 30 Hz applied at 30 min intervals.Right panel, Mean 5-HT concentrations evoked by tail nerve stimulation (Stim) at the same frequencies (Freq) (n = 6). As before (Fig. 9), the signal progressively increases with stronger stimulation.B, Examples of the effects of tail nerve shock on an SN→MN synapse. STF is induced at 30 and 10 but not at 3 Hz; a small but significant facilitation appears at 5 Hz. A discontinuity in the induction of STF appears between 5 and 10 Hz, corresponding to ∼60 nm 5-HT. * indicates significant difference from no shock; ** indicates significant difference with combined control (con) 3–5 Hz conditions (see Results). Pre, Before P9 shock.
In different animals from the same experimental group, 5-HT release was assessed in the synaptic region and increased progressively with frequency of nerve stimulation, from ∼30 nm with 3 Hz shock to ∼120 nm with 30 Hz shock (n = 6; Fig. 11A). An ANOVA showed a significant effect of shock frequency on the 5-HT signal (F(4,25) = 5.03; p = 0.004). An LSD post hoc analysis showed a significant difference between no shock and 10 and 30 Hz (p= 0.011 and 0.001, respectively), between 3 and 30 Hz (p = 0.005), and between 5 Hz and 30 Hz (p = 0.025). Thus, these results revealed a clear discontinuity for induction of STF at tail SN→MN synapses, apparent between 5 and 10 Hz and corresponding to an estimated release of ∼60 nm 5-HT.
To further analyze this apparent discontinuity in the induction of STF, we performed a frequency histogram analysis on all the synapses studied in this set of experiments (Fig.12B). Two well separated populations were revealed with this analysis: a first group centered around +0%, corresponding to the slightly or nonfacilitated synapses (n = 17), and a second one, centered around +150%, corresponding to the synapses that showed STF (n = 13). The existence of a clear gap between the two groups (there was no case between +56 and +105% facilitation) and the fact that the population of facilitated synapses was correctly fitted by a single Gaussian (χ2 = 2.05; df = 10; p > 0.95) suggested that STF at these synapses is induced in a nonlinear manner. A comparable frequency histogram analysis of SN excitability (Fig. 12A) showed only a single population of cases, indicating that, in contrast to STF, SN excitability increased progressively with shock frequency.
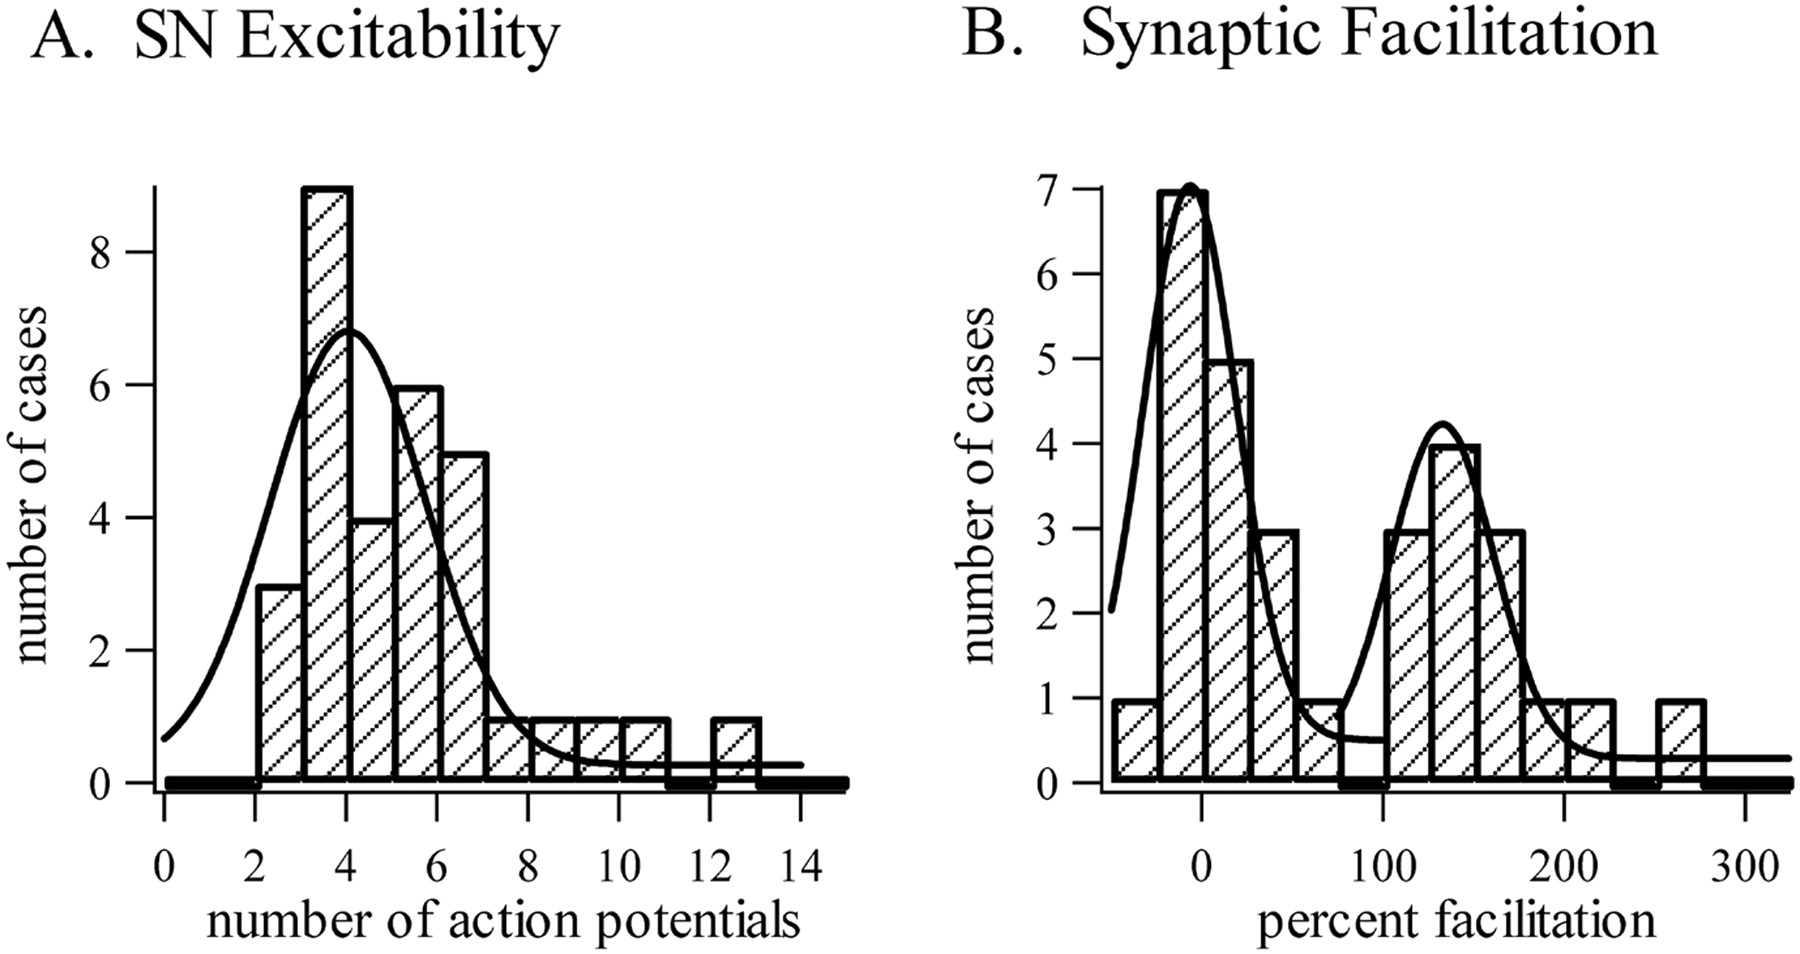
Frequency histogram analysis of the effects of tail nerve stimulation on SN plasticity. Individual experiments aimed at assessing increases in SN excitability or facilitation of SN→MN synapses are plotted in A and B, respectively. Whereas excitability increases continuously with shock frequency, synaptic facilitation analysis shows two well separated groups of data: one centered around 0 (nonfacilitated synapses) and the other at approximately +150% (facilitated synapses).
At least two processes are known to contribute to STF at tail SN→MN synapses: a spike-broadening dependent process, and a second process, thought to involve changes in transmitter mobilization (Hochner et al., 1986; Braha et al., 1990; Klein, 1994; Byrne and Kandel, 1996). Spike broadening is typically seen shortly (1 min) after tail nerve stimulation (Mercer et al., 1991). In this study, however, no spike broadening was observed 5 min after P9 shock at any of the frequencies tested. For nonfacilitated synapses, mean spike duration was 0.92 ± 0.05 msec before shock and 0.94 ± 0.03 msec 5 min after shock (n = 7), whereas for facilitated synapses, mean spike duration was 0.90 ± 0.08 msec before shock and 0.93 ± 0.09 msec 5 min after shock (n = 13). These data thus indicate that the discontinuity seen in STF induction was independent of spike broadening.
DISCUSSION
Both behavioral sensitization of defensive reflexes and heterosynaptic plasticity at Aplysia SN→MN synapses are thought to be mediated at least in part by serotonergic input from modulatory interneurons (Brunelli et al., 1976; Walters et al., 1983;Glanzman et al., 1989; Mackey et al., 1989; Mercer et al., 1991; Zhang et al., 1991). In this study, 5-HT release by sensitizing stimuli was characterized by using two different techniques: an immunohistochemical analysis of 5-HT terminals contacting tail SN somata, processes, and synapses onto tail MNs and electrochemical detection of 5-HT release evoked by tail nerve shock.
Immunohistochemical staining of 5-HT terminals
Immunohistochemically labeled 5-HT fibers formed a dense network of processes surrounding SN cell bodies in the pleural ganglion. Varicosities on these processes suggested that serotonin was released at these sites, confirming a previous study by Zhang et al. (1991) and related observations in the abdominal ganglion (Kistler et al., 1985). Indeed, Zhang and colleagues (1991) identified serotonergic synapses onto SN cell bodies, demonstrating a direct input onto these cells. Our results show, in addition, that serotonergic fibers are present around SN axons in the pleural–pedal connective and in the pedal ganglion, where SN→MN synapses are present. In a few instances, SN, MN, and 5-HT processes could be visualized in close proximity (within 20 μm), an observation consistent with recent findings of Zhang et al. (2001). Collectively, these observations support the view that 5-HT modulation occurs at SN→MN synapses.
Maximal concentration of 5-HT release evoked by tail nerve stimulation
Chronoamperometric recordings performed in the same areas where 5-HT-immunoreactive processes have been observed (SN cell bodies in the pleural ganglion and MN cell bodies in the pedal ganglion) revealed clear 5-HT release evoked by tail nerve stimulation. The electrochemical signal detected in our experiments could be reliably attributed to 5-HT release, because (1) no metabolite was detected in the 5-HT potential range by our CFEs; (2) the main interfering neurotransmitter, DA, was shown not to contribute to the 5-HT signals; and (3) the 5-HT precursor 5-HTP increased the electrochemical signal. We estimated the maximal concentration of 5-HT release induced by a 40 Hz tail nerve shock to be ∼100 nm.
The action of a neurotransmitter is usually defined as “synaptic” or “extrasynaptic” depending on the distance that the molecule diffuses to activate specific receptors. Typically, the concentration of a neurotransmitter inside the synaptic cleft is believed to reach the millimolar range, close to its intravesicular concentration in the presynaptic element (Bruns and Jahn, 1995; Clements, 1996). In some cases, a neurotransmitter released into the synaptic cleft can also diffuse a few micrometers away to reach extrasynaptic receptors. In these cases, the transmitter concentration decreases to the micromolar or the nanomolar range because of both rapid dilution in the extracellular space and active reuptake. Such extrasynaptic or paracrine actions have been demonstrated for DA and 5-HT in the mammalian brain (for review, see Fuxe and Agnati, 1991; Bunin and Wightman, 1998, 1999). In our study, the dimensions of the carbon fiber used to manufacture our CFEs are too large to allow monitoring neurotransmitters inside the synaptic cleft. Therefore, our chronoamperometric measurements can only detect extrasynaptic diffusion of neurotransmitter. Several lines of evidence suggest that the concentration range that we determined (100 nm) is consistent with the known functional actions of 5-HT on tail SNs and MNs in Aplysia. First, at least four different 5-HT receptors have been cloned and characterized in the Aplysianervous system: (1) Ap5-HTB1 and (2) Ap5-HTB2 both activate phospholipase C with EC50 values of 1.8 and 1.5 nm, respectively (Li et al., 1995); (3) 5-HTap1, is negatively coupled with adenylate cyclase and shows a 0.53 nmKd for 5-HT (Angers et al., 1998); and (4) 5-HTap2, which has been recently cloned, and has a 241 nmKdfor 5-HT (Barbas et al., 2002). The Kdfor these receptors suggests that they would be activated by the estimated concentration of 5-HT release evoked by tail nerve stimulation. Second, the range of 5-HT concentration that we estimate has been used in cell culture experiments to induce a variety of forms of synaptic plasticity (Ghirardi et al., 1995). Finally, exogenous application of 10 or 50 μm 5-HT, which typically produces maximal SN plasticity, results in concentrations ranging from 80 nm to ∼1 μm in the SN→MN synaptic neuropil. This diminution in concentration is likely attributable to active 5-HT reuptake systems within the ganglion. Thus, the electrochemical signal we measure in response to nerve stimulation likely reflect 5-HT concentrations sufficient to produce extrasynaptic effects. Our data therefore suggest that 5-HT in the Aplysia CNS exerts at least some of its effects via extrasynaptic or paracrine transmission, consistent with previous studies by Bunin and Wightman (1998) in the rat. It should be noted, however, that classical synaptic release of 5-HT has been shown in the buccal ganglion of Aplysia, where serotonergic EPSPs can be detected after metacerebral cell activation (Gerschenfeld et al., 1978), and in the pleural ganglion, where serotonergic synapses onto tail SN cell bodies have been identified by electron microscopy (Zhang et al., 1991). Therefore, it appears that 5-HT transmission in Aplysia can be both synaptic and extrasynaptic.
Serotonin release is spatially and temporally controlled
Is 5-HT released in the entire CNS on tail nerve stimulation, or is it restricted to specific regions of the brain? Our data favor the second hypothesis, because 5-HT release was localized in the pleural ganglion and a subregion of the pedal ganglion, at most 500 μm in diameter, on the ipsilateral side of the stimulation. This organization would allow modulation of tail SN cell bodies and synapses on the ipsilateral side of sensitizing input, providing an explanation for lateralized sensitization in Aplysia (Scholz and Byrne, 1987; Cleary et al., 1998; Bristol et al., 2000). Also, the relatively small volume at which 5-HT is released within the pedal ganglion could allow cell-specific or even synapse-specific modulation by this amine and can be thought of as a modulatory field.
Serotonin release was also restricted temporally to a 40 sec period after tail nerve stimulation. A previous study by Bunin and Wightman (1998) in the rat showed that 5-HT released by presynaptic terminals could remain in the extracellular space for ∼5 sec. Assuming correspondence between rat and Aplysia reuptake systems, the temporal window for the presence of 5-HT at specific release sites could last from 35 to 45 sec. Temporal control over 5-HT release could be important for the induction of specific forms of synaptic plasticity underlying memory. For example, 5-HT can interact with activity in tail SNs to produce both enhanced STF (Hawkins et al., 1983; Walters and Byrne, 1983, 1985) and a unique form of intermediate-term facilitation (ITF; Sutton and Carew, 2000). Also, coincidence between activity in siphon SNs and 5-HT release has been proposed as a mechanism for classical conditioning of the siphon withdrawal reflex inAplysia (Hawkins et al., 1983; Walters and Byrne, 1983). Our data would predict that the duration of the temporal window for such interactions should have a lower limit of ∼30 sec, depending in addition on the duration of second messenger activation by either 5-HT or SN activity, which could significantly outlast 5-HT release.
Finally, the location of 5-HT cell bodies responsible for 5-HT release onto tail SNs is still unknown. In our experiments, tail nerve stimulation could cause direct antidromic activation of 5-HT neurons, excitation of tail SNs which could in turn activate 5-HT neurons, possibly through one or more interneurons, or both. One population of 5-HT neurons, the CB1 cells, have been described in the cerebral ganglion and have been shown to induce facilitation of siphon SN→MN synapses in the abdominal ganglion (Mackey et al., 1989). However, the contribution of the CB1 cells to synaptic plasticity at the pleural–pedal SN→MN synapses is still unknown (Mackey et al., 1989; see also Wright et al., 1995). Our results suggest that the 5-HT neurons responsible for the plasticity of tail SNs we observe (1) should be present on each side of the CNS, (2) should project to both the pleural and pedal ganglia, and (3) should display their maximal firing rate for at most 40 sec after tail nerve stimulation.
Serotonin release and SN plasticity induced by tail nerve stimulation are correlated
Tail nerve stimulation of increasing frequencies induced progressively greater plasticity at tail SNs and a corresponding increase in 5-HT release onto SN cell bodies and SN→MN synapses. Serotonin release was clearly correlated with SN plasticity, low release corresponding to small changes in excitability and synaptic transmission and high release corresponding to maximal changes. These results therefore confirm that central release of 5-HT is a major contributor to synaptic plasticity in Aplysia. However, 5-HT release in the CNS is not the only pathway that has been implicated in sensitization in Aplysia. For example, the small cardioactive peptide (SCP) has also been shown to facilitate SN→MN synapses (Abrams et al., 1984), and peripheral 5-HT released by non-neuronal cell types such as hemocytes (Brabham et al., 2000) could also play a role. Indeed, bathing whole intact animals in 5-HT produces behavioral effects, such as long-term sensitization and delay in the latency to feeding (Levenson et al., 1999), and molecular effects, such as activation of the immediate early gene CCAAT-enhancer binding protein in the SNs (Alberini et al., 1994), suggesting that 5-HT present in the hemolymph can have modulatory actions on the CNS. Interactions between these different modulatory systems inAplysia could be important for the encoding of different memory phases and warrant additional experimental attention.
Interestingly, the correlation between 5-HT release and SN plasticity was expressed in a different way for excitability and STF. SN excitability increased progressively with shock frequency, showing a linear relationship with 5-HT release. In contrast, STF and stimulation frequency had a clear nonlinear relationship. When shock frequency was changed from 5 to 10 Hz, STF suddenly became maximal within the limits we explored, suggesting the existence of a discontinuity for STF induction. A frequency histogram analysis of all the recorded synapses showed two well separated populations consisting of facilitated (+150%) and slightly or nonfacilitated (0%) synapses. This gap was not caused by a sudden increase in 5-HT release between 5 and 10 Hz, because 5-HT signals in the pedal ganglion augmented progressively with shock frequency. Rather, there seemed to be a range of 5-HT concentrations, estimated at ∼60 nm, above which STF was strongly expressed through a spike-broadening independent mechanism. Interestingly, 5 Hz stimulation produced modest but significant STF, suggesting that some aspects of facilitation were induced before the noticeable discontinuity in STF induction. Our experiments cannot distinguish whether this reflects a single facilitatory process, which requires a threshold stimulation for complete expression, or whether it reflects two different mechanisms, one inducing modest STF at low frequency and a second showing maximal STF at stimulation frequencies of ≥10 Hz. Possible explanations for the observed discontinuity include (1) recruitment of additional 5-HT fibers at high frequencies, which could release 5-HT at other sites, (2) involvement of other facilitating substances such as SCP (Abrams et al., 1984), which could be released at high- but not low-frequency stimulation, and (3) different molecular mechanisms within tail SNs induced by low or high concentrations of 5-HT. Additional experiments are needed to elucidate the differences between SN excitability and STF in response to progressive increase in the frequency of tail nerve stimulation.
Implications for memory encoding in Aplysia
The 5-HT signals detected in the pleural and pedal ganglia remained stable over several consecutive periods of stimulation. Typically, the encoding of different memory phases for sensitization inAplysia has been shown to be critically dependent on the number and pattern of shocks applied to the animal: a single shock produces only short-term memory, whereas a sequence of three to five shocks, spaced by 15–30 min, produces intermediate-term memory (Sutton et al., 2001, 2002) and long-term memory (Zhang et al., 1994; Sutton et al., 2001, 2002). In our experiments, when five nerve shocks were applied, 5-HT release at the fifth shock was not significantly different from the one at the first shock. Therefore, the serotonergic system appeared as a reliable transducer of external sensitizing stimuli, suggesting that the mechanisms responsible for the transition among short-, intermediate-, and long-term memory are localized at the level of second messenger pathways within the SNs, as has already been suggested by studies on identified synapses in culture (Montarolo et al., 1986; Ghirardi et al., 1995).
Finally, the fact that the modulatory pathway activated by tail nerve stimulation showed remarkable stability despite clear plasticity induced in the test pathway (STF and ITF of SN→MN synapses and increased SN excitability) could be a general feature shared by other systems. Indeed, repetition of training over time has been shown to enhance retention in a wide variety of species and is often necessary for long-term memory formation (McGaugh, 1966; Rosensweig et al., 1993;McGaugh, 2000). Stability in a modulatory or reinforcing pathway could therefore be a critical feature, which ensures continued reliable encoding of specific patterns of training.
Footnotes
This work was supported by National Institutes of Health Grant RO1 MH-14-1083 to T.J.C. S.M. was the recipient of postdoctoral fellowships from Fondation Simone et Cino Del Duca in 1999 and Institut National de la Santé et de la Recherche Médicale in 2000. We thank Sharen McKay for helpful technical advice. We are grateful to A. Bristol, A. Purcell, J. Schaffhausen, C. Sherff, and M. Sutton for comments on a previous version of this manuscript.
Correspondence should be addressed to Thomas J. Carew, Department of Neurobiology and Behavior, Center for the Neurobiology of Learning and Memory, University of California, Irvine, CA 92697-4550. E-mail:tcarew{at}uci.edu.


