

Abstract
The age-associated decrease in the efficiency of CNS remyelination has clear implications for recovery from demyelinating diseases such as multiple sclerosis (MS) that may last for several decades. Developing strategies to reverse the age-associated decline requires the identification of how the regenerative process is impaired. We addressed whether remyelination becomes slower because of an impairment of recruitment of oligodendrocyte progenitors (OPs) or, as is the case in some MS lesions, an impairment of OP differentiation into remyelinating oligodendrocytes. The OP response during remyelination of focal, toxin-induced CNS demyelination in young and old rats was compared by in situ hybridization using probes to two OP-expressed mRNA species: platelet-derived growth factor-α receptor and the OP transcription factor myelin transcription factor 1 (MyT1). We found that the expression patterns for the two OP markers are very similar and reveal a delay in the colonization of the demyelinated focus with OPs in the old animals compared with the young animals. By comparing the mRNA expression pattern of MyT1 with that of the myelin proteins myelin basic protein and Gtx, we found that in the old animals there is also a delay in OP differentiation that increases with longer survival times. These results indicate that the age-associated decrease in remyelination efficiency occurs because of an impairment of OP recruitment and the subsequent differentiation of the OPs into remyelinating oligodendrocytes, and that strategies aimed at ameliorating the age-associated decline in remyelination efficiency will therefore need to promote both components of the regenerative process.
- aging
- demyelination
- remyelination
- in situ hybridization
- oligodendrocyte progenitor
- myelin transcription factor 1
- platelet-derived growth factor receptor α
Remyelination is a spontaneously occurring repair process in which new myelin sheaths are restored to demyelinated CNS axons (Franklin, 1999). Like many repair processes in the body, it becomes less efficient with age (Gilson and Blakemore, 1993; Ashcroft et al., 1995; Shields et al., 1999; Musaro et al., 2001). This decrease in efficiency manifests itself as a decrease in the rate of remyelination (Shields et al., 1999; Sim et al., 2000) and is associated with changes in the inflammatory response and in the expression of putative signaling molecules (Hinks and Franklin, 2000). In addition to the evident implications of this phenomenon for decreased likelihood of recovery from demyelinating diseases such as multiple sclerosis with aging, the decrease in remyelination efficiency also provides an opportunity to study the mechanisms of the process itself. Thus, by comparing remyelination in young adults with remyelination in older adults, one can identify those factors that must be present or absent for the process to proceed efficiently and that may form the basis for the development of therapies for promoting endogenous remyelination.
Increasing evidence supports a cellular model of CNS remyelination that involves (1) the recruitment of oligodendrocyte progenitors (OPs) into areas of remyelination, a process that is likely to involve both their migration and proliferation, and (2) their subsequent differentiation into remyelinating oligodendrocytes (Godfraind et al., 1989; Reynolds and Wilkin, 1993; Carroll and Jennings, 1994; Franklin et al., 1997;Gensert and Goldman, 1997; Carroll et al., 1998; Redwine and Armstrong, 1998; Cenci di Bello et al., 1999; Levine and Reynolds, 1999). A delay in the rate of remyelination could result from a decrease in the recruitment of OPs, a decrease in the rate at which the recruited OPs differentiate into remyelinating oligodendrocytes, or a combination of the two. Determining which of these factors are contributing to the delay in remyelination in old animals is important if one is to devise means of reversing the age-related decline in remyelination efficiency. For example, are recruitment factors or differentiation factors necessary to accelerate the rate of remyelination? To resolve this issue, we compared the recruitment of OPs after toxin-induced demyelination in the caudal cerebellar peduncle in young and old adult female rats and compared these recruitment rates with the appearance of remyelinating oligodendrocytes. We monitored the OP response using two OP markers: platelet-derived growth factor-α receptor (PDGF-αR) mRNA (Pringle et al., 1992; Nishiyama et al., 1996; Redwine and Armstrong, 1998) and mRNA for the OP-expressed transcription factor myelin transcription factor 1 (MyT1) (Kim and Hudson, 1992;Armstrong et al., 1995; Wrathall et al., 1998). Our data indicate that there is a delay in OP recruitment during slow remyelination in old animals compared with rapid remyelination in young animals. Moreover, in old animals, OPs recruited early in the repair process differentiate rapidly into remyelinating oligodendrocytes, whereas at later stages there is a delay in their differentiation. These data therefore indicate that ameliorating the age-associated decline in remyelination efficiency may require manipulations that enhance both OP recruitment and OP differentiation.
MATERIALS AND METHODS
Focal demyelination of the caudal cerebellar peduncle in the adult rat. Female Sprague Dawley rats (young adults, 8–10 weeks of age, ∼200 gm; old adults, ex-breeders, >12 months of age, >280 gm) were used in all experiments. Experiments were performed in compliance with Home Office regulations and institutional guidelines. Anesthesia was induced using a neuroleptanalgesic combination [0.7 ml/kg Hypnorm (0.315 mg/ml fentanyl citrate and 10 mg/ml fluanisone; Janssen Pharmaceuticals, Berse, Belgium) and diazepam (3 mg/kg; Phoenix Pharmaceuticals, Gloucester, UK)]. Demyelination was induced unilaterally or bilaterally by stereotaxic injection of 4 μl of 0.01% ethidium bromide (EB) into the caudal cerebellar peduncles as described in detail previously (Woodruff and Franklin, 1999). Controls were injected with an equal volume of sterile saline into the contralateral peduncle of animals that received a unilateral lesion.
PDGF-αR and Olig-1 in situ hybridization. The PDGF-αR probe was transcribed from a 1637 bp EcoRI cDNA fragment encoding most of the extracellular domain of mouse PDGF-αR cloned into pBluescript KS+ (a gift from Dr. N. P. Pringle and Prof. W. D. Richardson, University College London, London, UK). The Olig-1 probe was transcribed from a 962 bpSmaI–BamHI fragment of the Olig-1 3′-untranslated region cloned into pBluescript KSII (a gift from Dr. R. H. Woodruff and Prof. W. D. Richardson, University College London, with permission of Dr. D. H. Rowitch, Dana-Farber Cancer Institute, Boston, MA). Groups of four animals were used for the comparison of unlesioned numbers of PDGF-αR and Olig-1 cells in the caudal cerebellar peduncle. For the lesion study, groups of three to six animals were perfused with 4% paraformaldehyde in PBS at 2, 5, 7, 10, 21, and 28 d after lesion induction in young and old adult animals. Tissue was prepared for in situ hybridization performed as described by Fruttiger et al. (1999), except that both the RNA polymerases and the RNA transcription reactions were run as recommended by Boehringer Mannheim Biochemica (Mannheim, Germany). After in situ hybridization, RNA hybrids were visualizedin situ by a standard technique as described previously (Fruttiger et al., 1999). The density of the PDGF-αR- and Olig-1-positive cells within the lesion was assessed by image analysis (MCID model M4; Imaging Research Inc., Toronto, Canada). EB-injected, saline-injected, or normal regions of the caudal cerebellar peduncle, identified by solochrome cyanine staining, were captured under the 4× objective using a red filter to accentuate the blue-stained PDGF-αR nuclei. The automatic target detection feature of the MCID system was used to select positive nuclei, and the threshold level was set according to the lesion background level such that all positive nuclei were selected. The valid criteria for counting a single cell were set as an area of >20 μm2. The average size of PDGF-αR-positive (+) cells was found to be ∼60 μm2. Therefore, to allow estimation of PDGF-αR+ cells that appeared in “clumps,” a target with an area of >80 μm2 was counted as two or more cells. However, to exclude areas of above-threshold nonspecific staining such as section tears and folds, targets with an area of >200 μm2 were excluded. The MCID image analysis system then calculated the cell density of positive cells.
MyT1 oligonucleotide probe synthesis and labeling. The MyT1 probe 5′-TTT GGG GCA AGC ATA CGT TTG CCA AAA ACC TGA GCA TCA AAA CTT was designed to bind nucleotides 2151–2195 of mouse MyT1 mRNA following the numbering of Kim et al. (1997). MyT1 oligonucleotide probes were dissolved in sterile water to give a stock solution of 20 ng/μl and labeled as described previously (Hinks and Franklin, 1999). Briefly, oligonucleotide probes were end-labeled with either35S-dATP (1250 Ci/mmol; New England Nuclear, Boston, MA) or [32P]dATP (6000 Ci/mmol; New England Nuclear) using terminal deoxynucleotidyl transferase and purified using Sephadex columns (Microbiospin 6; Bio-Rad, Hemel Hempstead, UK) to remove free nucleotides. The radioactivity of the labeled probe was measured using a scintillation counter (1450 Microbeta; Wallac, Turku, Finland).
MyT1 northern blot analysis. Northern blot hybridization was performed according to a standard protocol to confirm the size and distribution of transcripts to which the MyT1oligonucleotide probe bound (Hinks and Franklin, 1999). Briefly, total RNA (20 μg) extracted from adult and neonatal rat tissues was separated by 1% agarose–formaldehyde gel electrophoresis. The separated RNA was transferred to a nitrocellulose membrane, prehybridized, and then incubated at 42°C with hybridization buffer containing [32P]dATP end-labeled oligonucleotide probe at a final concentration of 3000 cpm/μl. After hybridization, standard stringency washes were applied to remove unbound probe, and washed membrane was apposed to autoradiographic film (BioMax MS-1; Eastman Kodak Company, Rochester, NY) at −70°C overnight. The transcript size was calculated by reference to standard RNA markers.
MyT1 in situ hybridization. Groups of four to eight animals were killed at 2, 5, 7, 10, 14, 21, 28, and 66 d after lesion induction. For MyT1 mRNA in situ hybridization, tissue was prepared and in situ hybridization was performed as described previously (Hinks and Franklin, 1999). Lesion-containing sections of hindbrain were hybridized overnight in hybridization buffer containing 3000 cpm/μl of [35S]dATP-labeled oligonucleotide probe. The following day, excess unbound and nonspecifically bound probe was removed using standard stringency washes before exposure of sections to autoradiographic film (BioMax MR; Eastman Kodak Company). The in situ hybridization autoradiograms were analyzed using the MCID image analysis system as described previously (Sim et al., 2000). In addition, selected slides were coated with emulsion (LM1; Amersham Biosciences, Arlington Heights, IL) and were developed and counterstained with hematoxylin and eosin for microscopic examination after 8 weeks in a light-proof box. The total number ofMyT1-positive cells was assessed by counting nuclei with ≥20 silver grains. MyT1-positive nuclei were sampled across the entire lesion area, which was identified as a hypercellular region compared with the surrounding normal white matter that at the earlier time points was found to be less eosinophilic than normal white matter. The mean numbers of MyT1-positive cells were calculated for each animal.
RESULTS
EB injection creates a focal area of primary demyelination in which PDGF-αR, MyT1, and Olig-1 mRNA-expressing cells are undetectable
To compare the OP response with an acute episode of primary demyelination in the young and old adult rat CNS, we used a model that involves stereotaxic injection of EB into the caudal cerebellar peduncle, a sizable tract of large-diameter myelinated proprioceptive fibers en route from the spinal cord to the cerebellar cortex (Fig.1). We have demonstrated previously that this procedure results in rapid demyelination (Woodruff and Franklin, 1999) associated with the loss of myelin basic protein (MBP), proteolipid protein (PLP), and Gtx mRNA-expressing oligodendrocytes (Sim et al., 2000). The area of demyelination is similar in young and old adult rats, and in both age groups, the lesion eventually undergoes full remyelination, although at a slower rate in the older age group (Shields et al., 1999; Sim et al., 2000). When, fully remyelinated, the lesion has the same size in both young and old animals. This indicates that the extent of demyelination and the small degree of axonal loss are equivalent in the two age groups (Woodruff and Franklin, 1999; Sim et al., 2000). There is also a loss of astrocytes within the defined area of demyelination (Woodruff and Franklin, 1999), and, on the basis of the probable mode of action of EB as a DNA intercalating agent, implying a lack of cell specificity (Neidle and Abraham, 1984), we postulated that there would also be an acute loss of OPs within this area. To test this possibility, we examined expression of PDGF-αR and MyT1 mRNAs, both of which are specifically expressed by OPs in white matter (Pringle et al., 1992;Armstrong et al., 1995) at 48 hr after EB injection. At this time, we could detect no PDGF-αR mRNA+ cells within a defined area that corresponded to the area of demyelination detectable by solochrome cyanine staining on adjacent sections in either young or old adult rats (Fig. 2). This area also corresponded to a region from which MyT1 mRNA expression was absent on autoradiography after in situ hybridization with35S-labeled oligonucleotide probes (see Fig. 6A). To provide additional evidence that OPs were depleted from the area of demyelination, we also looked for expression of Olig-1 mRNA, an oligodendrocyte lineage transcription factor expressed immediately before PDGF-αR mRNA during development, but unlike PDGF-αR, also expressed at subsequent stages of the lineage (Lu et al., 2000; Zhou et al., 2000). Olig-1 mRNA-expressing cells were also not detectable within the area of demyelination, although they were abundant in the surrounding intact white matter (Fig. 2). These data indicate that OPs as well as oligodendrocytes and astrocytes are dramatically depleted by EB injection.

Toxin-induced CNS demyelinating lesion model. The Nissl-stained coronal section illustrates lesion location in the brainstem. Focal areas of demyelination were induced by stereotaxic injection of EB into the caudal cerebellar peduncle of adult rats (right, arrow). Modified from Swanson (1998).

A, The caudal cerebellar peduncle (ccp; indicated by the dashed line) was identified histologically by solochrome cyanine staining (left). Both PDGF-αR+ OPs (middle) and Olig-1+ oligodendrocyte lineage cells (right) are found within the caudal cerebellar peduncle. sp5, Spinal tract of the trigeminal.B, After injection of EB, lesion location was identified by solochrome cyanine staining (left). At 2 DPL, very few OPs were identified within the lesion by in situhybridization for PDGF-αR mRNA (middle). In addition, all Olig-1-expressing oligodendrocyte lineage cells were depleted from the lesion area (right). SC, Solochrome cyanine. Scale bar, 500 μm.
The caudal cerebellar peduncle contains similar numbers of PDGF-αR mRNA+ OPs in young and old adult rats
Given the depletion of cells expressing PDGF-αR, MyT1, or Olig-1 mRNAs within the demyelinated area, the most likely source of the majority of new oligodendrocytes required for remyelination is the OPs that survive within the surrounding intact white matter. One possibility for the decrease in remyelination efficiency with age is that there is a corresponding decrease in the number of OPs available to contribute to remyelination. To address this, we identified the intact caudal cerebellar peduncle in unlesioned animals on solochrome cyanine-stained sections and then counted the number of PDGF-αR mRNA+ cells present within the tract in adjacent sections subjected toin situ hybridization. We found that although there was a decrease in the density of PDGF-αR mRNA+ cells in old animals (Fig.3B, control levels) associated with a slight increase in the cross-sectional area of the tract, there was no significant difference in the total number of cells within the caudal cerebellar peduncle in young and old adult rats (Figs. 2, 3). This observation was supported by the similar relative optical densities within the unlesioned caudal cerebellar peduncle in autoradiographs after in situ hybridization with35S-labeled MyT1-specific oligonucleotide probes in the two age groups. It is therefore unlikely that the differences in the availability of OPs contribute to the age-related differences in remyelination rate.

A, Absolute numbers of PDGF-αR+ OPs in the intact caudal cerebellar peduncles of young and old adult rats, expressed as mean ± SEM. B, Quantification of PDGF-αR+ cell density expression during remyelination of EB-induced demyelination of the caudal cerebellar peduncle. Changes in mean density (± SEM) within the lesion between 2 and 28 DPL in young and old animals are shown. The horizontal lines indicate the mean OP density in young (solid line) and old (dotted line) animals. *p < 0.05; significant difference between young and old animals.
The appearance of PDGF-αR mRNA+ cells within areas of demyelination indicates an age-related decline in the rate of OP recruitment
We subsequently established whether differences existed in the rate at which OPs accumulated within the demyelinated area in the two age groups. This was initially addressed by measuring changes in the density of PDGF-αR mRNA+ cells at 2, 5, 7, 10, 21, and 28 d after lesion induction [days postlesion (DPL)] (Fig. 3B). Although virtually devoid of PDGF-αR+ cells at 2 DPL, abundant positive cells were present at 5 DPL in young animals and 7 DPL in old animals. At 5, 7, and 10 DPL, the density of PDGF-αR+ cells in young animals remained >200 cells/mm2 and at all of these time points was significantly greater than the density in old animals (p < 0.05). Although the density of PDGF-αR+ cells in young animals remained greater than control levels at 28 DPL, the densities had declined from peak levels. The old animal showed a slow progressive increase in PDGF-αR+ cell densities, reaching densities similar to those in young animals by 21 DPL and exceeding them at 28 DPL, when the density in young animals was in decline.
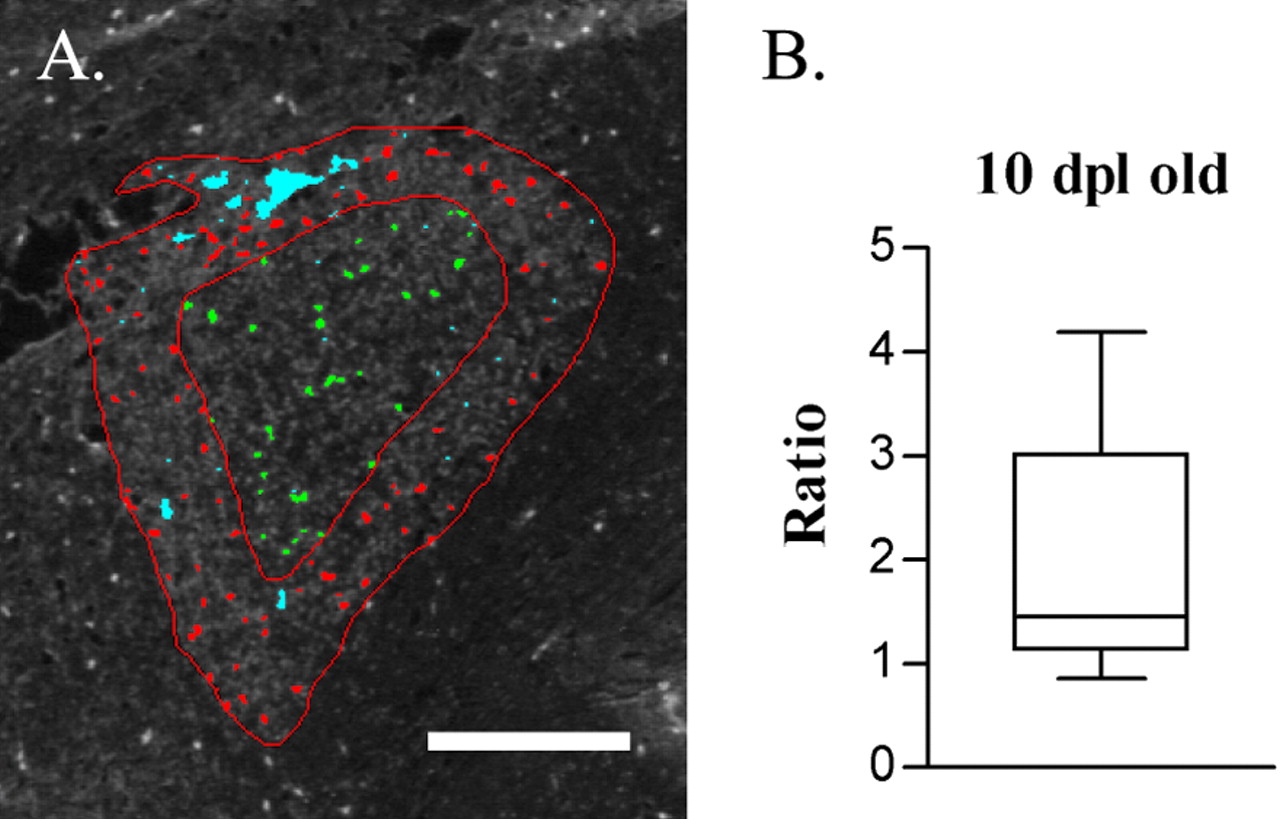
In old animals at 10 DPL, unlike the uniform distribution of PDGF-αR+ cells in young animals, a significantly greater density of PDGF-αR+ cells was found around the lesion edge than in the lesion core (Fig.4). Thus, as a result of the slower repopulation of the lesion by OPs in the old animals, it was possible to observe an OP distribution that suggested that the lesion was repopulated by OPs from the edge of the lesion inward.

In old animals 10 d after injection, the spatial distribution of PDGF-αR+ cells within the demyelinating lesion was examined by image analysis (A).Red- and green-labeled cells were counted as cells present in the periphery and core of the lesion, respectively.Cyan-colored areas of nonspecific staining were excluded from analysis. The density of these cells and the ratio of peripheral to core densities were calculated. Scale bar, 500 μm.B, The box plot shows that the ratio is significantly >1, indicating that more cells are present in the outer portion of the lesion at 10 d.
Changes in MyT1 mRNA expression pattern reflect changes in PDGF-αR mRNA expression during remyelination
To verify the age-related differences in OP recruitment, we compared the PDGF-αR mRNA response with that of another OP marker, the zinc finger transcription factor MyT1 (Kim and Hudson, 1992). This involved the design of a new oligonucleotide probe specific for MyT1 mRNA. A total of 15 45-mer oligonucleotide probes were designed and synthesized, and their binding specificity was tested by Northern blot analysis on CNS tissues. The MyT1–5 probe was found to bind a single mRNA species of ∼5 kb (Fig. 5) and was therefore similar to the MyT1 transcript size previously determined by Northern blot analysis (Kim and Hudson, 1992). In addition, the absence of either a 7.5 kb or a 2.0 kb band indicated that the MyT1–5 probe did not bind the closely related MyT1-like mRNA (Kim et al., 1997).

MyT1 Northern blot analysis. The MyT1–5 probe binds to a single transcript of ∼5 kb found in both developing CNS and various adult tissues.
The pattern of MyT1 mRNA expression during remyelination was analyzed by measuring the optical density of the autoradiogram within the lesion area relative to background level of expression. This relative optical density (ROD) indicated the mean optical density across the entire lesion area. When plotted against survival time, the MyT1 mRNA RODs exhibited a biphasic pattern, with a sharp drop in density of expression occurring between days 5 and 10 (Fig.6). Although the first peak of MyT1 mRNA expression coincided in young and old animals, the level of expression in young animals was >40% higher than in old animals (Fig.6B). In addition, there were age-related differences in the second phase of MyT1 mRNA expression. MyT1 mRNA expression increased more slowly and peaked ∼2 weeks later in old animals. The level of expression then declined to that of control in young animals but remained significantly elevated in old animals at 66 DPL, at which time remyelination is complete (Shields et al., 1999). This last observation may be accounted for by the prolonged expression of OP survival factors, such as insulin-like growth factor (IGF)-I, after toxin-induced demyelination in old animals compared with young, allowing the tissue to support a greater number of OPs (Hinks and Franklin, 2000). Small ROD changes in young and old animals after saline injection were not statistically significant (Fig.6B, control groups).

A, Expression patterns of MyT1 mRNA during remyelination of EB-induced demyelination of the caudal cerebellar peduncle in both young and old adult animals. Sections through the center of the lesion were hybridized with35S-labeled MyT1-specific oligonucleotide probes using a standard in situ hybridization protocol. Representative autoradiograms demonstrate the resulting hybridization signal at 2, 5, 7, 10, 14, 21, 28, and 66 d after injection. Arrowsindicate the first time point at which the initial and second phases of MyT1 re-expression were detected. Emulsion autoradiography of the cerebellar cortex revealed that the signal in this region was diffuse and not associated with individual cells, suggesting that it is caused by nonspecific binding. Scale bar, 500 μm. B, Changes in mean ROD measurements (± SEM) for MyT1 mRNA expression within EB-induced lesions between 2 and 66 d after lesion induction in young and old adult animals.
We subsequently showed that the increased MyT1 ROD values reflected a change in the density of cells expressing MyT1 mRNA. A comparison of the total number of MyT1+ nuclei within the lesion with the equivalent total ROD measurement (ROD × lesion area) revealed a close correlation (p < 0.0001) and indicated that after linear regression analysis, all points fit within the 95% prediction interval (Fig. 7). The large number of apparently overlapping grains and difficulties in the identification of cellular boundaries in areas of densely packed MyT1+ cells made it difficult to investigate the amount of MyT1 mRNA expressed per cell. However, because the relationship between MyT1+ cell density and ROD was so strong, it is unlikely that large changes in level of expression per cell occurred.

A, The number of MyT1 mRNA-expressing cells during remyelination was assessed by emulsion autoradiography. MyT1-positive nuclei were defined as nuclei containing >20 silver grains clustered over a single nucleus. The field illustrated is taken from an EB-induced lesion and contains five MyT1-positive nuclei (arrows). Scale bar, 5 μm.B, The changes in MyT1 ROD observed were compared with changes in the absolute number of MyT1-positive nuclei by correlating the total number of cells with the ROD × lesion area for each animal. These data are significantly correlated with one another. In addition, after linear regression (solid line), all data points fall within the 95% prediction intervals (dashed line). The data indicate that the ROD measurements (Fig.6B) reflect changes in the density of MyT1 mRNA-expressing cells.
The MyT1 expression pattern was then compared with the PDGF-αR+ cell density (Fig. 8). Although at early time points the two patterns were different, in both young and old animals the patterns of expression of the two markers after 10 DPL were strikingly similar within an age group. This observation indicates that changes in MyT1 ROD, at least from day 10 onward, not only reflect changes in MyT1+ cell density but also changes in the density of PDGF-αR+ OPs.

Comparison of mRNA expression patterns of the OP markers PDGF-αR and MyT1 during remyelination of the caudal cerebellar peduncle in young and old animals. Mean relative expression values, relative to peak levels, were calculated for the two markers to compare the two expression patterns. The shape of the mRNA profiles after 10 DPL of MyT1 and PDGF-αR was similar in both young (A) and old (B) groups.
The latency between equivalent expression of an OP marker, MyT1, and markers of myelinating oligodendrocytes MBP and Gtx increases in old adult animals but remains relatively low and constant in young animals
To examine the rate of differentiation of OPs into remyelinating oligodendrocytes, the mRNA expression profile of the OP marker MyT1 was compared with that of two markers of mature oligodendrocytes, MBP and Gtx. We have shown previously that MBP and Gtx mRNAs have similar patterns of expression during remyelination of EB-induced lesions in the caudal cerebellar peduncle regardless of the rate at which remyelination is occurring (Sim et al., 2000). Their expression profiles correspond to the appearance of myelin sheaths within the toxin-induced lesions, peaking when remyelination is complete and declining thereafter (Shields et al., 1999; Sim et al., 2000). The pattern of MyT1 mRNA expression during remyelination was clearly different from that of MBP or Gtx in both age groups. Increased MyT1 mRNA levels were found before detectable MBP and Gtx re-expression, and peak expression during the second phase of MyT1 expression preceded MBP and Gtx peak expression in both young and old animals (Fig.9A,B).

The rate of oligodendrocyte differentiation was examined by comparison of the mRNA expression patterns of MyT1 for OPs and MBP and Gtx for mature oligodendrocytes during remyelination of the caudal cerebellar peduncle in young (top) and old (middle) animals. These patterns were compared by calculating a percentage of the individual ROD values to the highest ROD observed for each probe. MyT1 expression preceded MBP and PLP in each age group. Bottom, The relative delay between equivalent MBP or Gtx expression and MyT1 expression was calculated from the relative expression charts (top,middle). Unlike young animals, the delay between Gtx and MyT1 in old animals progressively increased as the lesion matured before complete remyelination.
The rate at which recruited OPs differentiate into remyelinating oligodendrocytes is likely to be an important determinant of the rate of remyelination. To establish whether differences existed between young and old lesions in the length of time taken by recruited OPs to undergo differentiation, we estimated the interval between equivalent ROD expression levels of markers for OPs and mature oligodendrocytes. The interval between equivalent levels of MyT1 and MBP or Gtx mRNA expression, when expressed as a percentage of their maximal levels, was approximately constant in young animals during mRNA accumulation (Fig.9A,C). In contrast, this interval progressively increases during remyelination in old animals from 3 d to >5 weeks (Fig.9B,C). Thus, the rates of accumulation of the OP marker MyT1 and the myelinating oligodendrocyte markers MBP and Gtx proceed in parallel in the young animals but, although initially closer in the old animals than the young, diverge in the older animals. This difference between the two age groups suggests that the decreased rate of differentiation of OPs into remyelinating oligodendrocytes in old animals is an important component of the age-related decline in remyelination efficiency.
DISCUSSION
A prerequisite for enhancing the efficiency of remyelination in the aging CNS is recognizing those aspects of the process that are primarily responsible, which then determine the corrective strategy adopted. In this study, we examined whether the age-related decrease in the rate of remyelination after toxin-induced demyelination is a result of an impairment of recruitment of OPs or their differentiation into remyelinating oligodendrocytes.
The OP response to demyelination was followed using two OP markers: PDGF-αR mRNA (Pringle et al., 1992) and the transcription factor MyT1, which in postnatal white matter is expressed at highest levels in OPs (Armstrong et al., 1995; Nishiyama et al., 1996). At early time points, the patterns of expression of MyT1 and PDGF-αR were different, suggesting that immediately after demyelination, the cellular origins of these two markers are not identical. However, the similar expression patterns of the two markers after 10 DPL and the fact that increased expression occurred solely in white matter support the contention that the MyT1 mRNA expression profiles reflected changes in OPs.
OPs are recruited into the lesions at a slower rate in the older animals. Because neither of the OP markers was detectable within the lesion at 2 DPL, it would appear that EB kills OPs as well as oligodendrocytes and astrocytes (Woodruff and Franklin, 1999). The issue arises as to whether other progenitor types that expressed neither PDGF-αR nor MyT1 mRNAs but are nevertheless capable of giving rise to remyelinating oligodendrocytes might survive EB injection. This is especially germane given the heterogeneity of dividing progenitor phenotypes in the adult CNS (Gensert and Goldman, 2001) and the contribution these cells make to the remyelinating oligodendrocyte population (Gensert and Goldman, 1997; Keirstead and Blakemore, 1997). We therefore examined the expression of another marker, the basic helix–loop–helix transcription factor Olig-1, whose expression in white matter is confined to the oligodendrocyte lineage (Lu et al., 2000; Zhou et al., 2000). Olig-1 is expressed with a pattern that during development precedes and overlaps that of PDGF-αR, and it is therefore likely to detect a spectrum of progenitor phenotypes contributing to the genesis of remyelinating oligodendrocytes (Lu et al., 2000). The absence of Olig-1 mRNA-expressing cells after EB injection provided additional support for a focal depletion of progenitor cells capable of contributing to remyelination. The mechanism by which EB causes cell death is likely to relate to its nucleic acid intercalating properties, disrupting protein synthesis because of its effects on RNA and inhibiting mitochondrial RNA; therefore, it is unlikely to be cell specific (Neidle and Abraham, 1984). Thus, although we cannot exclude the possibility that very small numbers of OPs or indeed other progenitors that we were unable to detect survived within the demyelinated area, the most likely source of these cells is from outside the lesion. OP recruitment into the lesions probably involves a combination of short-distance migration of proliferating OPs from intact tissue into the lesion (Franklin et al., 1997) and their proliferation within the lesion (Keirstead et al., 1998; Levine and Reynolds, 1999). In old animals at 10 DPL, the density of OPs was greater around the rim of the lesion than at its center, a distribution consistent with the view that the lesion is repopulated with OPs from outside in. This study and others indicate that the process of OP recruitment is initiated shortly after lesion (Carroll and Jennings, 1994; Keirstead et al., 1998; Levine and Reynolds, 1999;Nait-Oumesmar et al., 1999). We find no difference in the number of PDGF-αR+ cells or in the constitutive levels of MyT1 expression in the normal cerebellar peduncles of young and old rats, suggesting that the impairment of recruitment is not attributable to a deficiency in OP availability but rather to an impairment of the factors involved in their recruitment or a change in their intrinsic ability to respond to these factors.
Currently, little is known about the factors that signal OP recruitment after demyelination, although increased expression of factors known to stimulate OP proliferation and motility have been described during remyelination. For example, PDGF and fibroblast growth factor-2, both of which promote proliferation and motility of adult OPs (Wolswijk et al., 1991; Wolswijk and Noble, 1992), have increased levels of expression triggered by demyelination and are associated with the early stages of remyelination (Redwine and Armstrong, 1998; Hinks and Franklin, 1999). A delay in the onset of increased PDGF-A mRNA expression occurs after induction of lysolecithin-induced demyelination in the spinal cord of old adult rats compared with young adult rats (Hinks and Franklin, 2000). However, after the initial delay in the onset of expression, similar levels are achieved in the two age groups. If the PDGF response governed the behavior of OPs, then one would predict that the start of recruitment would be delayed in old animals but thereafter would proceed at a rate similar to that in young animals. Instead, we found that the start of recruitment is similar but the rate is different, suggesting that differences in the expression of PDGF are not primarily responsible for the difference in recruitment rate in the present study.
Having established that OP recruitment is delayed in slow remyelination in old animals, we then addressed whether the differentiation phase of remyelination was also altered by measuring the latency between equivalent OP MyT1 mRNA expression and the expression of MBP and Gtx mRNAs (Sim et al., 2000). In young animals, the latency remained constant at 10 DPL, interpreted as a steady differentiation of recruited cells into remyelinating oligodendrocytes until remyelination is complete. In contrast, in old animals, the latency increased as the lesion aged and reached considerably higher levels than were found in the young animals at 21 and 28 DPL. Because the onset of MBP and Gtx mRNA expression occurred later in old animals, the first survival time at which the analysis could be undertaken was 3 d later than in young animals. At 3 DPL, the latency was shorter, suggesting that remyelination was occurring more efficiently in the older age group. However, this may simply have been a reflection of the delay in the remyelination process and the fact that a similarly short interval occurred in the young animals between 5 and 7 d. This difference between the two age groups thus suggested that remyelination occurs most efficiently when closely linked to the process of demyelination. A likely explanation for the temporal association between demyelination and remyelination is that the inflammatory response associated with demyelination provides a powerful impetus for remyelination (Triarhou and Herndon, 1985; Hiremath et al., 1998; Cenci di Bello et al, 1999;Morell et al., 2000; Kotter et al., 2001; Mason et al., 2001). If the remyelination process is still in progress as the demyelination-associated inflammatory response subsides, then the process loses momentum. In a lesion environment such as that induced by EB, in which OPs repopulate the lesion from the outside inward, the larger the lesion the longer it will take to become fully repopulated. The situation we describe in the aged rat, in which differentiation of recruited OPs becomes increasingly delayed, will be exacerbated in large MS lesions, potentially leading to a cessation of OP differentiation. Evidence that such a situation may arise comes from the observation that some demyelinated MS lesions are replete with OPs (Wolswijk, 1998; Chang et al., 2000). One possibility for differentiation delay is the presence of inhibitory factors, and in this regard, the axon with which a remyelinating OP must engage would be a possible source of such factors. For example, differences between young and old animals in axonal expression of notch ligands such as jagged may inhibit OP differentiation via activation of notch receptors (Wang et al., 1998). Alternatively, differentiation-inducing signals may be absent. Again, the demyelinated axons may play a role, with those of the aged CNS being less receptive to remyelination than those in younger animals. In the context of age-related changes in the remyelinating environment, there is a delay in the peak expression of IGF-I and transforming growth factor-β1 in old animals. Based on their effects on oligodendrocyte lineage cells in vitro, these two growth factors have been proposed as putative inducers of OP differentiation during remyelination (Hinks and Franklin, 2000). If IGF-I and transforming growth factor-β1 were inducing OP differentiation, then the delay in their peak expression in old animals after toxin-induced demyelination would be consistent with our present observation on delayed differentiation in animals of similar ages.
An important implication of our results is that if efficient remyelination is to be maintained throughout a protracted demyelinating disease such as MS, then strategies will have to be devised that promote both OP recruitment and OP differentiation. Single factors can induce both proliferation and differentiation, depending on the length of exposure (Rosenthal and Cheng, 1995). Few such factors are known for the oligodendrocyte lineage, although a case can be made for IGF-I having effects on both OP proliferation and differentiation (Ye et al., 1995; Jiang et al., 2001). Nevertheless, it seems likely that therapeutic strategies aimed at reversing age-related deficiencies in remyelination will need to contain multiple components and be delivered with a specific sequence and timing.
Footnotes
This work was supported by the Medical Research Council of Great Britain and Northern Ireland, The Wellcome Trust, and Research into Ageing. We thank Dr. Rachel Woodruff for her help with this study.
Correspondence should be addressed to Dr. R. J. M. Franklin, Department of Clinical Veterinary Medicine, University of Cambridge, Madingley Road, Cambridge CB3 0ES, UK. E-mail: rjf1000{at}cam.ac.uk.


