

Abstract
Little is known about the capacity of the thalamus for experience-dependent plasticity. Here, we demonstrate adaptive changes in the tuning of auditory thalamic neurons to a major category of sound localization cue, interaural time differences (ITDs), in juvenile barn owls that experience chronic abnormal hearing. Abnormal hearing was caused by a passive acoustic filtering device implanted in one ear that altered the timing and level of sound differently at different frequencies. Experience with this device resulted in adaptive, frequency-dependent shifts in the tuning of thalamic neurons to ITD that mimicked the acoustic effects of the device. Abnormal hearing did not alter ITD tuning in the central nucleus of the inferior colliculus, the primary source of input to the auditory thalamus. Therefore, the thalamus is the earliest stage in the forebrain pathway in which this plasticity is expressed. A visual manipulation, chronic prismatic displacement of the visual field, which causes adaptive changes in ITD tuning at higher levels in the forebrain, had no effect on thalamic ITD tuning. The results demonstrate that, during the juvenile period, auditory experience shapes neuronal response properties in the thalamus in a frequency-specific manner and suggest that this thalamic plasticity is driven by self-organizational forces and not by visual instruction.
- medial geniculate nucleus
- auditory experience
- Hebbian learning
- self-organization
- auditory cortex
- inferior colliculus
Introduction
The representation of information in the avian forebrain and mammalian cerebral cortex is highly plastic (Weinberger, 1995; Buonomano and Merzenich, 1998; Kilgard and Merzenich, 1998; Miller and Knudsen, 1999, 2001; Rauschecker, 1999;Bavelier and Neville, 2002). Although the thalamus is the gateway for information entering the forebrain, we do not understand the circumstances under which the thalamus contributes to forebrain plasticity. This study describes functional plasticity at the level of the avian auditory thalamus that accounts for certain kinds of functional plasticity that have been observed at higher levels in the forebrain.
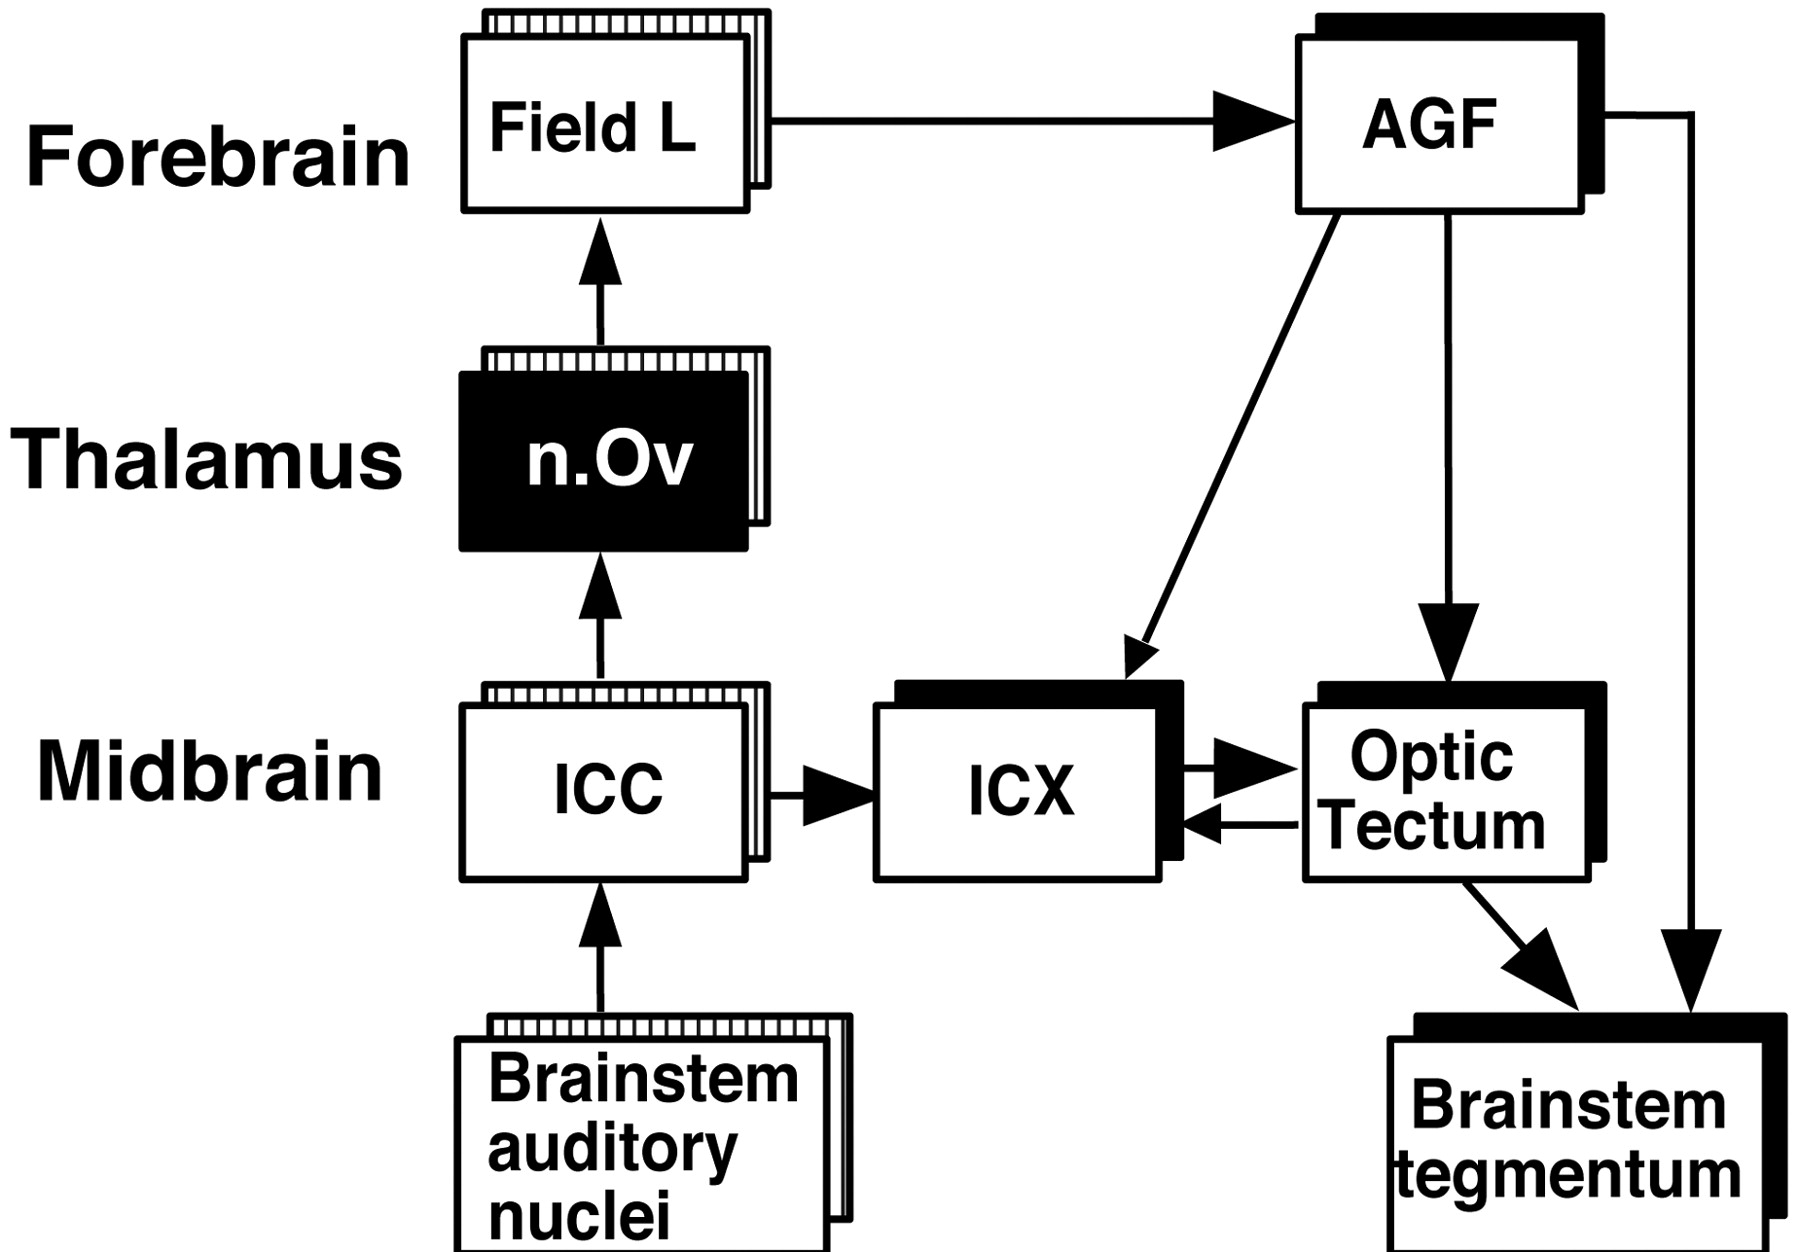
In juvenile barn owls, abnormal auditory or visual experience can cause dramatic adaptive changes in the representation of sound localization cues in the archistriatal gaze fields (AGF) (Miller and Knudsen, 1999,2001). The AGF (see Fig. 1), analogous to the frontal eye fields in mammals (Knudsen et al., 1995), is a forebrain structure that helps to orient the owl's gaze toward the locations of interesting auditory stimuli (Knudsen and Knudsen, 1996a). Sensory manipulations that alter the relationships between sound localization cues, such as interaural time difference (ITD) (the primary cue for the horizontal position of a sound stimulus), and locations in the visual field result in changes in the tuning of AGF neurons to those cues, changes that compensate for the effects of the sensory manipulation (Miller and Knudsen, 1999,2001).
A manipulation of hearing that leads to plasticity in the AGF involves the implantation of a passive acoustic filtering device in one ear (Gold and Knudsen, 1999). The device causes frequency-specific changes in the relationships between values of binaural differences in timing and amplitude and the locations in space that produce them. With the device in place, AGF neurons, which tend to be tuned to ITD across wide ranges of frequency (Cohen and Knudsen, 1995), adjust their tuning over a period of months according to the frequency-dependent patterns of ITD caused by the device (Miller and Knudsen, 2001).
A manipulation of vision involves the exposure of juvenile owls to a chronically displaced visual field (Miller and Knudsen, 1999). Prismatic spectacles that displace the visual field to one side shift the relationships between values of ITD and locations in the (prismatically displaced) visual field. In juvenile owls that experience prismatic spectacles for a period of months, altered vision instructs a change in the tuning of AGF neurons to ITD according to the optical displacement imposed by the prisms.
This report documents the effects of these manipulations of hearing and vision on the tuning of neurons in the auditory thalamus, called the nucleus ovoidalis (nOv), in juvenile barn owls. Previous work on the auditory thalamus in other species has revealed plasticity that is modest compared with the plasticity that occurs at higher levels in the forebrain (Weinberger, 1995). The data reported in this study demonstrate, in contrast, that certain kinds of adaptive plasticity are achieved completely by the level of the auditory thalamus and suggest that this thalamic plasticity is a result of correlation-based rules for self-organization.
Materials and Methods
Animals
Fifteen barn owls (Tyto alba) were raised in nest boxes until they were ∼60 d old, at which age they were moved into communal flight rooms. Five owls had acoustic filtering devices implanted in the right ear canal, five owls had prismatic spectacles mounted in front of the eyes, and five owls were left with normal hearing and vision.

The auditory localization and gaze control pathways in the barn owl (Cohen et al., 1998; Hyde and Knudsen, 2000). For clarity, not all connections are shown. Striped boxes indicate tonotopically organized structures. Interruption of the pathway from the nOv to the AGF eliminates auditory responses in the AGF (Cohen et al., 1998).
All surgeries were conducted while the owls were anesthetized with halothane (1.5%) in oxygen and nitrous oxide (55:45). Skin wounds were infused with xylocaine (2%), and the owl was allowed to recover fully from the anesthetic before being returned to the aviary. The owls were cared for in accordance with the Stanford University Institutional Animal Care and Use Committee and the National Institutes of HealthGuide for the Care and Use of Laboratory Animals.
Manipulations of sensory experience
Auditory experience and visual experience were manipulated as described in previous studies (Gold and Knudsen, 1999; Miller and Knudsen, 1999). Auditory experience was altered by suturing an acoustic filtering device into the right ear. The device was a lightweight plastic chamber (acetal delrin; Plastics Srt, Mountain View, CA) that caused frequency-specific changes in the timing (and level) of sounds reaching the eardrum (Fig.2). The acoustic effects of the filtering device have been described in detail previously (Gold and Knudsen, 1999). The device was always sutured into the right ear canal. Therefore, ITDs for frequencies that were delayed by the device (i.e., 4 kHz) were shifted toward left-ear leading, and ITDs for frequencies that were advanced by the device (i.e., 8 kHz for some animals) were shifted toward right-ear leading. The data in Figure 2 imply that, although the pattern of the frequency-dependent effects of the device was consistent, the amount of ITD shift at a given frequency varied across individuals. The device was resutured periodically to maintain a tight fit. Devices were implanted in owls between 35 and 60 d of age and were worn for at least 60 d before any electrophysiological measurements were made.

Effect of the acoustic filtering device on the timing of sound reaching the right eardrum. The data represent cochlear microphonic measurements from five owls of the difference in the timing of the microphonic before versus after insertion of the passive acoustic filtering device, with the sound source locate at 0° azimuth, 0° elevation (data from Gold and Knudsen, 1999). Thethick dark line indicates the median value; theshaded area indicates the range of values.
Visual experience was altered by raising owls with prismatic spectacles that shifted the visual field 23° to the left (L23° spectacles) or right (R23° spectacles). Spectacle frames with prismatic Fresnel lenses (Vision Care/3M) were attached at ∼60 d of age. Owls wore the spectacles in the aviary for at least 60 d before any electrophysiological measurements were made.
Electrophysiology
Electrophysiological methods were the same as in previous reports (Gold and Knudsen, 2000; Miller and Knudsen, 2001). On the day of an experiment, the owl was anesthetized with halothane, wrapped in a leather harness, suspended in a prone position inside a sound-attenuating chamber (AD2000; Eckel Industries, Cambridge, MA), and secured to a stereotaxic device by a headpiece. The head was positioned using retinal landmarks so that the visual axes were in the horizontal plane and the midsagittal plane aligned with 0° azimuth on a visual projection screen. The owl was maintained throughout the experiment on nitrous oxide and oxygen.
Insulated tungsten microelectrodes (1–3 MΩ at 1.0 kHz) were positioned stereotaxically and advanced through the brain with a microdrive. A level discriminator was used to isolate a small number of units, and the timing of action potentials elicited by auditory stimuli was stored on a computer.
Auditory measurements
Auditory stimuli were generated digitally and delivered dichotically via earphones (Knowles earphones, model 1914, coupled to damping assemblies BF-1743). Broadband and narrowband bursts of noise, 50 msec in duration, were presented at an average binaural level (the sum of the sound levels in dB presented at the two ears divided by two) 20 dB above threshold. Broadband stimuli had a passband of 3–12 kHz and rise–fall times of 0 msec. Narrowband stimuli had a bandwidth of 1 kHz and rise–fall times of 5 msec.
A series of binaural stimuli consisted of noise bursts with different ITD values presented in random order with interaural level difference held constant near an optimal value. For each tuning curve, at least 10 series of stimuli were presented. Net response to a noise burst was quantified by subtracting the baseline discharge rate during the 100 msec before stimulus presentation from the number of spikes occurring during the 100 msec after stimulus onset. The best ITD of a site was the midpoint of the range of ITD values that elicited at least 50% of the maximal response for the site. By convention, negative ITD values correspond to left-ear leading, and positive ITD values correspond to right-ear leading.
ITD tuning curves measured with narrowband stimuli typically had multiple peaks that were separated by integer multiples of the period of the center frequency of the stimulus. Such multipeaked tuning curves result from the periodic nature of interaural phase difference with respect to time (Cohen and Knudsen, 1996). For multipeaked tuning curves, additional analyses were restricted to the response peak closest to 0 μsec unless that peak was less than half the magnitude of another peak. In such cases (3 of the 335 narrowband ITD tuning curves collected), the larger peak was analyzed.
Methods of sampling
Nucleus ovoidalis. Multiunit recordings were made in the nOv (Fig. 1) on the right side of the brain in all animals. The method of sampling was identical for all owls and was designed to obtain a sample that was representative of the nOv. In each owl, electrode penetrations were made at 500 μm intervals in a grid pattern along the rostrocaudal and mediolateral dimensions. In some cases, additional penetrations were made at locations between the penetrations of the initial grid. All penetrations were separated by at least 250 μm. Within a penetration, ITD tuning was measured at 150–250 μm increments.
Inferior colliculus. In two device-reared owls, ITD tuning was sampled in the lateral shell subdivision of the central nucleus of the inferior colliculus (ICC), which provides input to the nOv (Cohen et al., 1998). Stereotaxic and physiological criteria were used to target the lateral shell (Brainard and Knudsen, 1993). We measured tuning for frequency, narrowband ITD, and broadband ITD at 100–200 μm intervals in dorsoventral electrode penetrations.
Optic tectum. Neurons in the optic tectum respond to both auditory and visual stimuli. Experience-dependent shifts in ITD tuning in the optic tectum were assessed by measuring the relationship between best ITDs and the azimuths of visual receptive fields (VRFs), according to the method described previously (Brainard and Knudsen, 1993). VRFs were measured by projecting dark or light bars onto a calibrated screen placed in front of the owl. The magnitude of shift in ITD tuning at an individual site was quantified by comparing the measured best ITD value with the value predicted by the normal relationship between best ITD and VRF azimuth: predicted best ITD = VRF azimuth × 2.5 μsec/° (Brainard and Knudsen, 1993). Tectal samples consisted of 8–30 sites per animal with VRF azimuths within 10° of the midsagittal plane and elevations between 10° up and 15° down.
Results
ITD tuning in the nOv of normal owls
Most sites in the nOv of normal owls (Fig.3a–d) were tuned to ITDs of <50 μsec, corresponding to sound sources located in the frontal 40° of space. The ITDs produced by an auditory stimulus located in frontal space are nearly constant across frequencies (Knudsen et al., 1991; Keller et al., 1998). The relative constancy of acoustic ITD across frequencies was reflected in the constancy of ITD tuning across frequencies in the nOv of normal owls.

Change in ITD tuning with stimulus frequency in normal and device-reared owls. a–d, Data from normal owls. a, Narrowband ITD tuning curves collected at a single site in the nOv. Triangles indicate best ITD values for each curve. Error bars represent SEM. Negative ITD values represent left-ear leading; positive ITD values represent right-ear leading. b, Summary of all narrowband data collected from normal owls (5 owls; 70 sites). Best ITD is plotted as a function of frequency. Lines connect data collected at individual sites. c, Average differences between best ITD values measured at individual sites with narrowband stimuli that had center frequencies separated by 1 kHz. Error bars indicate SEM.d, Composite ITD–response curves for narrowband (1 kHz bandwidth) and broadband (3–12 kHz) stimuli. A composite curve represents the percentage of sites that responded at or above 50% of their maximal response for each of the sampled ITD values. Negative ITDs indicate left-ear leading; positive ITDs indicate right-ear leading. e–h, Data from device-reared owls (5 owls; 60 sites) plotted as described for a–d.
Figure 3a shows an example of frequency-specific ITD tuning measured at a single site that was tuned for a relatively broad range of frequencies. Best ITDs (see Materials and Methods) measured with narrowband stimuli centered on 5, 6, and 7 kHz were −49, −53, and −44 μsec, respectively. Frequency-specific ITD tuning was measured at 70 sites in the right nOv of five normal owls (number of sites sampled in each owl: 5, 10, 12, 13, 15, and 15). The results are summarized in Figure 3b. Best ITD is plotted for each narrowband stimulus that elicited a response. Best ITDs clustered at small, contralateral ear leading ITDs. Many sites responded to more than one of the standard center frequencies that were tested (4, 5, 6, 7, and 8 kHz). Data from such sites are connected bylines.
Best ITDs were generally independent of stimulus frequency. Across the population of sampled sites, best ITDs progressed slightly toward right-ear leading with increasing stimulus frequency (linear regression; 3.7 μsec/kHz; p = 0.011;n = 196), as expected from acoustic measurements (Knudsen et al., 1991; Keller et al., 1998). For sites that were excited by more than one center frequency, differences between best ITDs for center frequencies separated by 1 kHz were calculated for all pairs of center frequencies (Fig. 3c). The largest frequency-dependent difference in best ITD was 4.6 ± 4.1 μsec (SEM; n = 23) for 4 kHz versus 5 kHz narrowband stimuli. The tendency for ITD tuning to progress toward more right-ear leading values with increasing stimulus frequency was also apparent in the composite ITD–response curves (Fig. 3d), which represent the proportions of strongly activated sites as a function of ITD across the sampled population. The weighted averages for the composite response curves for narrowband stimuli centered on 4, 5, 6, 7, and 8 kHz, respectively, were −30, −26, −19, −16, and −10 μsec.
Broadband stimuli were also used to measure ITD tuning. The mean broadband best ITD was −17 ± 26 μsec (SD; n = 100), indicating a small bias for contralateral-ear leading ITDs. The composite response curve for broadband stimuli (Fig. 3d,shaded curve) confirmed this bias; the weighted average was −22 μsec.
ITD tuning in the nOv of device-reared owls
Long-term experience (> 2 months) (see Materials and Methods) with the acoustic filtering device implanted in the right ear canal during the juvenile period resulted in a dramatic increase in the frequency dependence of ITD tuning in the nOv (Fig. 3e–h). Frequency-specific ITD tuning at a representative site in the nOv of a device-reared owl is shown in Figure 3e. This site responded to narrowband stimuli with center frequencies from 4 to 6 kHz. ITD tuning shifted markedly toward more right-ear leading values with increasing stimulus frequency. Best ITDs measured with narrowband stimuli centered on 4, 5, and 6 kHz, respectively, were −89, −65, and −33 μsec. This direction of shift corresponded to the acoustic effects of the device (Fig. 2).
Frequency-specific ITD tuning was assessed at 60 sites in the right nOv of five device-reared owls (number of sites sampled in each owl: 9, 12, 12, 17, and 20). Across the sampled population, best ITDs shifted toward more right-ear leading values with increasing stimulus frequency (Fig. 3f) (linear regression: 18 μsec/kHz;p < 0.0001; n = 149). Compared with normal, best ITDs were shifted toward more left-ear leading values for 4 and 5 kHz stimuli and toward more right-ear leading values for 8 kHz stimuli (two-tailed t test; p < 0.0001). The difference between best ITDs measured with center frequencies separated by 1 kHz ranged from means of 13 to 22 μsec (Fig.3g, gray bars). These differences were in the same direction for all stimulus pairs and were significantly different from normal (two-tailed t test; p < 0.001) for all pairs except 4–5 kHz (p = 0.0859). The abnormally steep progression toward more right-ear leading values with increasing stimulus frequency was also apparent in the composite ITD–response curves (Fig. 3h). The weighted averages of the composite curves for 4, 5, 6, 7, and 8 kHz were −54, −54, −28, −20, and +10 μsec, respectively.
ITD tuning was also tested with broadband stimuli to permit a direct comparison with data collected from owls raised with prism spectacles (see below). Responses to broadband stimuli represent the combination of ITD tuning to narrowband stimuli. Because narrowband ITD tuning had shifted by different amounts depending on frequency (Fig. 3,b,d vs f,h), ITD tuning in device-reared owls, when tested with broadband stimuli, should have broadened. In addition, it should have shifted slightly toward left-ear leading ITDs, reflecting the predominance of shifts toward left-ear leading ITDs measured with 4 and 5 kHz narrowband stimuli (Fig.3f,h). Indeed, the broadband composite response curve (Fig. 3h, shaded curve) was broader than the composite curve for normal owls (Fig. 3d, shaded curve) and had a weighted average of −45 μsec, a shift of 23 μsec toward left-ear leading relative to the normal curve.
Best ITDs measured with broadband stimuli were also shifted toward more left-ear leading values in the device-reared owls. The mean broadband best ITD was −39 ± 33 μsec (SD; n = 22), a 22 μsec shift toward left-ear leading ITDs relative to normal (two-tailed t test; p < 0.005).
ITD tuning in the ICC of device-reared owls
The experience-dependent changes in ITD tuning observed in the nOv of device-reared owls could have resulted from plasticity that occurred at an earlier stage in the ascending auditory pathway. To investigate this possibility, we assessed the frequency dependence of ITD tuning in the ICC, the stage immediately preceding the nOv (Fig. 1), in two device-reared owls. Although sites in the nOv from these same owls exhibited strongly frequency-dependent ITD tuning (Fig.4a), sites in the ICC tested in an identical manner did not (Fig. 4b). The range of best ITDs is more restricted in owl 13 than in owl 14 because ITD is represented systematically along the rostrocaudal dimension in the lateral shell of the ICC (Wagner et al., 1987; Brainard and Knudsen, 1993) and recordings were made from only the rostral third of the nucleus in owl 13 but more extensively, from the rostral half of the nucleus, in owl 14.

Frequency-specific ITD tuning in the nOv and ICC of two device-reared owls. a, Data from the nOv of owl 13 (n = 20 sites) and owl 14 (n= 12 sites). Lines connect data collected at single sites. Negative ITD values represent left-ear leading; positive ITD values represent right-ear leading. In both owls, best ITDs changed with stimulus frequency in the adaptive direction (linear regression;p < 0.0001). b, Data from the lateral shell of the ICC in the same owls. Narrowband best ITD plotted as a function of stimulus frequency for sites tuned broadly for frequency. Lines connect data collected at single sites. In neither owl did best ITD change with stimulus frequency (p > 0.05). The value of ITD to which a site is tuned depends on its rostrocaudal location in the ICC.c, Broadband best ITD plotted as a function of best frequency for electrode penetrations through the lateral shell of the ICC (owl 13, 3 penetrations; owl 14, 8 penetrations).Lines connect data from the same penetration. The data on the left show a small dependence of best ITD on stimulus frequency (−3.4 μsec/kHz; p = 0.042;r2 = 0.211), but the direction of this effect is opposite to the adaptive direction. The data on theright exhibit no dependence of best ITD on stimulus frequency (p = 0.966). The value of ITD to which a site is tuned depends on the rostrocaudal location of the recording site in the ICC.
The data shown in Figure 4b were collected at the minority of ICC sites at which ITD tuning could be measured using two or more of the standard narrowband stimuli (8 of 40 sites for owl 13; 6 of 21 sites for owl 14). To examine the frequency dependence of ITD tuning across the entire population of sampled sites in the ICC, a second method was used (Fig. 4c). In normal owls, sites recorded in dorsoventral penetrations along the tonotopic axis of the ICC tend to have similar ITD tuning when tested with broadband stimuli (Wagner et al., 1987; Brainard and Knudsen, 1993). In owls 13 and 14, as in normal owls, ITD tuning did not vary systematically with best frequency in dorsoventral penetrations along the tonotopic axis through the ICC (Fig. 4c), although the data from owl 14 exhibited a greater range of broadband best ITDs than those from owl 13, reflecting the larger rostrocaudal range of sampling made in this animal. Thus, the frequency-dependent ITD tuning, so apparent in the nOv of these two owls (Fig. 4a), was not evident in the ICC (Fig.4b,c) in either animal. Therefore, in agreement with an extensive previous study (Gold and Knudsen, 2000), the data indicate that the representation of ITD in the ICC was not altered by device rearing.
ITD tuning in the nOv of prism-reared owls
To test whether visual experience plays a role in shaping auditory response properties in the nOv, we raised five owls with horizontally displacing prismatic spectacles and then examined the nOv for corresponding shifts in ITD tuning. Because the change in ITD tuning that corresponds to a horizontal displacement of the frontal visual field is essentially the same for all stimulus frequencies (Knudsen et al., 1991; Keller et al., 1998), there was no reason to expect different adjustments in ITD tuning at different frequencies. Therefore, ITD tuning was measured with broadband (3–12 kHz) stimuli.
Before measuring ITD tuning in the nOv, recordings were made in the optic tecta of the same five owls to verify that adaptive shifts in ITD tuning had indeed occurred in the midbrain localization pathway. In these owls, average shifts of broadband best ITD in the optic tectum (see Materials and Methods) ranged from 30 to 42 μsec in the adaptive direction.
In contrast to the optic tectum, ITD tuning in the nOv was not altered by prism rearing (Fig. 5). A total of 113 sites were sampled in the nOv of five prism-reared owls (number of sites sampled in each owl: R23° prisms, 20, 21, and 29; L23° prisms, 21 and 22). For owls that were either normal, raised with R23° spectacles, or raised with L23° spectacles, broadband best ITDs represented the same range of small, contralateral-ear leading values. The mean best ITD for normal owls was −17 ± 26 μsec (SD); for R23° owls, it was −23 ± 24 μsec; for L23° owls, it was −24 ± 20 μsec. Broadband best ITDs in the prism-reared owls were not different from those in the normal owls (ANOVA;p = 0.158 and 0.151, respectively), and the best ITDs in each of these groups were significantly different (p < 0.01) from broadband best ITDs measured in device-reared owls, described previously.

Representation of ITD in the nOv of normal and prism-reared owls. Top, Each horizontal line represents data from a single site and indicates the range of ITD values that elicited at least 50% of the maximal response for that site. Negative ITD values represent left-ear leading; positive ITD values represent right-ear leading. Bottom, Composite ITD–response curves for broadband (3–12 kHz) stimuli, summarizing the data shown above. a, Five normal owls, 100 sites;b, three owls raised with R23° prisms, 70 sites;c, two owls raised with L23° prisms, 43 sites;d, composite ITD–response curves for broadband (3–12 kHz) stimuli representing normal owls (thick solid line), prism-reared owls (thin solid lines), and device-reared owls (thick dashed line) (data from Fig.3h).
Discussion
This study demonstrates that auditory experience during the juvenile period shapes the functional properties of neurons in the auditory thalamus of the barn owl. The changes in ITD tuning measured in the nOv (Fig. 3) are adaptive in that they tend to compensate for the acoustic effects of the device (Fig. 2) and are equal in magnitude to the changes that have been reported previously in the AGF of device-reared owls (Miller and Knudsen, 2001) (Fig.6). To the extent that these sets of data are comparable, the functional changes observed at the level of the thalamus appear to be a fully adaptive adjustment to the pattern of ITDs experienced by these owls and can account completely for the functional plasticity that has been observed at higher levels in the forebrain (Fig. 6).

Comparison of the effects of the passive acoustic filtering device on acoustic ITD at 4 versus 8 kHz and on best ITD in the nOv and AGF at 4 versus 8 kHz in device-reared owls.Bars represent medians and quartiles. Change in acoustic ITD is based on cochlear microphonic recordings from five owls, with the filtering device in place, measuring ITD at 4 and 8 kHz, respectively, with a sound source located at 0° azimuth, 0° elevation (data from Gold and Knudsen, 1999). The data for the nOv are from 18 sites at which best ITD could be measured at 4 and 8 kHz. The data for the AGF are from 32 sites at which best ITD could be measured at 4 and 8 kHz (data from Miller and Knudsen, 2001). These data are not different from each other (Mann–Whitney U test;p > 0.05).
Previous studies have reported modest plasticity in the auditory thalamus of other species (Edeline and Weinberger, 1991a,b, 1992). The plasticity revealed by these studies was induced by classical conditioning experiments in which a tone was paired with a footshock. Thalamic neurons in guinea pigs increased their responsiveness to the frequency of the tone and decreased their responsiveness to other frequencies. The changes were small, however, relative to those that were observed in the auditory cortex under similar conditions (Weinberger, 1995). In contrast, the experience-dependent changes reported in this study were large, perhaps because our experiments were performed on juvenile instead of adult animals and because they involved adaptation to a chronic change in hearing instead of acute training with classical conditioning techniques.
Best ITD as a measure of ITD coding
This study demonstrates adaptive changes in the representation of ITD in the thalamus (Fig. 3, compare d, h), using best ITD as the metric for ITD coding. Recent studies of ITD coding (Skottun et al., 2001; Brand et al., 2002) remind us that the most precise information about ITD value is encoded by the flank of the tuning curve where neuronal responses change most rapidly, typically near the ITD that elicits 50% of the maximum response. This is true for neurons with tuning curves that have only one flank that is within the behavioral range of ITD values. In the barn owl, however, at frequencies >3 kHz, both flanks of ITD tuning curves are within the behavioral range.
By using best ITD (the midpoint between the flanks) as our measure of ITD coding, we assumed that the auditory system is processing information from both flanks. This assumption is supported by the facts that both flanks of ITD tuning curves were affected similarly by the experience (Fig. 3h), best ITDs correspond to contralateral space (as expected from space coding in other sensory systems), and best ITDs differentially represent frontal space, where owls are most accurate at localizing sounds (Knudsen et al., 1979). If this experiment were done, instead, on a species in which ITD tuning curves have only one flank that is within the behavioral range, the appropriate metric for evaluating shifts in ITD coding would be shifts in the relevant flank of ITD tuning curves.
Learning rules in the thalamus
The adaptive adjustments that resulted from abnormal auditory experience could have been caused by self-organizational forces that strengthen functional connections according to correlation-based learning rules (Miller, 1990). These forces could have tuned nOv neurons to the complex patterns of ITD across frequencies that the animals experienced with the device in place.
A second possibility is that the adaptive changes in response to abnormal hearing resulted from visual instruction of ITD tuning when the animals experienced bimodal (auditory–visual) stimuli (Knudsen, 1994). Prism experience during the juvenile period has revealed instructive visual influences on auditory tuning in a number of other auditory areas, including in the AGF, external nucleus of the inferior colliculus (ICX), and optic tectum (Knudsen and Brainard, 1991;Brainard and Knudsen, 1993; Miller and Knudsen, 1999). In contrast, prism experience did not cause changes in ITD tuning in the nOv (Fig.5), although ITD tuning in the midbrain pathway of the same animals was altered dramatically. Thus, it is unlikely that visual instruction is responsible for the plasticity in the nOv.
Adaptive adjustments in the auditory localization pathway
The forebrain auditory pathway subserves a wide variety of high-order functions, including stimulus recognition and memory (Knudsen and Knudsen, 1996b; Cohen and Knudsen, 1999). The adaptive plasticity in the thalamus enables neurons to combine information across frequency channels that originates from single stimulus objects. This grouping of information according to source location allows forebrain pathways to process efficiently other acoustic parameters that characterize a stimulus object, such as its spectral and temporal features.
Visual calibration of auditory information, conversely, is not required for efficient processing of auditory stimuli. Visual calibration need occur only at the stage in the forebrain pathway at which auditory and visual spatial information is merged or where auditory spatial information is used to direct gaze toward auditory stimuli. At these stages, agreement between auditory and visual representations of space is essential. Consistent with this line of reasoning, visual experience did not affect the ITD tuning of neurons in the thalamus (Fig. 5) but did cause adaptive adjustments in ITD tuning at the level of the AGF and the ICX (Brainard and Knudsen, 1993; Miller and Knudsen, 2001), premotor structures that are involved in orienting gaze (Knudsen et al., 1993; Wagner, 1993; Knudsen and Knudsen, 1996a).
Sites of plasticity
Previous work (Brainard and Knudsen, 1993; Gold and Knudsen, 2000) and data from this study (Fig. 4b,c) show that ITD tuning in the ICC is not affected by either abnormal auditory or visual experience. In the thalamus, which receives feedforward input directly from the ICC (Fig. 1), ITD tuning is altered by abnormal auditory experience (Fig. 3e–h) but not by abnormal visual experience (Fig. 5). Finally, in the AGF, ITD tuning is altered by both abnormal auditory and abnormal visual experience (Miller and Knudsen, 1999, 2001).
This pattern of effects leads to a number of conclusions about the sites in the forebrain pathway at which experience causes changes in neuronal connections. First, in the forebrain pathway, experience exerts its effects on ITD tuning above the level of the ICC. Second, the sites at which auditory and visual experience exert their respective effects on auditory tuning are different: auditory experience causes adaptive adjustments in the representation of auditory information just as the information enters the forebrain, whereas visual experience exerts its effects at a later stage, perhaps at the stage at which auditory spatial information is provided to motor areas involved in gaze control (i.e., in the AGF) (Miller and Knudsen, 1999).
The plasticity that we observed in the nOv was not a result of the plasticity that is known to occur in the ICX (Feldman and Knudsen, 1998; Zheng and Knudsen, 1999; DeBello et al., 2001). Experience with prism spectacles causes large adaptive changes in ITD tuning in the ICX, reflecting anatomic and pharmacological changes that take place in this nucleus. In contrast, experience with prism spectacles does not affect ITD tuning in the nOv (Fig. 5). Therefore, ITD tuning in the nOv is calibrated independently of ITD tuning in the ICX. This is consistent with the failure of anatomic studies to find connections from the ICX to the nOv (Proctor and Konishi, 1997; Cohen et al., 1998) and with previous results, indicating that these two pathways analyze and interpret sound localization cues in parallel (Knudsen and Knudsen, 1996a; Cohen et al., 1998).
The nOv is the earliest stage in the forebrain pathway at which adaptive adjustments in ITD tuning in response to abnormal auditory experience appear. The adjustments do not represent adaptive changes occurring at the level of the AGF, because the ITD tuning of AGF neurons is altered by prism experience (Miller and Knudsen, 1999), whereas the ITD tuning of nOv neurons is not (Fig. 5). This does not mean, however, that the nOv is the site at which changes in neuronal connections take place. Experience-dependent changes could occur at later stages in the forebrain auditory pathway (in field L, for example) and be expressed in the thalamus through the action of feedback connections from these areas. Additional research will be necessary to determine whether the nOv is indeed a site of plasticity.
Footnotes
This work was supported by grants from the March of Dimes and the McKnight Foundation and by National Institutes of Health/National Institute on Deafness and Other Communication Disorders Grant R01 DC 00155-21. We thank B. Linkenhoker, Y. Gutfreund, and J. Bergan for comments on this manuscript.
Correspondence should be addressed to Eric I. Knudsen, 299 Campus Drive, Department of Neurobiology, Stanford University School of Medicine, Stanford, CA 94305-5125. E-mail: eknudsen{at}stanford.edu.


