

Abstract
We studied the effect of synaptic inputs of different amplitude and duration on neural oscillators by simulating synaptic conductance pulses in a bursting conductance-based pacemaker model and by injecting artificial synaptic conductance pulses into pyloric pacemaker neurons of the lobster stomatogastric ganglion using the dynamic clamp. In the model and the biological neuron, the change in burst period caused by inhibitory and excitatory inputs of increasing strength saturated, such that synaptic inputs above a certain strength all had the same effect on the firing pattern of the oscillatory neuron. In contrast, increasing the duration of the synaptic conductance pulses always led to changes in the burst period, indicating that neural oscillators are sensitive to changes in the duration of synaptic input but are not sensitive to changes in the strength of synaptic inputs above a certain conductance. This saturation of the response to progressively stronger synaptic inputs occurs not only in bursting neurons but also in tonically spiking neurons. We identified inward currents at hyperpolarized potentials as the cause of the saturation in the model neuron. Our findings imply that activity-dependent or modulator-induced changes in synaptic strength are not necessarily accompanied by changes in the functional impact of a synapse on the timing of postsynaptic spikes or bursts.
- dynamic clamp
- phase response curve
- phase resetting curve
- PRC
- stomatogastric ganglion
- STG
- lobster
- neural oscillators
- synapse strength
- model neuron
- burst
- spike frequency
Introduction
Understanding the regulation of synaptic strength is a major question in neuroscience, the presumption being that changes in synaptic strength will modify network performance. Despite the large body of knowledge that demonstrates that synaptic strength is regulated in both the short-term and more permanent manners by patterns of presynaptic activity and chemical signals (Marder, 1998; Abbott and Nelson, 2000; Paulsen and Sejnowski, 2000; Song et al., 2000; Poo, 2001; Zucker and Regehr, 2002), there are fewer direct assessments of the functional significance of these changes for neuronal or network dynamics.
In some cases, activity or neuromodulation produce modest changes in synaptic strength. In other cases, they can increase or decrease the amplitude of recorded synaptic potentials by severalfold (Turrigiano et al., 1998; Kandel, 2001). For example, neuromodulators have been shown to change the strength of a crucial feedback synapse to the pyloric pacemaker kernel in the lobster stomatogastric ganglion (STG) by factors of two to five (Ayali et al., 1998; Thirumalai, 2002). Although it is natural to assume that large changes in synaptic strength will produce more dramatic actions on the firing of postsynaptic neurons and the networks in which they operate than smaller changes, modeling studies demonstrate that some small changes in parameters can be more effective than other larger changes in influencing neuronal firing (Goldman et al., 2001). This motivated us to study systematically how oscillatory neurons respond to changes in the strength and duration of synaptic inputs.
The impact of inputs to biological oscillators depends on their timing relative to the oscillator rhythm (Brown and Eccles, 1934). This phase dependence can be described by a phase response curve (PRC), which indicates the change in oscillator period caused by synaptic inputs occurring at different phases in the rhythm (Perkel et al., 1964;Pinsker, 1977a,b). The PRC is a compact way of capturing the functional significance of a synaptic input to an oscillator (Abramovich-Sivan and Akselrod, 1998), and therefore we simulated and measured PRCs of model and biological oscillatory neurons while varying the strength and duration of both inhibitory and excitatory synaptic conductance pulses.
In most biological systems, it is not easy to vary systematically the strength and duration of a synaptic input. To overcome this difficulty, we used the dynamic clamp (Sharp et al., 1993a,b) to implement artificial synaptic conductances of variable strength and duration in the pyloric dilator (PD) neuron of the lobster, Homarus americanus. We computed PRCs by applying these inputs at different times during the cycle of the oscillator. Using synaptic conductance pulses to assess the phase response of model and biological oscillators in our view generates functionally more meaningful PRCs than the ones obtained with the traditionally used current pulses, which can take the membrane potential to unphysiological levels. Surprisingly, in both model and biological neurons, the effect of altering synaptic strength saturates; relatively small changes in the strength of weak synapses may be more functionally significant than other large changes. We then used our computational model of an oscillatory neuron to obtain insight into the mechanisms by which this saturation occurs in bursting neurons and to generalize the results to spiking neurons.
Parts of this work has been published previously in abstract form (Prinz et al., 2002).
Materials and Methods
Model neuron. We used a single compartment model neuron with eight Hodgkin-Huxley type membrane currents and an intracellular calcium buffer. Similar model neurons have been described in detail previously (Liu et al., 1998; Goldman et al., 2001). The membrane currents are based on experiments on lobster neurons (Turrigiano et al., 1995) and consist of the following: a fast sodium current, INa; a fast and a slow transient calcium current, ICaT andICaS; a fast transient potassium current, IA; a calcium-dependent potassium current, IKCa; a delayed rectifier potassium current, IKd; a hyperpolarization-activated inward current,IH; and a voltage-independent leak current, Ileak.
Each current Ii
is described byIi
=ḡimi
pihi
(V− Ei
)A, whereḡi
is the maximal specific conductance,Ei is the reversal potential, andA = 0.628 × 10⁻³cm2 is the membrane area of the model neuron. Unless otherwise mentioned, values for the individual conductances are as follows (in mS/cm2):INa, 200;ICaT, 2.5;ICaS, 4;IA, 50;IKCa, 5;IKd, 100;IH, 0.01; andIleak, 0.01 for the bursting version of the model neuron. In the course of the paper, we seek to generalize our results for bursting neurons to tonically spiking neurons. For this purpose, we use a spiking version of the model neuron with the following maximal conductances (in mS/cm2):INa, 200;ICaT, 0;ICaS, 4;IA, 10;IKCa, 10;IKd, 125;IH, 0.05; andIleak, 0.04. The reversal potential is +50 mV for Na+, −80 mV for the three potassium currents, −20 mV for IH, and −50 mV for Ileak. The calcium reversal potential is determined by the momentary intracellular calcium concentration and an extracellular calcium concentration of 3 mm using the Nernst equation. The values for the integer exponents pi are given in Table 1. The activation and inactivation variables mi andhi change according to the following:
 with time constants τm and τh and steady-state valuesm∞ and h∞ as listed in Table 1. The voltage dependence and dynamics ofIH are based on Huguenard and McCormick (1992), and those of all other currents were taken from Liu et al. (1998); all activation and inactivation time constants were multiplied by a factor of two to account for the temperature difference between our experiments with STG neurons, which were performed at 9–14°C, and the experiments on STG neurons from which the time constants were determined, which were done at room temperature (Turrigiano et al., 1995).
Voltage dependence of model neuron currents
The instantaneous synaptic currentIsyn =ḡsyn(V −Esyn) reverses atEsyn = −65 mV for inhibitory input to the bursting model. In the spiking version of the model, we loweredEsyn to −70 mV to ensure that the resulting synaptic current was still inhibitory during most of the very hyperpolarized part of the voltage trace. In both models,Esyn = 0 mV for excitatory input. Together with this synaptic current, the membrane currents govern the membrane potential V according to the following:
 where C = 0.628 nF is the capacitance of the 0.628 × 10⁻³cm2 membrane area.
The intracellular calcium concentration [Ca2+] that controlsIKCa andECa changes according to the following:
 where τCa = 200 msec is the calcium removal time constant, f = 14.96 μm/nA is a factor that translates the total calcium current into a calcium concentration change inside the cell (Liu et al., 1998), and [Ca2+]0 = 0.05 μm is the steady-state intracellular calcium concentration when no calcium ions flow across the membrane.
All differential equations were integrated with Euler's method at a time resolution of 25 μsec. Without synaptic input, the model neuron generated bursts of action potentials with a burst period ofP = 1.06 sec and a burst duration (which we define as time between the first and last spike in a burst) of 0.25 sec. The free-running spiking model had a spike frequency of 4 Hz.
Phase response curves. To obtain PRCs of the bursting model pacemaker neuron, we simulated square pulses of synaptic conductanceḡsyn at different times during the ongoing simulated rhythm with ḡsyn = 0 at all times before and after the pulse (Demir et al., 1997). We assign phase zero to the peak of the first spike in each burst and call it the burst start (Pinsker, 1977a). For a conductance pulse beginning at time ΔT after the start of the preceding burst, the stimulus phase is defined as ΔT/P (Winfree, 1980), whereP is the burst period of the free-running oscillator (Fig.1A).

Phase responses of the model neuron to single and repeated inhibitory and excitatory synaptic inputs. A, Simulated membrane potential traces with single (top) and repeated (bottom) inhibitory synaptic conductance pulses at an early phase (left; phase 0.1) and at a late phase (right; phase 0.8); the peak of the first spike in the burst was defined as phase 0. The dots above thetop traces show the time at which the first spike in each burst would occur in the unperturbed rhythm. The delay ΔT of the conductance pulse after the onset of the previous burst, the free-run period P, the perturbed period P′, and period changes ΔPn of several bursts after the perturbation are indicated. Voltage and time scales are the same as inB. B, Model neuron potential traces receiving excitatory synaptic conductance pulses at phase 0.2 (left) and phase 0.7 (right) for single (top) and repeated (bottom) input. In both A and B, the stimulus duration was 500 msec and the stimulus amplitude was 100 nS. C, Inhibitory phase response curves (top), excitatory phase response curves (middle), and unperturbed membrane potential trace of the model neuron (bottom). The PRCs show the relative period change ΔP/P at different stimulus phases ΔT/P. For the immediate PRCs, the period change ΔP1 of the first burst after a single perturbation was used. For both inhibitory and excitatory stimuli, this PRC is almost identical to the one labeled contingent, which plots the relative period change (P′ − P)/P in response to repeated pulses. The PRCs labeled permanentshow the relative period change ΔP3/P of the third burst after the perturbation and thus indicate the permanent phase reset caused by a single input.
For a single synaptic conductance pulse, we define the period change ΔP1 caused by the pulse as the time difference between the start of the first burst after the onset of the pulse and the time at which this burst would have started if the pulse had not been delivered (Fig. 1A, dot). If the pulse causes the first following burst to occur earlier than in the free-run rhythm, ΔP1 is negative; if the burst starts later than in the unperturbed rhythm, ΔP1 is positive. Similarly, a shift ΔPn can be defined for then-th burst after the onset of the pulse as illustrated in Figure 1, A and B. For any given stimulus amplitude ḡsyn and stimulus duration, we simulated conductance pulses at different stimulus phases with a phase resolution of 0.01 to construct PRCs with 100 data points.
When the normalized period change ΔP1/P after a single stimulus pulse is plotted against the stimulus phase ΔT/P, the resulting curve corresponds to the classical PRC (Pinsker, 1977a); here, we call it theimmediate PRC because it describes the effect of synaptic input on the burst immediately after the perturbation (Fig.1C). To capture the long-term effect of a single input pulse, we also plot ΔP3/P versus the stimulus phase to obtain what we call thepermanent PRC (also illustrated in Fig. 1C) because it describes the permanent phase reset caused by a single input pulse; we found that the shifts ΔPn withn > 3 were the same as ΔP3 for all stimulus amplitudes and durations that we used.
For repeated stimuli with the same delay ΔT after every burst onset, we constructed a PRC by determining the steady-state burst period P′ that is reached after several stimuli and plotting the normalized period change (P′ −P)/P against ΔT/P. This PRC characterizes the effect of repeated stimuli on the burst period and indicates the burst periods that can result from entrainment of the oscillator by a periodic stimulus. It is labeled contingentin Figure 1C (Pinsker and Kandel, 1977).
Recordings from biological neurons. H. americanuswere purchased from Commercial Lobster (Boston, MA) and maintained in artificial seawater at 11°C until used. Stomatogastric nervous systems (STNSs) were dissected out and pinned out in dishes coated with Sylgard (Dow Corning, Midland, MI), and the STGs were desheathed with fine forceps. Throughout the experiments, the STNSs were superfused with chilled (9–14°C) saline containing the following (in mm): 479.12 NaCl, 12.74 KCl, 13.67 CaCl2, 20 MgSO4, 3.91 Na2SO4, and 5 HEPES, pH 7.45.
Extracellular recordings were made with stainless steel pin electrodes in Vaseline wells on the motor nerves and amplified with a differential AC amplifier (model 1700; A-M Systems, Carlsborg, WA). Intracellular recordings from cells in the STG were obtained with an Axoclamp 2B amplifier (Axon Instruments, Foster City, CA) in discontinuous current-clamp mode using microelectrodes filled with 0.6m K2SO4 and 20 mm KCl; electrode resistances were in the range of 20–40 MΩ. Extracellular and intracellular potential traces were digitized with a Digidata 1200A board (Axon Instruments), recorded using Clampex 8.0 software (Axon Instruments), and analyzed with in-house software. PD and lateral pyloric (LP) motor neurons were identified based on their membrane potential waveforms, the timing of their activity in the pyloric rhythm, and their axonal projections to the appropriate motor nerves. The only synaptic feedback to the pyloric pacemaker group through the LP-to-PD inhibitory synapse was removed by hyperpolarizing LP with DC current injection to prevent it from bursting.
Dynamic clamp. We used the dynamic clamp (Sharp et al., 1993a,b) to record PRCs from PD neurons by replacing the synaptic input from LP onto PD by artificial synaptic conductance pulses of different amplitudes and durations: the membrane potentialVm at the PD cell body was amplified as described above, fed into a Digidata 1200A board (Axon Instruments), and digitized at a rate of 2 kHz with in-house software modified from a C++ program kindly provided by Dr. R. Pinto (Physics Institute, University of Säo Paulo, Säo Paulo, Brazil) (Pinto et al., 2001). The dynamic-clamp program detected bursts in the ongoing PD rhythm and monitored the instantaneous burst period. Artificial synaptic conductance pulses were generated at different phases of the PD rhythm by instantaneously stepping the conductanceḡsyn to the desired value for the desired duration. During the pulse, the program computed the momentary synaptic current according to Isyn =ḡsyn(V −Esyn), where the synaptic reversal potential Esyn was 0 mV for excitatory pulses and −90 mV for inhibitory pulses based on voltage-clamp experiments on the LP-to-PD synapse (Thirumalai, 2002). To inject this synaptic current into the PD neuron, the program computed the corresponding command voltage, which was turned into an analog voltage by the Digidata board and sent to the electrode amplifier. The PD neuron returned to its unperturbed burst pattern after each pulse before the next pulse was injected; this was ensured by spacing single conductance pulses at least four burst periods apart. The PD membrane potential and injected current were saved by the dynamic-clamp program and analyzed off-line to compute PRCs as described for the model neuron above but using an average of several unperturbed periods instead of the period immediately preceding the injection for P to compensate for variability in the pyloric burst period. The phase resolution for each experimental PRC was 0.05, corresponding to 20 data points per PRC. In some experiments, PRC recordings for a given amplitude and duration were repeated four to five times and pooled to produce PRCs with up to 100 data points.
Results
Inhibitory and excitatory model neuron PRCs
We simulated synaptic conductance pulses in a bursting model neuron to study the effect of synaptic inputs of different amplitudes and durations on oscillatory neurons. Figure 1A shows example traces with inhibitory conductance pulses injected once (top traces) or injected in every cycle of the rhythmic burst pattern (bottom traces). In Figure1B, excitatory conductance pulses were injected once (top traces) or in every cycle (bottom traces). The effect of these inputs on the oscillator period is described by phase response curves (Pinsker, 1977a,b). These curves plot the relative period change ΔP/P against the stimulus phase ΔT/P (Winfree, 1980), where ΔP is the difference between the perturbed period and the free-run period P. ΔT is the delay of the stimulus onset after phase 0, which we define as the peak of the first spike in each burst. If a conductance pulse shortens the burst period, the value of the PRC is negative, and if a stimulus increases the period, the PRC has a positive value.
Depending on the questions one wants to study, different phase response curves can be constructed from traces like the ones in Figure 1, A and B: the immediate effect of a single stimulus on the following burst is described by the classical PRC, which uses the shift ΔP1 of the first burst onset after the start of the stimulus as a measure for the period change caused by the pulse (Pinsker, 1977a,b). This PRC is labeled immediate in Figure 1C, and it is the kind of PRC we use in the rest of the figures.
As can be seen from the traces in Figure 1, the effect of a single stimulus pulse on later bursts is not necessarily the same as the effect on the first burst after the stimulus. The long-term phase reset caused by a single pulse is therefore better described by a PRC that uses ΔPn with n ≥ 3 as the measure for the shift; we found that, in all of our simulations, the shift of the third burst after the stimulus was indistinguishable from the shifts of later bursts. We label this PRCpermanent in Figure 1C.
Because neuronal pacemakers often receive periodic synaptic input in every cycle of their rhythm, another PRC of interest is the one that describes the period change ΔP = P′ −P in response to repeated inputs. Here, P′is the steady-state perturbed period that is reached after several perturbations with the same delay ΔT after the preceding burst (Fig. 1A,B,bottom traces). For historical reasons, this PRC is labeledcontingent in Figure 1C (Pinsker and Kandel, 1977).
As Figure 1C shows, the immediate, permanent, and contingent PRCs in response to inhibitory conductance pulses have the same general shape. Inhibition at early phases disrupts the burst and advances the following bursts, whereas inhibition at late phases prolongs the hyperpolarized part of the waveform and only allows the bursting pacemaker neuron to burst after the end of the inhibition, thus causing a delay of the following bursts (Ayers and Selverston, 1979). The inhibitory conductance pulses also cause the next burst to be longer than the unperturbed bursts (Fig. 1A) because they activate the rebound mechanisms of the neuron. This longer burst duration additionally delays later bursts, which is why the permanent PRC constructed from the third burst is shifted to larger delays at all phases with respect to the immediate PRC.
The different excitatory PRCs also have the same general shape (Fig.1C) and exhibit both advances and delays, a property that identifies them as type II PRCs according to Ermentrout (1996): a PRC is defined as type I if it is strictly non-negative and as type II if it has a negative regimen. At early phases, an excitatory conductance pulse prolongs the burst and delays the following bursts, resulting in a positive value of the PRC. Excitatory synaptic input that occurs after the burst is over can depolarize the neural oscillator enough to generate an early burst, so the PRC at late phases is negative (Ayers and Selverston, 1979). If this early burst is long (as is the case for long stimulus durations), the advance of the later bursts is smaller than that of the first burst after stimulus onset, which explains that the permanent PRC is shifted up with respect to the immediate delay at these late phases.
For both inhibitory and excitatory PRCs, we found that the immediate and the contingent PRC are almost identical. This means that the immediate PRC, which is computed from the effect of a single stimulus on the following burst, predicts how periodic synaptic input onto the bursting pacemaker neuron changes the pacemaker period. We found that this holds for all stimulus amplitudes and durations in the range we tested in our simulations and experiments (data not shown).
Inhibitory PRCs for inputs of increasing amplitude saturate
Figure 2A shows model neuron voltage traces with inhibitory synaptic pulses of 500 msec duration but different conductance amplitudes. The immediate PRCs for these four stimulus amplitudes are shown in Figure2B. The oscillator period change attributable to synaptic inputs of progressively larger amplitude saturates. For small synapse strength (1 nS; black), the input causes a small advance at early phases and a small delay at late phases. For a 10 nS input (blue), both the advance and the delay are larger. However, a 100 nS synapse causes the same delay at late phases and an only slightly larger advance at early phases, and the PRC for 1000 nS (red) is indistinguishable from the one for 100 nS. This saturation is also illustrated by Figure 2C, which shows the phase response ΔP/P at phases 0.1–0.9 plotted against the stimulus amplitude: the response saturates at all phases.

Inhibitory PRCs of model neurons and biological neurons saturate for increasing synaptic strengths. A, Model neuron potential traces for inhibitory conductance pulses of 500 msec duration and 1 nS (black), 10 nS (blue), 100 nS (green), and 1000 nS amplitude (red). The inputs occurred at phase 0.1 (left) and phase 0.8 (right). In bothpanels, the traces for the four different pulses were overlaid for comparison, and each trace was truncated at the onset of the first burst after the perturbation for clarity. B, Model neuron immediate PRCs for 500 msec pulses of different amplitudes. The color coding is the same as inA. The PRCs for 100 nS (green) and 1000 nS (red) are almost identical and fall on top of the 10 nS PRC (blue) at late phases. C, Model neuron membrane potential at the end of synaptic conductance pulses (top) and phase response (bottom) at phases 0.1–0.9 plotted against the stimulus amplitude. For increasing stimulus amplitude, the phase response saturates at all phases. This saturation occurs at a conductance too small to bring the membrane potential of the model neuron down to the synaptic reversal potential at −65 mV. D, PD neuron potential traces with synaptic conductance pulses of 500 msec duration generated with the dynamic clamp. The conductance amplitude is indicated next to eachtrace. The horizontalbarof the same color below each trace shows the synaptic reversal potential at −90 mV and the duration of the conductance injection. E, PRCs of a PD neuron in response to 500 msec conductance pulses of 10, 50, 200, and 500 nS. The color code is the same as in D. At early phases, the phase response is indistinguishable for the 200 and 500 nS injections, and, at late phases, it is the same for the 50, 200, and 500 nS pulses.
The contingent PRCs in response to the same inputs repeated in every cycle are virtually identical to the immediate PRCs shown in Figure2B and therefore show the same saturation (Fig.1C), and we found a similar saturation effect in the permanent PRCs constructed from later bursts (data not shown). This means that, for both single and for repeated stimulation, all inhibitory synaptic inputs above a certain strength have the same effect on bursting pacemaker neurons or, in other words, that the period of these oscillators is not sensitive to changes in synaptic input strength above that threshold strength.
A trivial mechanism by which the functional impact of an inhibitory synapse can saturate is if the synapse gets so strong that it clamps the membrane potential of the neuron to the synaptic reversal potential. In this eventuality, increasing the synapse strength beyond this point would not make any difference for the membrane potential during the pulse and, if the inputs last long enough, for the state of the underlying ion channels. Starting out with the same membrane potential and ion channel state, the neuron would go through the same voltage trajectory after such strong pulses, which means that the effect of these pulses on the following burst pattern would be identical. The saturation illustrated in Figure 2, B andC, however, occurs at membrane potentials that are still far from the synaptic reversal potential at −65 mV, as is shown in thetop panel of Figure 2C. This saturation must therefore be caused by a different mechanism. This question will be further explored in the following section.
To test whether phase response saturation also occurs in biological bursting pacemaker neurons, we used the dynamic clamp to inject artificial synaptic conductance pulses of different amplitudes into PD neurons in the STG of the lobster H. americanus (Sharp et al., 1993a,b). These neurons are part of the electrically coupled pacemaker kernel of the pyloric rhythm consisting of the two PD neurons and one anterior burster neuron, which depolarize synchronously (Harris-Warrick et al., 1992). The only feedback from the rest of the pyloric circuit to the pacemaker kernel comes from the LP neuron. We removed this feedback signal by hyperpolarizing the LP neuron below its synaptic release threshold. Then we used the dynamic clamp to construct an artificial synaptic conductance in a PD neuron. Figure2D shows PD membrane potential traces with synaptic conductance pulses of different amplitudes and 500 msec duration. The corresponding immediate PRCs from the biological PD neuron are shown in Figure 2E. These exhibit qualitatively the same saturation as the model neuron PRCs in Figure 2B. As the conductance was increased from 10 nS (black) through 50 nS (blue), 200 nS (green), and 500 nS (red), the phase response initially increased but then stayed the same even when the strength of the synaptic input was increased further. As in the simulation, this saturation was not attributable to mere clamping of the membrane potential to the synaptic reversal potential. This is obvious from the blue trace in Figure 2D and the blue PRC in Figure 2E. Whereas the membrane potential in thetrace was still far from the synaptic reversal indicated by the blue horizontal bar below the trace, the phase response at phase 0.8 was no smaller in this blue PRC than in thegreen and red PRCs for four times and 10 times stronger inhibition. We found phase response saturation considerably before the synaptic reversal potential was reached in all experiments in which the amplitude of inhibitory synaptic conductance pulses was varied while the pulse duration was held constant (n = 10).
Saturation mechanism
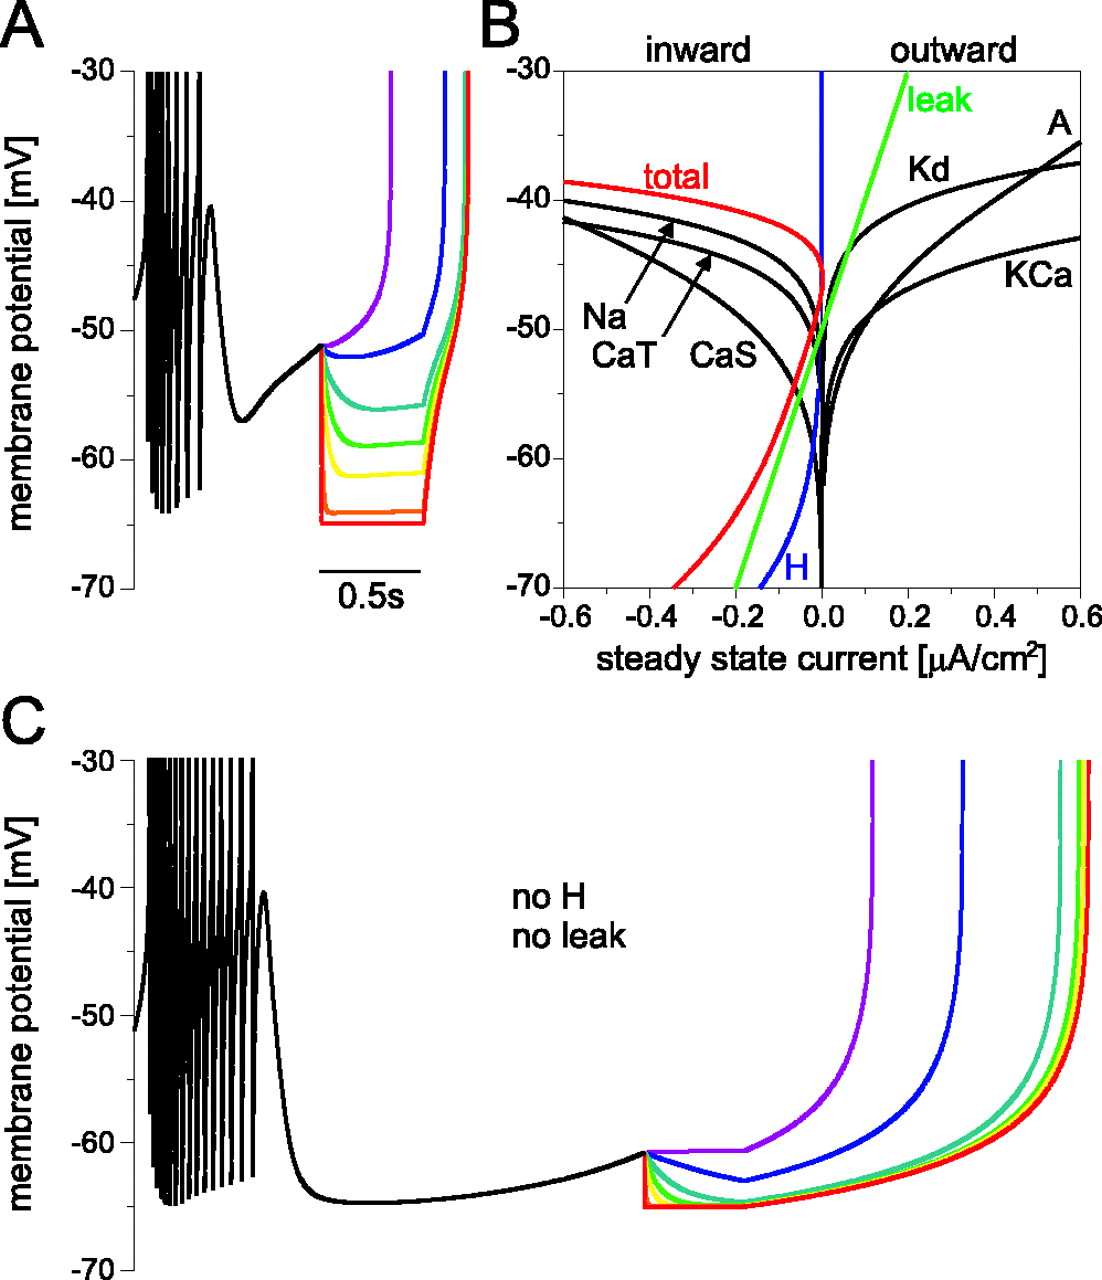
Figure 2C demonstrates the saturation of the phase response for increasing inhibitory synaptic conductance before the synaptic reversal potential is reached. To gain insight into potential mechanisms that could cause this saturation, we looked at the underlying ion currents of the model neuron (Liu et al., 1998). Figure3B shows all steady-state membrane currents of the model neuron and their sum, the total steady-state current of the bursting pacemaker model. These steady-state currents are an approximation of the membrane currents flowing immediately after the end of a synaptic conductance pulse that is long enough for most of the gating variables of the model to reach their steady state. The figure shows that the total current changes from inward to outward at −45 mV and back at −47 mV. At membrane potentials below −47 mV, the total steady-state membrane current is inward, and its amplitude increases as the membrane potential goes to more hyperpolarized values. This means that, the lower the membrane potential at the end of a synaptic conductance pulse, the more inward current is flowing and the faster the potential will return to more depolarized levels after the end of the pulse. This can also be seen in the voltage traces in Figure 3A, in which pulses that strongly hyperpolarize the membrane potential are followed by steep voltage trajectories. The initial slope after the end of the stimulus is (in mV/sec): 52 for 2 nS (blue trace), 66 for 5 nS (dark cyan), 90 for 10 nS (green), 112 for 20 nS (yellow), 144 for 100 nS (orange), and 154 for 1000 nS (red). Figure 2,A and B, suggests that it is the larger inward currents for more hyperpolarized membrane potentials that favor the convergence of the potential traces and therefore the saturation of the phase response.

Membrane currents underlying the phase response saturation for inhibitory inputs of increasing strength.A, Potential traces of the model neuron in response to inhibitory synaptic pulses of 500 msec duration and 1 nS (purple), 2 nS (blue), 5 nS (dark cyan), 10 nS (green), 20 nS (yellow), 100 nS (orange), and 1000 nS (red). The traces are overlaid for comparison and truncated at the peak of the first spike after stimulation onset for clarity. The more hyperpolarized the membrane potential is at the end of the stimulus, the steeper the trajectory after the end of the input. All conductances above 5 nS lead to the same time of first spike and therefore result in the same phase response. B, Model neuron steady-state membrane current densities. The hyperpolarization-activatedIH is shown in blue,Ileak in green, the total membrane current in red, and all other currents inblack. At membrane potentials below −50 mV, there is a net inward current whose amplitude increases for decreasing membrane potential. This is attributable to IH andIleak. C, Membrane potential traces of a model neuron without IH andIleak but with all other conductances identical to the values in A. The color code and time scale are the same as in A. Even tracesthat are very close to the synaptic reversal potential at −65 mV, like the greentrace for 10 nS and theyellowtrace for 20 nS, result in a time of first spike that is earlier than that of the redtrace for 1000 nS. The phase response thus does not saturate before the synaptic reversal potential is reached.
The inward current at potentials below approximately −50 mV is carried by the hyperpolarization-activated IHand by Ileak. If these two currents are in fact responsible for the phase response saturation described in the previous section, the saturation before reversal potential is reached should not be present in a neuron without these currents. Figure 3C shows voltage traces of the same model neuron as in Figure 3A but without IHand Ileak. In response to the same synaptic conductance pulses as in Figure 3A, this model burster also shows phase response saturation, which can be seen from the fact that the orange and red traces (for 100 and 1000 nS) exhibit indistinguishable first spike times after the stimulus. However, without IH andIleak, this saturation occurs only when the synaptic conductance is large enough to effectively clamp the membrane potential to the synaptic reversal potential at −65 mV. This is illustrated by the green and yellow traces in Figure 3C, which are very close to synaptic reversal at the end of the synaptic input but still result in first spikes that occur earlier than in the red trace for 1000 nS.
To investigate whether IH alone orIleak alone can produce phase response saturation away from the synaptic reversal potential, we performed additional simulations in which only one of the two candidate currents was removed from the otherwise unchanged model neuron. The fact that the model neuron is still bursting when either one of the two currents or both are removed indicates that neither of the currents is essential for the bursting pacemaker activity of the model. The presence of either of the two currents alone was sufficient for the saturation effect (data not shown), but saturation occurred at somewhat higher synaptic conductances and lower membrane potentials if onlyIH but notIleak was present, indicating thatIleak (at least at the maximal conductances we used in our model) is contributing more to the effect than IH.
How do the voltage dependence and dynamics ofIH andIleak affect their ability to cause phase response saturation? IH has a bell-shaped activation time constant with a maximum of almost 2 sec at −80 mV; in the voltage range relevant here, the time constant ranges from 0.43 sec at −50mV to 1.15 sec at −65 mV. To test whether these dynamics play a role in the ability ofIH to cause phase response saturation, we ran two more simulations of the model burster without leak current: one with the IH activation time constant fixed at 0.75 sec (which is the average value in the range from −50 mV to −65 mV) and one with an instantaneous version ofIH (data not shown). In both cases,IH produced saturation, indicating that the particular dynamics of the underlying current were not crucial for the effect. When the time constant was fixed at 0.75 sec, the saturation occurred at synaptic conductances and membrane potentials very similar to the ones in the simulation with the bell-shaped time constant, whereas the instantaneous IHproduced saturation at lower synaptic conductances and more depolarized membrane potentials, showing that instantaneousIH is more efficient at generating phase response saturation than IH with a slow activation time constant.
Another parameter one might expect to be critical for phase response saturation is the leak reversal potential, which in our model was at −50 mV. We varied the leak reversal potential in our bursting model without IH between −40 and −56 mV (the lowest leak reversal potential that allows bursting in our model) and simulated phase responses as in Figure 3 (data not shown). We found phase response saturation over the entire range of reversal potentials, but Ileak proved to be more efficient at generating saturation for more depolarized reversal potentials.
In summary, Figure 3 shows that the impact of any synaptic input on an oscillatory neuron saturates at some point if the synaptic conductance increases. In cells without effective inward currents at hyperpolarized potentials, this saturation occurs only when the synaptic conductance is large enough to clamp the membrane potential to the synaptic reversal potential, but, in neurons withIH orIleak (or currents with similar voltage dependence), functional saturation can already occur at synapse strengths much too weak to bring the membrane potential to synaptic reversal.
No PRC saturation for inhibitory inputs of increasing duration
Figure 4 explores the effect of inhibitory synaptic inputs of different durations on the period of the model oscillatory neuron. Stimuli at early phases whose duration is on the order of the interspike interval during the burst (∼20 msec) or shorter do not disrupt the ongoing burst (Fig. 4, black trace in A, black PRC in C). The effect of such short, early stimuli on the oscillator period is dependent on the exact timing of the stimulus onset with respect to the spikes within the burst and can change from advance to delay and back over a short phase range. At late phases, stimuli of such short duration cause only a small delay (Fig. 4, black trace inB, black PRC in C). As the duration is increased, the PRC with advances at early phases and delays at late phases emerges. If the stimulus duration is increased even further, the immediate PRC gets shifted to larger and larger delays at all phases (Fig. 4C,D). This finding is consistent with results from a previous study on a bursting model neuron (Demir et al., 1997). Not surprisingly, the traces in Figure 4,A and B, show that longer inhibitory pulses keep the model oscillator from bursting for a longer time, allowing it to return to more depolarized potentials only after the end of the stimulus. Unlike with the stimuli of different amplitudes described above, any increase in stimulus duration therefore results in an increased effect on the rhythmic pacemaker pattern.

PRCs in response to inhibitory inputs of increasing duration show no saturation. A, Model burster voltage traces with inhibitory synaptic conductance pulses of 100 nS amplitude and the durations given to the left of eachtrace. All inputs started at phase 0.1. The voltage and time scale are the same as in B. B, Overlaid voltage traces in response to the same inputs as inA, but delivered at phase 0.8. The tracesare truncated at the peak of the first spike after stimulus onset. The color code is the same as in A. C, Immediate PRCs for 5 msec (black), 50 msec (blue), 500 msec (green), and 1000 msec (red) stimulus duration. The longer the stimulus, the more the PRC is shifted toward larger delays. D, Phase response at phases between 0.1 and 0.9 plotted against the stimulus duration. The response saturates at none of the phases.E, PRCs recorded from a PD neuron using dynamic clamp generated conductance pulses of 100 nS amplitude and 200 msec (black), 500 msec (blue), and 1000 msec (green) duration. The phase response does not saturate for progressively longer stimulus duration.
Figure 4D shows that, after an initial nonlinear part, the plot of the phase response ΔP/Pagainst the stimulus duration becomes linear at all phases. In this linear range, any increase in stimulus duration simply adds to the delay of the following burst, because the state of the membrane at the end of the pulse (and thus the time it takes from there to the next burst) is similar over the entire range. For early phases, the stimulus starts during the burst, when all membrane currents other thanIH are active. Given the activation and inactivation time constants of these membrane currents, which are all around or below 300 msec in the relevant voltage range, one would expect the membrane state after the pulse to be similar for all stimulus durations above 300 msec. This is approximately where the linear range in Figure 4D starts for early phases.
The membrane potential at stimulus onset for late phases is between −50 and −60 mV (Fig. 1C), and the currents that contribute most to the total current in this range areIleak,ICaS, andIA (Fig. 3B). The leak current is instantaneous, and ICaS andIA deactivate with time constants between 20 and 40 msec in the relevant voltage range, which explains why the linear range in Figure 4D starts at fairly short stimulus durations for late phases.
In the previous section, we showed thatIH andIleak are primarily responsible for the repolarization of the membrane potential after the end of inhibitory synaptic conductance pulses. Whereas the activation ofIleak is voltage independent, the activation time constant of IH varies considerably in the voltage range relevant here. To ask whether the activation dynamics of IH are responsible for the duration sensitivity of the phase response at short inhibitory input durations, we simulated inhibitory synaptic conductance pulses of 100 nS amplitude and 1–100 msec duration in three different model bursters withoutIleak: the first containedIH with normal activation dynamics, the second had a fixed IH activation time constant of 0.75 sec, and, in the third,IH activated instantaneously. In all three models, the phase response sensitivity to inhibitory input durations between 1 and 100 msec was comparable (data not shown), leading us to the conclusion that the activation dynamics ofIH are not critical for the sensitivity of the model neuron to short inhibitory inputs.
Figure 4E shows immediate PRCs recorded from a PD neuron in the lobster stomatogastric ganglion with inhibitory conductance pulses of 100 nS amplitude and different durations. The phase responses of the biological neuron show the same behavior as the simulated PRCs of the model bursting pacemaker: for progressively longer stimulus durations, the immediate PRC gets shifted to larger and larger delays. We found all PD neurons that received artificial synaptic conductance pulses of varying duration to show this behavior (n = 12).
PRCs for excitatory inputs of increasing amplitude also saturate
Our finding that the effect of inhibitory inputs of increasing amplitude on the oscillator period saturates made us wonder whether a similar effect can also be seen for excitatory synaptic inputs. Figure5, A and B, shows simulated bursting pacemaker voltage traces with excitatory synaptic conductance pulses of 500 msec duration and different amplitudes at an early and a late phase in the ongoing rhythm. When the excitation arrives during the burst, it prolongs it and thereby delays the next burst. When it arrives during the hyperpolarized part of the bursting pacemaker waveform, it can advance the next burst by contributing to the preburst depolarization or can (if strong enough) trigger the next burst almost immediately. The resulting immediate PRCs are shown in Figure 5C; they show delays at early phases and advances at late phases.

Phase responses of model and biological neurons to excitatory synaptic inputs of different amplitudes. A, Model neuron potential traces with excitatory conductance pulses of 500 msec duration and the amplitudes indicated next to eachtrace. The excitation started at phase 0.2.B, Potential traces for excitatory conductance pulses at phase 0.7 in the model neuron. The color code is the same as inA. The four traces were overlaid, and each was truncated at the onset of the first burst after the start of the stimulation. C, Excitatory model neuron PRCs for inputs of different amplitude. The color code is the same as inA and B. D, Phase response at phases 0.1–0.9 plotted against the excitatory stimulus amplitude. At all phases, the response saturates at ∼10 nS. At early phases, the response decreases again at high conductances. E, Immediate PRCs of a PD neuron in response to excitatory dynamic clamp conductance pulses of 500 msec duration and amplitudes of 10 nS (black), 100 nS (blue), 500 nS (green), and 1000 nS (red).
As the amplitude of the excitatory synaptic input is increased, the PRC saturates just as in the inhibitory case (Fig. 2). This saturation is illustrated by Figure 5D, which shows the phase response at phases between 0.1 and 0.9 as a function of the stimulus amplitude. The response saturates at all phases, with the exception of very strong inputs at early phases, which show slightly less delay than inputs in the range between 10 and 100 nS. Inspection of the red tracefor 1000 nS in Figure 5A suggests that this is attributable to the vigorous spiking of the model neuron during very strong excitation. This massive activity leads to increased calcium influx into the model neuron, which in turn causes a lot of calcium-dependent potassium efflux, rapid hyperpolarization, and activation of rebound-promoting IH that contributes to a shortening of the interburst interval. Again, we found similar saturation effects in the contingent and permanent PRCs (data not shown), meaning that, for single as well as repeated excitatory synaptic inputs, all synapse strengths above a certain conductance will have similar effects on the burster period.
We used the dynamic clamp to inject excitatory synaptic conductance pulses into PD neurons and constructed immediate PRCs for different amplitude inputs. PRCs from one experiment are plotted in Figure5E and show qualitatively the same behavior as the simulated PRCs in Figure 5C. In all experiments in which the amplitude of excitatory synaptic conductance pulses was varied, we found that the phase response to inputs of increasing amplitude saturated over the entire phase range (n = 3).
Excitatory PRCs for inputs of increasing duration do not saturate
We also simulated PRCs for excitatory synaptic conductance pulses of different durations. Example traces at phase 0.2 and phase 0.7 are shown in Figure 6, A andB, and Figure 6C shows the corresponding immediate PRCs. At early phases, longer excitatory pulses lead to longer delays because they prolong the ongoing burst; the PRCs show no saturation in this phase range. Excitatory inputs arriving at late phases trigger the next burst almost instantaneously if they are more than a few milliseconds long, so the immediate PRCs are virtually identical at these late phases. Figure 6D shows the phase responses at phases between 0.1 and 0.9, plotted against the stimulus duration, and again illustrates that no saturation occurs at early phases, whereas the response is almost independent of the stimulus duration at late phases. The contingent PRCs for the same stimuli in every cycle are again virtually identical to the immediate PRCs shown in Figure 6D, so repeated stimulation with the same conductance pulse in every burst cycle also leads to nonsaturating period changes at early phases and almost duration-independent changes at late phases. However, the permanent PRCs that describe the long-term phase shift in response to a single excitatory stimulus of increasing duration are not duration independent at late phases. Instead, the longer the single input, the more the permanent PRC is shifted upward at late phases (data not shown). This shift happens because the duration of the stimulus adds to the shift of later bursts.

Excitatory PRCs of biological and model neurons for different input durations. A, Model neuron potential traces with excitatory synaptic conductance pulses of 100 nS amplitude and the durations given to the left of eachtrace. The conductance pulse arrived at phase 0.2 in all four traces. B, Overlaid model neuron traces in response to conductance pulses at phase 0.7. Thetraces are truncated at the peak of the first spike after stimulus onset for clarity. The 1 msec pulse (black) advances the next burst only slightly, but the 5 msec pulse (blue) is long enough to trigger a burst almost immediately after stimulus onset. So are the 500 msec (green) and 1000 msec pulses (red), which is why they fall on top of the blue trace and are not visible in this figure. C, PRCs for different excitatory stimulus durations. The color code is the same as in A. The PRCs show no saturation at early phases. At late phases, all immediate PRCs for stimuli above a few milliseconds duration are identical because they trigger a new burst right after stimulus onset.D, Phase response at phases between 0.1 and 0.9 plotted against stimulus duration. E, Excitatory PRCs recorded from a PD neuron in response to stimuli of 1000 nS amplitude and 10 msec (black), 100 msec (blue), 500 msec (green), and 750 msec (red) duration.
Experimental PRCs recorded from a PD neuron using excitatory conductance pulses of different durations are shown in Figure6E. As in the simulations, these immediate PRCs are almost identical at late phases. At early phases, the delays caused by the excitatory stimuli are larger for longer input pulses (n = 3).
Phase response saturation occurs at all stimulus durations
Figures 2 and 5 show that the impact of inhibitory and excitatory synaptic input of a fixed duration on the period of oscillatory neurons saturates as the synaptic conductance increases. Figure 7 demonstrates that this saturation is primarily independent of the stimulus duration. The four parts of the figure show the phase response of the model burster at early and late phases for excitatory and inhibitory stimuli, plotted against the stimulus duration and amplitude. In all cases, holding the input duration fixed and increasing the stimulus amplitude initially leads to larger phase responses, but, if the stimulus amplitude exceeds a certain conductance, the phase response saturates. This saturation occurs at higher conductances for short stimuli than for long stimuli, but it is present throughout the physiologically meaningful range of stimulus durations. In contrast, holding the stimulus amplitude fixed and changing the duration of the stimulus in most cases leads to a change in phase response. Thus, the period of a bursting neuronal pacemaker can be more reliably regulated via the duration of synaptic input to the pacemaker than via its strength. Changes in synapse strength will only be effective in changing the period of the neuronal oscillator if they occur in the range of weak synapse strengths below the saturation conductance.

Phase response at early and late phases to synaptic inputs of different amplitudes and durations.A, Three-dimensional plot of the phase response of the bursting model pacemaker to inhibitory synaptic conductance pulses of different amplitude and duration at phase 0.1. B, Response to the same pulses at phase 0.8. C,D, Phase response to excitatory pulses of different amplitude and duration at phase 0.2 (C) and phase 0.7 (D). All four plots use the same axis orientations and color code (indicated between thepanels). In all four cases and at all stimulus durations, the phase response to stimuli of increasing amplitude saturates.
Generalization to nonbursting neuronal oscillators
None of the mechanisms that lead to a saturation of the phase response to increasing synaptic input conductance described above is unique to bursting neurons. For example, the increasing inward current at hyperpolarized potentials that was identified as the reason for phase response saturation in Figure 3 is present in any neuron that contains currents active at hyperpolarized potentials. We therefore wondered if synaptic inputs of constant duration but increasing amplitude could lead to a similar saturation effect in nonbursting neurons. Figure 8 shows simulations of inhibitory synaptic inputs to a tonically spiking model neuron that, among other currents, contains IH andIleak; the parameters of all of the currents in the model are listed in Materials and Methods. Thetraces in A show that such inputs at early and late phases of the interspike interval can lead to the same timing of the next spike, even if they cause different and nonsaturating voltage deflections. This finding is also illustrated by the phase responses at phases between 0.1 and 0.9 that are plotted against the stimulus amplitude in Figure 8B. Consistent with previous studies, the inhibitory inputs to the tonically spiking model neuron produce delays at all phases (Perkel et al., 1964; Foss and Milton, 2000). In all of the curves in Figure 8B, the phase response saturates and does so even before the postsynaptic potential reaches the synaptic reversal potential at −70 mV. The lack of sensitivity of discharge frequency to different synapse strengths above a certain conductance may therefore be a widespread phenomenon that occurs in all oscillatory neurons with the appropriate membrane currents.

An example of phase response saturation for increasing synaptic conductance in a spiking model neuron.A, Simulated voltage traces from a tonically spiking model neuron in response to inhibitory synaptic conductance pulses of 20 msec duration and 1 nS (black), 10 nS (blue), 100 nS (green), and 1000 nS (red) amplitude. The inputs occurred at phase 0.1 (top) or phase 0.8 (bottom) after the spike. In each panel, the traces were overlaid for comparison and truncated at the peak of the first spike after the stimulus for clarity. B, Model spiker membrane potential at the end of the synaptic conductance pulse (top) and phase response at phases between 0.1 and 0.9 (bottom) plotted against the stimulus amplitude. The phase response of the spiking neuron to inputs of increasing conductance saturates at all phases, and this saturation occurs before the synaptic reversal potential at −70 mV is reached.
Discussion
In biological systems, there are numerous processes that vary synaptic strength. On rapid time scales, the impulse activity of the presynaptic neuron may result in facilitation and/or depression (Marder, 1998; Zucker and Regehr, 2002), either short term or long term. Neuromodulatory substances can alter synaptic strengths (Johnson and Harris-Warrick, 1990; Lessmann, 1998; Vogt and Regehr, 2001;Kamiya, 2002), and changes in synaptic strength occur during development. Despite the many biological mechanisms that can alter synaptic strength in virtually every nervous system studied, it is often more difficult to assess the consequences of these changes for the function of the networks in which they are occurring.
Indeed, the very difficulty of making the connection between changes in synaptic strength studied at the cellular level and changes in circuit dynamics and resulting behavior has reinforced the assumption, on the part of many, that all demonstrable changes in synaptic strength must be functionally significant. Here we show that the effect of altering the strength of a synaptic input to neural oscillators saturates. Beyond the saturation point, additional increases produce no additional changes in the dynamics of the oscillators receiving those inputs. This saturation occurs in both bursting pacemaker neurons and regularly spiking neurons.
Previous studies
In this work, we used PRCs as an assay for the functional strength of a synaptic input to an oscillator. PRCs for biological oscillators have been measured before with biological synaptic inputs (Pinsker, 1977a,b; Ayers and Selverston, 1979, 1984; Ayali and Harris-Warrick, 1999). Nonetheless, because in these previous studies the effects of a biological synapse were studied by depolarizing the presynaptic neuron or stimulating an afferent nerve, it was not possible to study systematically the effects of varying the amplitude of the synaptic conductance. In a previous study on a model of the bursting neuron R15 in Aplysia, PRCs in response to predefined synaptic transmitter waveforms of varying duration were simulated (Demir et al., 1997). In the same study, the effect of current pulses of different amplitude on the PRC of the model R15 neuron was explored, and a study on neuronal oscillators in the cardiac ganglion of the crab recorded experimental PRCs in response to excitatory and inhibitory current pulses of different amplitudes (Benson, 1979). In both cases, the general shape of the PRC was similar for all currents tested, with PRCs for significantly larger current pulse amplitudes only slightly shifted with respect to the PRCs for small currents. However, the significance of PRCs measured with current pulses rather than conductance changes to mimic synaptic inputs is hard to interpret. This is because the current flowing into a neuron through a synaptic conductance depends on the postsynaptic membrane potential, whereas a current pulse does not depend on the momentary state of the postsynaptic cell and can take the membrane potential to unrealistic values beyond the synaptic reversal potential. To our knowledge, our study therefore is the first to explore systematically the phase response of neuronal oscillators to synaptic inputs of varying strength.
Phase response saturation in the context of neuromodulation
The saturation of the phase response of neural oscillators for synaptic inputs of increasing strength has implications for the regulation of neural pacemaker period. A neuromodulatory substance that changes the strength of a feedback synapse onto a pacemaker can only effectively regulate the pacemaker period if the synapse strength is below the saturation threshold. In contrast, neuromodulators that alter the duration of the synaptic signal to a pacemaker can more reliably influence the period of a biological rhythm regardless of the strength of the synapse. Such modulators are frequently found in the stomatogastric ganglion (Hooper and Marder, 1987; Weimann et al., 1997).
The insensitivity of neuronal pacemaker period to increases of synaptic input strength beyond the saturation conductance could serve to prevent overmodulation of the pacemaker period. Like all cellular and synaptic components of neural networks, feedback synapses to pacemakers are potentially targeted by multiple neuromodulators (Johnson et al., 1994;Johnson and Harris-Warrick, 1997). The saturation effect we describe effectively puts a ceiling on the period change that a single modulator or a combination of modulators can cause by regulating the strength of the feedback synapse. In that sense, saturation of the functional impact of increasing synapse strength could serve to promote robustness of the pacemaker output in the face of multiple modulatory influences.
In the STG, a number of different neuromodulators can activate the same low-threshold inward current in neurons of the pyloric pattern-generating circuit (Swensen and Marder, 2000). This current is active in the voltage range relevant for repolarization after inhibitory synaptic inputs and could thus potentially act as a third contributor to the total inward current established byIH andIleak in this range. We showed that the total inward current at hyperpolarized potential is responsible for saturation of the phase response to inhibitory inputs of progressively larger amplitude. We therefore speculate that neuromodulators, by activating this additional inward current, could affect the threshold synaptic conductance beyond which the phase response saturates and thus the sensitivity of the neural oscillator to changes in synaptic input strength.
The role of input duration
The sensitivity of the firing or bursting pattern of neuronal oscillators to the duration of synaptic inputs demonstrated by our results is consistent with the findings of a recent study on synchronization of bursting neurons by mutual inhibition (Elson et al., 2002). This study shows that the synaptic time constant and therefore the duration of synaptic inputs to neural oscillators can be a crucial determinant for the phase relationship and period of coupled oscillators in a mutually inhibitory circuit.
Figure 4 indicates why the phase response of our model oscillatory neuron to inhibitory inputs of sufficient strength is sensitive to the stimulus duration. The membrane potential remains hyperpolarized for the entire duration of the pulse, and the depolarization leading up to the next burst starts only after the end of the inhibition. Thus the duration of the inhibitory pulse determines the delay of the following burst. In mutually inhibitory networks, this mode of oscillation is called “release” as opposed to the “escape” mode in which the rebound mechanism of the oscillator is strong enough to overcome the ongoing synaptic inhibition and initiate the next burst, which in turn inhibits the source of the input and thus terminates the inhibition (Wang and Rinzel, 1992; Skinner et al., 1994). In the release mode, stable pacemaker activity is most likely in a configuration in which the source of inhibition is itself an endogenous oscillator whose burst termination mechanism limits the duration of inhibition (Skinner et al., 1994). An example for a biological pacemaker circuit that appears to be operating in release mode is the swimming central pattern generator in the marine mollusk Clione limacina (Marder and Calabrese, 1996; Arshavsky et al., 1998).
One of the currents identified in Figure 3 as underlying phase response saturation before the membrane potential is brought to the synaptic reversal potential, IH, has been shown recently to support duration sensitivity in model neurons because of its slow dynamics (Hooper et al., 2002). Thus, this current enhances duration sensitivity by two different mechanisms.
Implications for network function
Phase response saturation in the model neuron suggests that this saturation phenomenon is not unique to bursting pacemaker neurons but can occur in any periodic neuron with the appropriate inward current at hyperpolarized membrane potentials. This includes a wide class of nerve cells, among them vertebrate neurons that receive their synaptic inputs from thousands of presynaptic neurons rather than from one or a few neurons as is typical for pacemakers in invertebrate motor systems. Taken at face value, our results would predict that a vertebrate neuron that receives a large number of input synapses might be less sensitive to increases in the number of inputs if these are simultaneous but very sensitive to changes in the number of inputs if these are temporally spaced. Similarly, our findings support the prediction by S. Oprisan, V. Thirumalai, and C. C. Canavier (unpublished observations) that the effect of multiple strong inhibitory pulses that arrive at an oscillator at the same time will be no larger than the effect of one such input alone.
A remark on synaptic plasticity
Another implication that follows from our results concerns the functional significance of changes in synaptic strength caused by short- or long-term facilitation and depression. Our simulations and experiments suggest that increases or decreases in the strength of a subset of synapses onto a neuron will not necessarily translate into changes in the firing pattern of that neuron. If the total synaptic input is strong enough to exceed the saturation conductance, increasing that strength even further or decreasing it without falling below the saturation threshold will not modify the functional impact of the input signals on the discharge timing of the postsynaptic neuron. Activity-dependent or modulatory changes in the temporal dynamics of postsynaptic conductance transients that result in a change in the duration of IPSPs or EPSPs, however, would in most cases be effective in modifying the timing of postsynaptic spikes or bursts.
Taken together, our finding of an insensitivity of oscillatory neurons to changes in synapse strength above a saturation threshold imply that the demonstration of activity-dependent or modulatory modifications of synaptic efficacy may not always be sufficient to prove actual functional changes in the impact of a synaptic input on the firing of the postsynaptic neuron and the network output. Rather, the activity patterns generated by neural networks are a result of interactions between the synaptic and the cellular components of a network. Activity-dependent or modulator-induced changes in neural network output can therefore not necessarily be understood by examining either synaptic or cellular components alone.
Footnotes
This work was supported by Deutsche Forschungsgemeinschaft Grant PR 649/1-1 and National Institute of Mental Health Grant MH46742.
Correspondence should be addressed to Dr. Astrid Prinz, Volen Center MS013, Brandeis University, 415 South Street, Waltham, MA 02454-9110. E-mail: prinz{at}brandeis.edu.


