

Abstract
In the immature retina, correlated spontaneous activity in the form of propagating waves is thought to be necessary for the refinement of connections between the retina and its targets. The continued presence of this activity in the mature retina would interfere with the transmission of information about the visual scene. The mechanisms responsible for the disappearance of retinal waves are not well understood, but one hypothesis is that visual experience is important. To test this hypothesis, we monitored the developmental changes in spontaneous retinal activity of both normal mice and mice reared in the dark. Using multi-electrode array recordings, we found that retinal waves in normally reared mice are present at postnatal day (P) 9 and begin to break down shortly after eye opening, around P15. By P21, waves have disappeared, and synchronous firing is comparable with that observed in the adult (6 weeks). In mice raised in the dark, we found a similar time course for the disappearance of waves. However, at P15, dark-reared retinas occasionally showed abnormally long periods of relative inactivity, not seen in controls. Apart from this quiescence, we found no striking differences between the patterns of spontaneous retinal activity from normal and dark-reared mice. We therefore suggest that visual experience is not required for the loss of synchronous spontaneous activity.
- retinal waves
- retinal development
- activity-dependent development
- spontaneous activity
- dark-rearing
- multi-electrode array
Introduction
Throughout much of the nervous system, spontaneously generated neural activity plays an essential role in the development of connectivity (Katz and Shatz, 1996; O'Donovan, 1999; Wong and Lichtman, 2003). A well studied example of how activity shapes connectivity patterns is the pathway from the retina to its visual targets in the brain. Axonal projections of retinal ganglion cells (RGCs) undergo substantial structural remodeling to attain their adult patterns of connectivity. First, axons from the two eyes, which initially overlap, segregate to innervate distinct regions of the dorsal lateral geniculate nucleus (dLGN), a major target of RGCs (Sretavan and Shatz, 1986). Next, individual dLGN neurons maintain connections with several RGCs that are either exclusively ON center or OFF center (Stryker and Zahs, 1983). Finally, each dLGN neuron retains inputs from a few (one to three) RGCs that determine its mature receptive field (Chen and Regehr, 2000; Tavazoie and Reid, 2000). Both eye-specific and ON–OFF segregation require retinal activity (Cramer and Sur, 1997; Penn et al., 1998; Rossi et al., 2001; Muir-Robinson et al., 2002). This activity, generated before phototransduction is possible, occurs as propagating waves that synchronize bursts of action potentials in neighboring RGCs (Meister et al., 1991) and provides the dLGN with sufficient information for both eye-specific and ON–OFF segregation (Wong and Oakley, 1996; Eglen, 1999; Wong, 1999; Butts and Rokhsar, 2001; Sernagor et al., 2001; Lee et al., 2002; Stellwagen and Shatz, 2002).
As the maturing retina becomes visually responsive, however, the continued presence of waves would interfere with the transmission of information about the visual scene. It is not surprising then that in ferret, waves disappear around eye opening (Wong et al., 1993). Although much effort has been focused on uncovering the mechanisms underlying waves, relatively little attention has been paid to the mechanisms responsible for their disappearance; however, evidence suggests that visual experience itself may play a role. RGCs from dark-reared turtles reveal elevated spontaneous activity and more frequent bursting when compared with RGCs from age-matched controls (Sernagor and Grzywacz, 1996). Also, visual deprivation maintains synchronized bursting activity in turtles at ages during which it has disappeared in controls (Sernagor and Mehta, 2001). Furthermore, rhythmic bursting activity resumes in taurine-deficient cats that lack photoreceptors (for review, see Sernagor et al., 2001).
Our present study had two major aims. First, we determined when waves disappear. We characterized changes in spontaneous activity patterns as a function of development in the mouse, where the wide availability of transgenic and mutant animals makes it an ideal model system. Second, we sought to investigate what role, if any, visual experience plays in dismantling the waves. In brief, we found that waves disappear within a week of eye opening and that this time course is unaltered by dark-rearing.
Materials and Methods
Tissue preparation. Retinas were dissected from C57BL/6 mice (Jackson Laboratory, Bar Harbor, ME) at ages ranging from postnatal day (P) 9 to 6 weeks (P42–48). Mice reared in a normal, 12 hr light/dark schedule were dark adapted for 2–4 hr before dissection. Dark-reared mice were kept in complete darkness from birth in a ventilated, light-tight chamber and were inspected daily using infrared (IR) night-vision goggles (ITT Industries Night Vision, Roanoke, VA) and IR illumination. All dissections were performed in a light-tight, completely darkened room under IR illumination using the goggles or microscope-mounted infrared converters (B. E. Meyers, Redmond, WA). Mice were anesthetized with 5% halothane and then decapitated. Each eye was quickly removed from the head, the cornea was punctured with a 30 gauge needle, and the eye was placed in cooled, oxygenated artificial CSF (ACSF) containing (in mm): 119 NaCl, 2.5 KCl, 1.3 MgCl2, 2.5 CaCl2, 1.0 NaH2PO4, 11 glucose, and 20 HEPES. The cornea, lens, and vitreous humor were removed, and retinas were carefully dissected from the eye cup. Dissected retinas were cut into a 4–10 mm2 rectangle that typically contained the optic nerve head to distinguish central from peripheral retina. The total number of retinas and animals examined at each age is given in Table 1.
Multi-electrode array recordings. The multi-electrode arrays (Multi-Channel Systems, Tübingen, Germany) that were used had 60 electrodes arranged in an 8 × 8 square grid without electrodes at the four corners. Electrodes were spaced 100 μm apart and were 10 μm in diameter. A glass ring attached to the planar array with Sylgard (Dow Corning, Midland, MI) served as a chamber for the retinal explants. The retina was transferred to an array chamber and oriented ganglion cell side down, with only the peripheral half of the retina in contact with the electrodes. The array covered a square area of ∼0.5 mm2, which was 5–13% of the total area of the piece of tissue. ACSF was rapidly drained from the array chamber to flatten the retina onto the electrodes. The retina was covered by a 25–50 mm2 square piece of tissue culture membrane (Corning Inc. Life Sciences; Acton, MA) that was held in place with a platinum ring, and the chamber was refilled with ACSF. Retinas were left on the array for at least 1 hr before recording, because the amplitude of the recorded spikes usually improved with time. Tissue was superfused continuously with oxygenated ACSF at a rate of 1 ml/min. The temperature of the bath was maintained at 31–33°C. Most recordings lasted 1–2 hr, and all were performed in complete darkness.
Signals were bandpass filtered between 100 and 3000 Hz, and digitized at a rate of 20 kHz. Thresholds above baseline noise levels were set manually on each channel. In general, RGC somatic spikes were biphasic, with a larger initial negative phase; therefore, negative triggers were used in virtually every case. With a few exceptions, only spike cutouts, comprising 1 msec preceding and 2 msec after a trigger event, along with a time stamp of the event were written to hard disk. After recording, the position of the tissue on the array was verified on the dissecting microscope.
Spike sorting and data analysis. Typically, spike cutouts from more than one cell were recorded on a single electrode. For each electrode, these spike cutouts were sorted into trains of a single cell after recording using Offline Sorter (Plexon, Denton, TX) as reported previously (Tian and Copenhagen, 2001). If the waveform for a particular sorted spike train was triphasic, with an initial, positive-going phase, the train was assumed to be an axonal spike (Meister et al., 1994) and was rejected. Data analysis and display were performed using either Neuroexplorer (Plexon) or custom software written in R (Ihaka and Gentleman, 1996). Cells were assigned the position of the electrode on which they were recorded. In only one case was the same cell detected on two electrodes, and this cell was assigned the average position of the two electrodes.
The firing rate of a cell was estimated by counting the number of spikes in a fixed time window (either 0.5 sec or 1 sec bins). Population firing rates were calculated as the average firing rate of all cells. The center of mass of activity for a given time window (Sernagor et al., 2000) was calculated by vector averaging the positions of all cells with firing rates that exceeded a threshold of 2 Hz for that time window. The correlation index between a pair of cells was computed as before (Wong et al., 1993). Briefly, we counted the number of spikes in the first train that fell within a time window, Δt, of each spike in the other train, and then normalized by the number of spikes predicted by a Poisson distribution parameterized by the mean firing rate of the first train. Exponential fits of correlation index versus intercellular distance were then calculated using least-squares minimization. Intercellular distance was not corrected for developmental expansion of the retina because this growth is modest across the ages studied (Wulle and Schnitzer, 1989). The cross-correlation function of a pair of spike trains was computed using standard procedures (Perkel et al., 1967). The difference in spike times from the reference cell to the target cell was calculated and binned into a histogram (bin size 0.1 sec). Each histogram bin was normalized into spikes per second by dividing by (N × 0.1 sec), where N is the number of spikes in the reference train. The autocorrelation was calculated similarly by comparing each train with itself, but ignoring self counts (comparing a spike with itself).
Burst duration for a particular cell was estimated by finding the full-width at half-maximum of its spike train autocorrelogram (15 msec bin width). The interwave interval was determined by finding local peaks in the population firing rate and measuring the time between adjacent peaks. To find peaks, the population firing rate was first smoothed using an exponential filter y(t) = α × y(t − 1) + (1 − α) × x(t), where x(t) is the mean firing rate, y(t) is the smoothed version; α = 0.9 controls the degree of smoothing. The Loess filter (f = 0.67) was then used to produce a running average of the firing rate (Cleveland, 1979). This running average was multiplied by 1.5 and used as a threshold; peaks were defined as the maximum point between two successive crossings of the smoothed tracey(t) with the running average. This method was sufficient to find >90% of the peaks that were independently selected by eye. To test whether spike trains were Poisson, we calculated the Fano factor (Dayan and Abbott, 2001). This is defined as the variance to mean ratio of spikes counted in bins of fixed duration (1 sec in our analysis). For a homogeneous Poisson process, the Fano factor is 1.
Results
Changing spike patterns with development
Spontaneous activity was detected in the mouse retina at all ages studied (P9 to 6 weeks). Spike trains from one to three cells were often recorded at each electrode site, resulting in the simultaneous recording of up to 80 cells within a retinal preparation. Comparison of the temporal and spatial structures of the spike trains across ages suggested that the overall patterns of activity were altered during development. Most apparent is that at early ages, we observed propagating waves of activity (P9) that became more sluggish (P15) before disappearing by adulthood. In the following sections, we discuss the temporal and spatial structure of this activity in detail.
Temporal patterns of activity
Figure 1 provides examples of spike trains from individual cells across the ages we studied. At P9, several days before eye-opening (P12–14), individual cells fired action potentials in bursts. These bursts generally lasted no more than 2 sec and occurred periodically. As in the ferret retina (Meister et al., 1991), cells across the array fired action potentials within a few seconds of each other. Nearly every cell participated in each synchronized burst. Synchronized, rhythmic bursting activity was still present at P11, but bursts appeared more frequently at this age, as noted previously (Muir-Robinson et al., 2002). In contrast to P9, not all cells at P11 participated in each burst (Fig. 1, P11). At both P9 and P11, cells rarely fired between bursts.
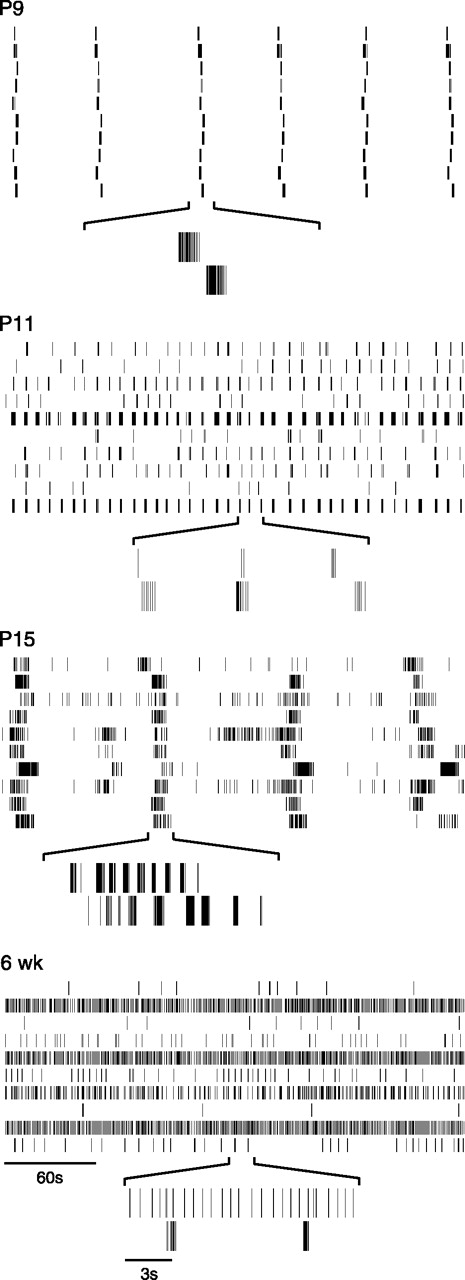
Representative spike trains recorded at different ages. At each age, spike trains from 10 simultaneously recorded cells are shown for 5 min of recording. Underneath, 15 sec expansions of the two bottom spike trains are shown.
After eye opening, at P15, periodic bursting persisted (Fig. 1,P15). However, in contrast to P9 and P11 retinas, the duration of each bursting episode was sustained for much longer, typically lasting 10–20 sec. Within one of these bursting episodes, firing was not sustained, but rather was organized into a series of shorter bursts. Furthermore, unlike P9 or P11, many cells in P15 retinas were active between the bursting episodes. By 6 weeks of age, periodic activity was no longer evident on the time scale of seconds to minutes. Also, RGCs had developed distinct temporal firing patterns. For example, cells fired either almost continuously or sporadically (Fig. 1, compare the bottom two spike trains at 6 weeks). The developmental loss of rhythmic activity, synchronized across the recorded population of cells, is clearly evident in the population firing rate over time (Fig.2A). Sustained elevations in firing rate, punctuated by periods with little or no activity, were seen in immature retinas (P9–15). In older retinas (P21–6 weeks), however, there were few, if any, sustained elevations; instead the firing rate of the population fluctuated rapidly from second to second (Fig. 2A).

Changes in mean firing rate during postnatal development. A, Population firing rate of all cells (P9,n = 29 cells; P11, n = 35; P15,n = 39; P21, n = 20; 6 weeks,n = 38) from one retina at each age over 180 sec in 1 sec bins. B, Histograms of the distribution of mean firing rates of individual cells. Cells from different retinas at each age have been pooled. Each mean firing rate is binned into 0.2 Hz increments from 0 to 2 Hz, except for the last bin (coloredgray), which contains all firing rates between 2 Hz and the maximum value for that age. Error bars denote 1 SEM.Arrows indicate mean firing rate for each age with the numerical value shown in parentheses.
We next quantified the temporal spiking properties of the recorded populations of cells (Fig. 2B, Table1). Mean firing rate increased from 0.3 Hz at P9 up to 2.4 Hz by 6 weeks. Furthermore, the increasing heterogeneity of spike trains with maturation seen in the rasters (Fig.1) is reflected in the distributions of mean firing rates at each age studied (Fig. 2B). Between P9 and P13, most cells had mean firing rates <0.5 Hz. With maturation (P15–6 weeks), cells fired at a much broader range of rates (Fig. 2B, Table 1). Comparison of the full-width at half-maximum of the autocorrelograms of cells recorded at each age suggests that the relative burst durations decreased with age (Table 1). In addition, we found that the Fano factor was always greater than 1, indicating that the spike trains at all ages were non-Poisson (Table 1). The decrease in Fano factor with age, however, shows that the spike trains become less regular with development.
Properties of spontaneously generated spike trains during development
Spatial patterns of activity
Simultaneous recording from many cells enabled us to determine the spatial patterns of spike activity and to follow their changes with development. At P9, spike activity propagates across the array in the form of a wave (Fig. 3). As seen in mice (Bansal et al., 2000) and other vertebrates (Meister et al., 1991; Wong et al., 1998; Zhou and Zhao, 2000), these waves can propagate in any direction. By P11, waves were still present; however, as noted previously (Muir-Robinson et al., 2002), the waves at this age occurred more frequently and propagated more rapidly than at P9 (Table 1). In contrast, at P15, although neighboring cells tended to fire together, the activity propagated far more slowly across the array, if at all (Fig. 3). By 3 and 6 weeks, the waves had disappeared, and there was no easily discernable spatial pattern of activity.

Visualization of spontaneous activity across the retina at different ages. Each row shows 4 sec of activity (fromleft to right) at the given age. Eachframe shows the mean firing rate of each cell, averaged over 0.5 sec. Each circle represents one cell, with the radius of the circle proportional to its firing rate, subject to an upper limit of 20 Hz. The small open diamond indicates the center of mass of the active cells. Scale bar, 200 μm. See also accompanying movies (available on our website,www.jneurosci.org).
To characterize the spatial propagation of activity, we plotted the trajectories of the center of the mass of activity (Fig.4). At P9 and P11, waves propagated smoothly across the array, as evidenced by a roughly straight trajectory of the center of mass. However, at P15, the direction of propagation was ill defined. Although spiking usually began in a confined region within the array, propagation was slow across the array. Additionally, at P15, unlike younger retinas, no wave front was readily discernible. In some instances, neighboring cells were coactive in one region of the array, but the elevated activity failed to propagate to more distant cells (Fig. 4, P15, red trace). Finally, by 6 weeks, there was no consistent propagation of the center of mass, instead it fluctuated randomly across the array. Movies showing examples of the activity recorded across the arrays for the various ages are available at www.jneurosci.org.

Center of mass trajectories and cross-correlations of cells at different ages. Left, Center of mass trajectory plots. Small circles indicate the approximate position of all recorded cells, with filled circles showing cells that were active within ∼1 min of recording. Three cells are numbered as they are referred to in the cross-correlation plots. Scale bar: (in P9) 100 μm (and is the same for all center of mass plots). For P9–P15, separate waves are color-coded. Center of mass was estimated every 0.5 sec.Star indicates the starting point of the trajectory. Duration of waves is as follows: P9, 3.5 sec (black), 4.5 sec (red);P11, 3 sec (black), 2.5 sec (red); P15, 17.5 sec (black), 8.5 sec (red), 14 sec (green). At 6 weeks, the trajectory of the center of mass over 30 sec of typical activity is shown; waves were no longer present. On the right are the autocorrelation and cross-correlation plots for three cells that have been marked in the center of mass plot. Horizontal axes are in seconds, and vertical axes are in hertz. The first column shows the autocorrelation of the three cells for the entire recording (50–60 min). Thesecond column shows the cross-correlation of the spike trains from a pair of cells that occurred during the period represented by the black center of mass trajectories. The third column shows the cross-correlations for the same pairs of cells for the entire recording. Above each autocorrelation and cross-correlation plot are the numbers of the cell pairs. The cyan line indicates the expectation for independent Poisson spike trains based on the entire period of recording.
We next determined the correlation in firing between cells as a function of age. Examples of cross-correlograms for pairs of cells at different intercellular distances are shown in Figure 4 across ages. For P9–15, three cells lying along the trajectory of the wave were selected for the correlograms. Because waves were no longer present at 6 weeks, three cells with positions similar to those at younger ages were chosen. For cell pairs that are relatively close (1:2 and 2:3), the peak of the cross-correlogram was closer to zero time delay than for relatively distant pairs (1:3) (Fig. 4, middle columns). This is consistent with the delay in firing between two cells being proportional to the distance between the cells along the axis of wave propagation, as has been shown previously (Wong et al., 1993). In the P9–15 retinas, the cross-correlograms obtained from spike trains for the entire period of recording (Fig. 4, far right columns) were often broader and sometimes had more than one peak. These features suggest that the direction of propagation can vary from one wave to another. At 6 weeks, the cross-correlograms indicate that spiking is often asynchronous between cells, although on occasion, pairs of cells demonstrated synchronous firing within a short (50 msec) time window.
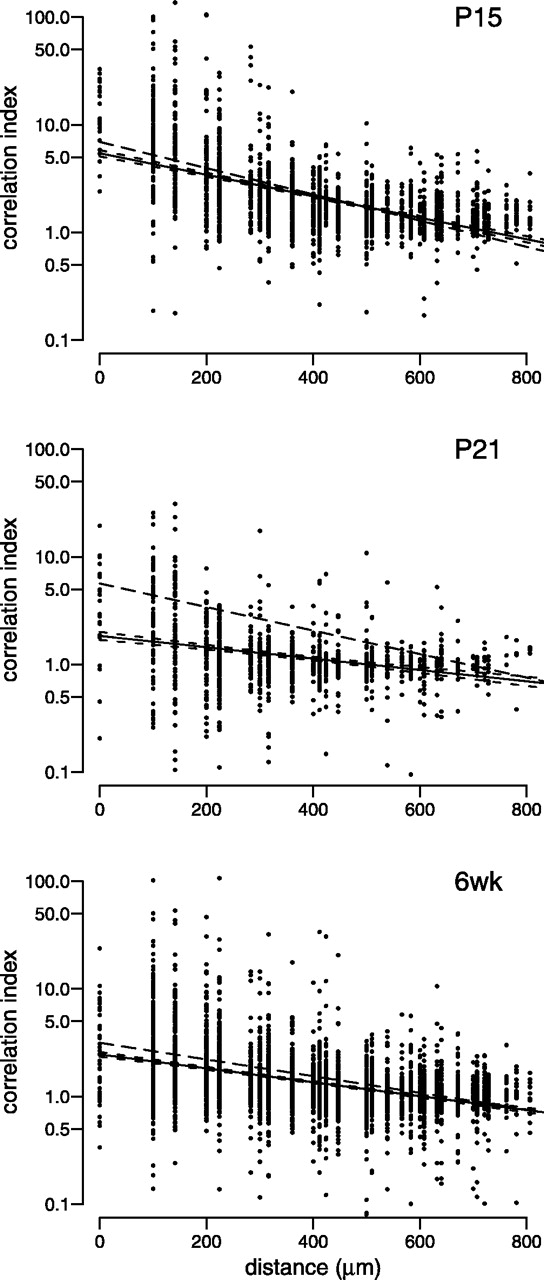
Figure 5 shows, at each age studied, a scatter plot of the correlation index between pairs of cells as a function of intercellular distance. For any two cells, the correlation index indicates how often the pair fires together (see Materials and Methods). For example, a correlation index of 10 would mean that a pair is 10 times more likely than chance to fire together within a given time window. A 50 msec time window was chosen because correlations on these time scales are sufficient for both eye-specific and ON–OFF segregation (Lee et al., 2002). The correlation index generally decreased with both maturation and the distance between cells (Fig. 5, Table 1). The fits indicated that the change with maturation was caused primarily by a decrease in the intercept, although the distance at half-maximum (the distance at which the correlation decreased by half of its maximum) also increased slightly with age. Although this loss of correlation during development was the dominant trend, even at more mature ages (P21 and 6 weeks) a few cells remained highly correlated in their spiking, with correlation indices above 50.

Correlation indices between pairs of cells change during development. For each pair of cells recorded, we plotted their correlation index as a function of the estimated distance separating the cells. Number of cell pairs and retinas at each age are as follows:P9 (790 cell pairs from n = 2 retinas), P11 (857 pairs, n = 5),P13 (1021 pairs, n = 3),P15 (3196 pairs, n = 4),P21 (3594 pairs, n = 4), 6 weeks (6wk) (1112 pairs, n = 4). Vertical axes are plotted on a logarithmic scale. At each age, we show least-squares fits of the data to an exponential decaying function (solid line). Dashed lines surrounding the solid line indicate the 95% confidence intervals of the fit.
Effects of dark-rearing
To evaluate whether visual experience plays a role in the maturation of the activity patterns, we compared the spontaneous retinal activity of mice that were raised under normal lighting conditions with that of mice reared in the dark. We examined the impact of dark-rearing at three ages: P15, P21, and 6 weeks. First, we assessed the effects of a brief period of visual deprivation (until P15) just after vision would have normally begun, primarily because of the abrupt changes in spontaneous activity patterns seen in controls at this age. The effects of intermediate periods of deprivation (until P21) were also examined because waves have disappeared in control animals, and retinogeniculate synapse elimination in the mouse is essentially complete by this age (Chen and Regehr, 2000). In addition, we also extended our dark-rearing studies to span across the critical period for ocular dominance plasticity in the cortex (until 6 weeks). This is because the effects of visual deprivation on cortical development and plasticity (Fagiolini et al., 1994; Guire et al., 1999; Lee and Nedivi, 2002) may arise from changes in the spontaneous activity patterns of the retina in visually deprived animals (Sernagor and Mehta, 2001).
Temporal patterns of activity
In P15 dark-reared mice, as in age-matched controls, periods of rhythmic bursting were present, but, unlike controls, they were occasionally interposed with long periods of quiescence. Figure6A provides examples of spike trains recorded from a dark-reared retina and an age-matched control at P15. To quantify the effect of visual deprivation, we measured the time difference between successive peaks in the population firing rate. Although the median values of the interwave intervals for control (91.5 sec) and dark rearing were similar (92.0 sec), the overall distributions were significantly different (p = 0.02; Kolmogorov–Smirnov test), presumably because the dark-reared distribution contained a few very long intervals not seen in the control distribution (Fig. 6, Table 1). This explanation is supported by two related measurements. First, only 3% (3 of 90) of intervals in control were >250 sec, compared with 15% (20 of 131) of intervals in dark-reared conditions. Second, the 95 percentile of the control distribution was 216 sec, compared with 393 sec for the dark-reared distribution.

Effect of dark-rearing on spike trains at P15.A, Typical spike trains recorded from control and dark-reared retinas at P15 over 30 min. The mean firing rate of the population of cells is shown underneath the spike trains.B, The intervals between successive peaks in the population firing rate. The intervals are shown separately for four control retinas and five dark-reared retinas. Horizontal line indicates mean interwave interval for each retina.
Spike patterns from P21 and 6-week-old dark-reared animals were qualitatively indistinguishable from their age-matched controls (Fig.7). We compared the distribution of mean firing rates of cells recorded in the dark-reared animals with their age-matched controls (Table 1). Although there was no significant difference (p = 0.26; Wilcoxon test) for brief deprivation (until P15), longer periods of deprivation (until P21 or 6 weeks) did show a significant difference (p < 0.001, p = 0.0033, respectively; Wilcoxon test) in the distribution of firing rates. However, for both P21 and 6 weeks, the difference was attributable to a single dark-reared retina (one of four retinas at P21; one of six retinas at 6 weeks). With these outliers removed, at either P21 or 6 weeks, the control and dark-reared firing rate distributions did not differ significantly (p = 0.97, p = 0.14, respectively; Wilcoxon test). We conclude that overall, dark-rearing has no consistently significant effect on RGC mean firing rate.
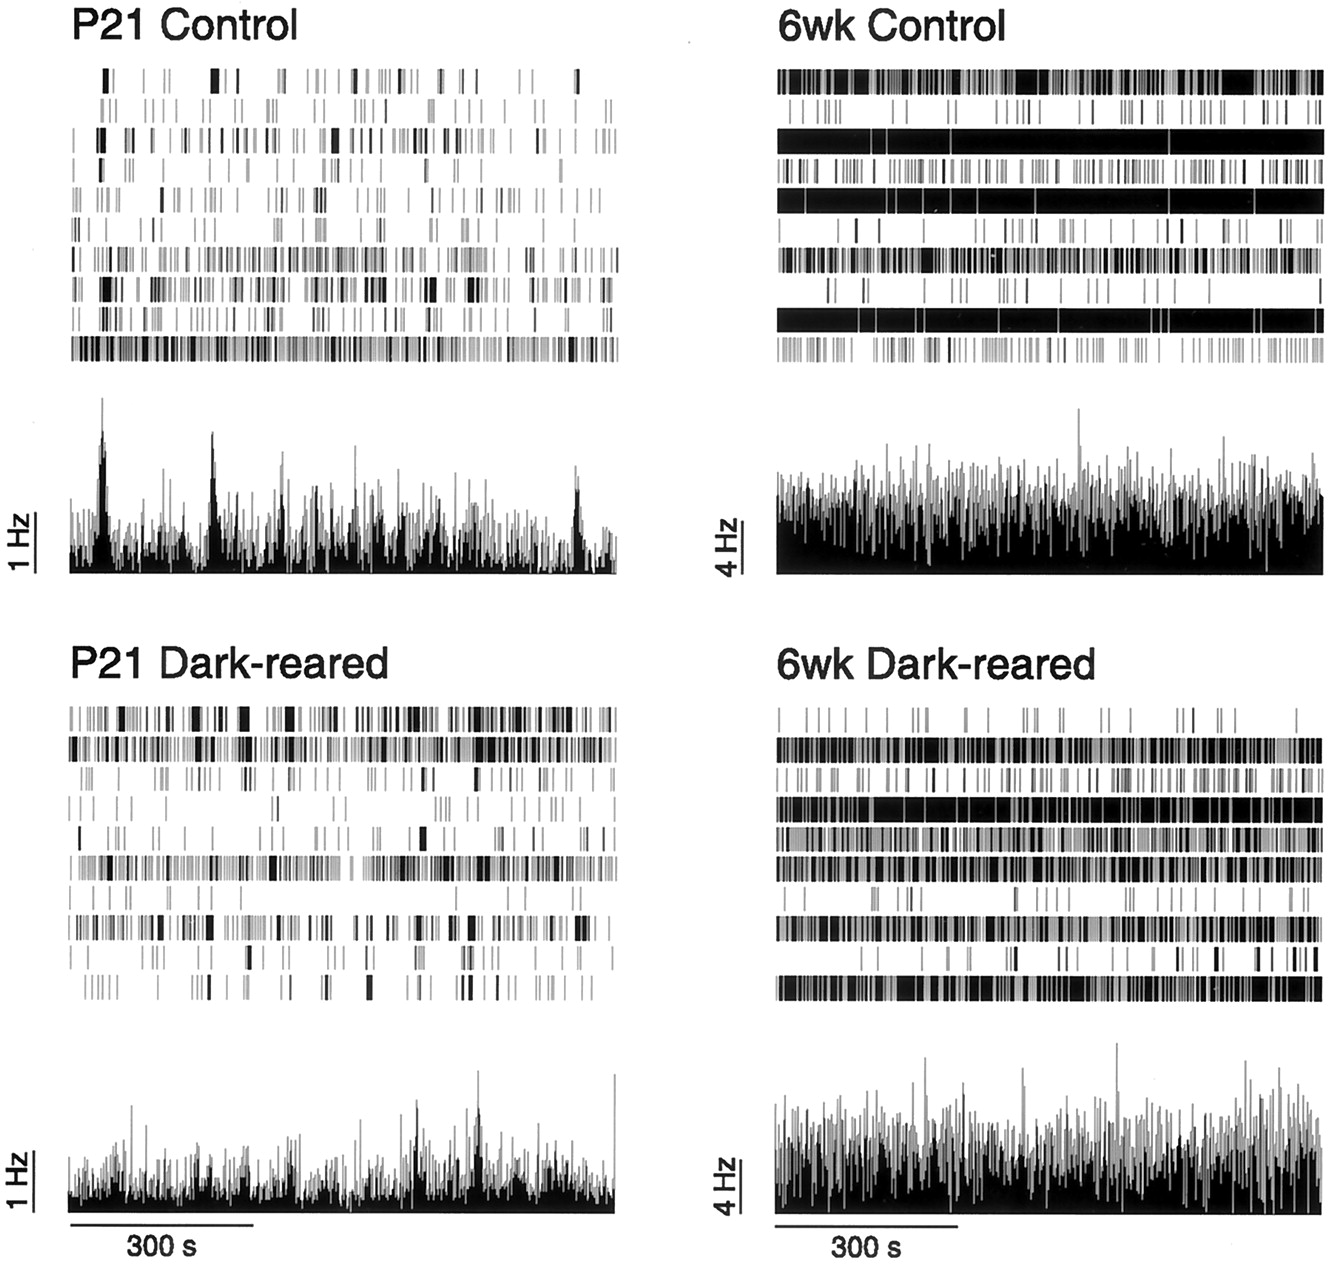
Typical spike trains recorded from control and dark-reared retinas at P21 and 6 weeks over 15 min. The mean firing rate of the population of cells is shown underneath the spike trains (same as Fig. 6).
Spatial patterns of activity
We next examined whether dark-rearing affected the spatial characteristics of the spiking activity across the recorded cells. Center of mass plots in Figure 8 indicate that at P15, as in controls, activity still propagated sluggishly across the array. Furthermore, waves disappeared by P21 in the dark-reared animals, as they did in control retinas. Correlation indices were also essentially unaltered by dark-rearing (Fig.9). The least-squares fits for the age-matched controls are above the 95% confidence interval for the least squares fits of the dark-reared data (Fig. 9, Table 1) and thus are significantly higher. A reduction in correlation index after dark-rearing would suggest that visual deprivation leads to a premature decrease in synchronous activity. However, these are relatively small differences: approximately an order of magnitude less than the developmental decline in correlation indices (Fig. 5, see correlation decrease between P9 and P15). This suggests that the developmental decrease in correlated firing is only modestly affected by dark-rearing. Thus, we believe that the small statistical differences in correlation indices between dark-reared and control retinas are unlikely to be biologically relevant.

Center of mass trajectories from dark-reared retinas (DR) at different ages. Conventions are the same as in Figure 4. At P15, two waves are shown. Duration of waves was 9.5 sec (solid line) and 22 sec (dotted line). At P21 and 6 weeks (6wk), the trajectory of the center of mass over 30 sec of typical activity is shown; waves were no longer present at these ages. Scale bar, 100 μm.
The effect of dark-rearing on the correlation index at different postnatal ages. Correlation indices plotted as for Figure 5. Number of cell pairs and retinas at each age are as follows:P15 (2078 cell pairs from n = 5 retinas), P21 (1267 pairs, n = 4), 6 weeks (6wk) (3613 pairs, n = 6). At each age, we show least-squares fits of the data to an exponential decaying function (solid line). Short dashed lines surrounding the solid line indicate the 95% confidence intervals of the fit. The means of the least-squares fit from the aged-matched control data (solid lines in Fig. 5) are plotted here in long dashed lines.
Discussion
Developmental changes in patterns of activity: functional implications
Our multi-electrode recordings reveal alterations in the patterns of spontaneous spiking activity during development of the mouse retina. The most prominent change is the loss of synchronized firing with maturation, as observed in ferret and chick (Wong et al., 1993, 1998). In the present study, a more detailed analysis of the activity patterns around eye opening showed that waves are still present after vision is possible, but waves at this age (P15) differ from those at early ages (P9–11) because they propagate much more slowly, if at all, and their wave-fronts are less well defined. This gradual restriction in the size of the region of coactive cells is also observed in the turtle retina, just before hatching (Sernagor and Mehta, 2001). These observations in mice and turtle suggest that the loss of synchronized activity with maturation occurs gradually.
Previous experimental and theoretical studies have implicated the patterns of synchronized activity in the refinement of retinal projections to their major targets (Willshaw and von der Malsburg, 1976; Maffei and Galli-Resta, 1990; Eglen, 1999; Lee et al., 2002;Stellwagen and Shatz, 2002) (for review, see Wong, 1999). The influence of spontaneous retinal activity on the segregation of eye inputs to the dLGN has been well documented for the mouse (Rossi et al., 2001;Muir-Robinson et al., 2002). This segregation process is essentially complete by P8 (Godemont et al., 1984), before the earliest age in our studies and before vision is possible. However, retinogeniculate connectivity continues to refine after eye opening, until around P23, during which time the number of RGCs contacting a single dLGN neuron reduces from ∼20 to 3 or less (Chen and Regehr, 2000). Reduction in convergence of RGCs to dLGN neurons after eye opening has also been observed in ferret (Tavazoie and Reid, 2000). Our finding that patterned spontaneous activity persists after eye opening raises the possibility that spontaneous activity continues to be important for refining retinal projections, although vision is possible at these ages. However, a recent study suggests that visual responses before eye opening also play a role in refinement. In ferret, dLGN neurons are visually responsive for >1 week before eye opening, and dark-rearing during this period results in an abnormal convergence of RGCs onto dLGN neurons (Akerman et al., 2002). On the other hand, dark-rearing cats until 6 months after birth does not alter the receptive field structure of dLGN neurons, at least not for X-cells (Mower et al., 1981b;Kratz, 1982), suggesting that convergence may be unaffected by prolonged deprivation. To determine the relative contribution of spontaneous versus visually evoked activity in determining the final convergence of RGCs onto dLGN neurons, it will be necessary to assess whether all or only a subset of dLGN cell types require visual experience for their receptive fields to mature fully. Also, it should be possible to clarify whether dark-rearing prevents receptive field maturation, or simply delays it, by examining dLGN receptive field structure after deprivation periods that extend far beyond eye opening.
Although waves disappear with maturation, we observed some RGC pairs in older retinas (P21, 6 weeks) that are still highly synchronized in their spontaneous activity, as observed in other species (Mastronarde, 1989; Brivanlou et al., 1998; DeVries, 1999). Cell pairs 0–500 μm apart were found with high correlational indices. This is consistent with earlier findings in both cat (Mastronarde, 1989) and rabbit (DeVries, 1999), in which small- and large-field RGCs exhibit synchronized spontaneous spiking.
Influence of visual experience on spontaneous spiking patterns
The anatomical and physiological influence of activity in the early visual system is restricted primarily to a brief period after the onset of vision, termed the critical period (for review, see Wiesel, 1982). The critical period is extended by dark-rearing (Cynader and Mitchell, 1980; Mower et al., 1981a). These early experiments suggested that patterned vision is important for regulating plasticity in higher visual centers. However, it is possible that dark-rearing alters the spatiotemporal properties of spontaneous activity in the retina and that this in turn may underlie the extended plasticity seen in higher visual areas that accompanies sensory deprivation. Our current multi-electrode recordings suggest that there are no large differences in the spike trains of control and dark-reared animals. Waves disappear by the same time in development, and the broad range of firing rates of RGCs after eye opening was unchanged by dark-rearing.
One subtle difference that we noted in P15 dark-reared retinas was the presence of longer periods of quiescence (Fig. 6). If dLGN neurons are still receiving binocular inputs, this could put one eye at a competitive disadvantage if it is quiet for long periods while the other eye is active. Because P15 dLGN neurons are already monocular (Godement et al., 1984), it is unlikely that long periods of quiescence will disrupt the development of retinogeniculate connections. An important caveat, however, is that activity is required to maintain ocular segregation in the ferret dLGN (Chapman, 2000), although whether a specific pattern of activity is required is unknown. Furthermore, it seems improbable that the quiescence would affect cortical ocular dominance given that visual deprivation does not retard the loss of waves at P21, 1 week before the height of the critical period (4 weeks) (Gordon and Stryker, 1996). We thus conclude that the effects of dark-rearing on cortical plasticity are unlikely to be caused by alterations in the pattern of synchronized spontaneous spiking activity from the developing retina.
Although our recordings indicate that the overall patterns of spontaneous spike activity of RGCs are unaffected by dark-rearing, other studies have suggested that visual experience regulates the maturation of RGC responses to light. Tian and Copenhagen (2001) showed that dark-rearing decreased the amplitude and increased the latency of RGC light responses. Furthermore, they reported that miniature EPSC (mEPSC) frequency was significantly reduced in dark-reared mice compared with controls (Tian and Copenhagen, 2001). These results suggest that there is a decrease in the net excitatory drive onto RGCs in dark-reared animals. Given that we did not detect significant changes in the spontaneous firing rates of RGCs in dark-reared animals, compensatory mechanisms may regulate spontaneous output from the RGCs. Because there are no changes in mEPSC amplitude in dark-reared animals, it is unlikely that synaptic scaling is the major regulatory mechanism (Tian and Copenhagen, 2001). Instead, homeostatic changes in neuronal excitability may be involved (Desai et al., 1999; Turrigiano, 1999).
Our finding that synchronized activity is reduced with maturation in both normal and dark-reared animals contrasts with observations in the turtle retina. Normally, correlated spontaneous bursting activity in the turtle retina disappears by 2–4 weeks after hatching. Dark-rearing turtles delays this disappearance (Sernagor and Mehta, 2001). The apparent differences in the importance of visual experience for the maturation of RGC spike patterns among species may be ethological. Vision may not be required for mouse survival in the first few postnatal weeks. By contrast, when marine turtles hatch, their survival is immediately dependent on visual navigation, which could necessitate a close relationship between the disappearance of waves and the onset of vision.
Mechanisms underlying desynchronization of activity
Our dark-rearing studies demonstrate that light-evoked activity is not required for the desynchronization of RGC activity with maturation. It remains possible, however, that the maturation of photoreceptors is involved and that spontaneous release of glutamate from photoreceptors is sufficient to drive RGC desynchronization. Assuming that glutamate release from neighboring photoreceptors is uncorrelated in the dark, an increase in drive from the vertical pathway would decorrelate RGCs, thus reducing, or perhaps masking, the lateral propagation of activity.
Several observations, however, suggest that it is not entirely the maturation of glutamate transmission from photoreceptors that is the key to the loss of waves. For example, the development of inhibition in the turtle retina was found to be a major factor in the loss of waves (E. Sernagor, C. Young, and S. J. Eglen, unpublished observations). It is not yet known how the vertical and lateral circuits act together to decouple the activity of RGCs, but our current findings suggest that the mechanisms responsible for this developmental event are not light dependent.
Footnotes
This work was supported by the National Science Foundation (J.D.), Wellcome Trust (S.J.E.), and the National Institutes of Health (R.O.L.W.). We thank Dr. Erik Herzog and Daniel Piatchek for their generous assistance in dark-rearing, and Drs. Timothy Holy and Leanne Godinho for useful comments on this manuscript.
Correspondence should be addressed to Rachel O. L. Wong, Department of Anatomy and Neurobiology, Washington University School of Medicine, 660 South Euclid, Box 8108, St. Louis, MO 63110. E-mail:wongr{at}pcg.wustl.edu.


