

Abstract
The macaque inferotemporal (IT) cortex, which serves as the storehouse of visual long-term memory, consists of two distinct but mutually interconnected areas: area TE (TE) and area 36 (A36). In the present study, we tested whether memory encoding is put forward at this stage, i.e., whether association between the representations of different but semantically linked objects proceeds forward from TE to A36. To address this question, we trained monkeys in a pair-association (PA) memory task, after which single-unit activities were recorded from TE and A36 during PA trials. Neurons in both areas showed stimulus-selective cue responses (347 in TE, 76 in A36; “cue-selective neurons”) that provided, at the population level, mnemonic linkage between the paired associates. The percentage of neurons in which responses to the paired associates were significantly (p < 0.01) correlated at the single-neuron level (“pair-coding neuron”) dramatically increased from TE (4.9% of the cue-selective neurons) to A36 (33%). The pair-coding neurons in A36 were further separable into Type1 (68%) and Type2 (32%) on the basis of their initial transient responses after cue stimulus presentation. Type1 neurons, but not Type2 neurons, began to encode association between paired stimuli as soon as they exhibited stimulus selectivity. Thus, the representation of long-term memory encoded by Type1 neurons in A36 is likely substantiated without feedback input from other higher centers. Therefore, we conclude that association between the representations of the paired associates proceeds forward at this critical step within IT cortex, suggesting selective convergence onto a single A36 neuron from two TE neurons that encode separate visual objects.
Introduction
Experimental and clinical studies of primates have shown that visual information is encoded in, and retrieved from, mnemonic storage through interactions between the visual association area and the polymodal limbic cortex (Scoville and Milner, 1957; Mishkin, 1982; Squire, 1987; Fuster, 1995; Miyashita and Hayashi, 2000). In nonhuman primates, the inferotemporal (IT) cortex has been proposed to be the neural substrate of visual long-term memory (Squire and Zola-Morgan, 1991; Miyashita, 1993, 2000; Mishkin et al., 1997; Rolls, 2000a). IT cortex contains two cytoarchitectonically distinct but mutually interconnected areas: area TE (TE) and area 36 (A36) (Suzuki and Amaral, 1994; Saleem and Tanaka, 1996) (see Fig.1A). TE is a unimodal neocortex and located at the final stage of the ventral visual pathway, which processes object vision (Tanaka, 1996; Janssen et al., 2000). On the other hand, A36 is a limbic polymodal association area and a component of the medial temporal lobe memory system, which is involved in the formation of declarative memory (Zola-Morgan and Squire, 1990; Murray and Bussey, 1999).
Previous electrophysiological studies, including those from our laboratory, have demonstrated the mnemonic functions of IT cortex specifically with respect to visual associative long-term memory (Miyashita, 1988; Sakai and Miyashita, 1991; Sobotka and Ringo, 1993;Naya et al., 1996; Booth and Rolls, 1998; Erickson and Desimone, 1999;Messinger et al., 2001). However, most of these studies either lumped the neuronal responses from the two subdivisions together or recorded the responses from only one of the subdivisions [but see Xian and Brown (1998) for recognition memory and Liu and Richmond (2000) for association of visual cue and reward expectation]. Consequently, it remains unsettled whether there is a difference between the two areas in the neuronal representation for associative memory processing that functionally substantiates the anatomical hierarchy of TE and A36 (see Fig. 1A) (Felleman and Van Essen, 1991; Squire and Zola-Morgan, 1991).
Previous lesion studies have revealed the differential effects of damage to TE and A36 (Buckley et al., 1997; Buffalo et al., 1999). The damage to A36 impairs recognition and associative memory more severely than the damage to TE, which is suggestive of hierarchical mnemonic processing. From the view point of information flow, hierarchical processing in the visual system has been characterized by the forward processing of receptive field organization from lower to higher areas, as well as by the backward processing, mostly modulatory, in the reverse direction (Zipser et al., 1996; Lamme et al., 1998; Rolls, 2000b). The aim of the present study was to characterize any differences between TE and A36 in mnemonic representation at the single neuron level and to explore whether this difference is the result of forward processing from TE to A36. We trained monkeys to perform a pair-association (PA) memory task (see Fig. 1B) and found that association between the representations of paired associates proceeds forward through the anatomical hierarchy of IT cortex.
Some of the present results have been reported previously in abstract form (Naya et al., 1999, 2000, 2002).
Materials and Methods
Subjects. The subjects were three adult monkeys (Macaca fuscata; 6.0–9.0 kg). Head bolts and a chamber for microelectrode recording were attached to the skull under aseptic conditions and general anesthesia with sodium pentobarbital (25 mg per kilogram of body weight per hour, i.v.). By referring to individual brain atlases constructed from magnetic resonance image (MRI), the recording chambers were positioned such that A36 and the ventral part of TE were readily accessible. The care and use of the animals conformed to the NIH Guide for the Care and Use of Laboratory Animals and the regulations of the National Institute for Physiological Sciences, Japan.
Behavioral task. The procedure for the PA task is described in detail elsewhere (Sakai and Miyashita, 1991; Naya et al., 1996,2001). In each trial, one cue stimulus and then two choice stimuli, i.e., the paired associate of the cue stimulus (target) and one from a different pair (distracter), were presented sequentially with a delay period in between (Fig.1B). The monkey was rewarded with fruit juice for touching the correct target. The duration of the cue period was 320 msec throughout the experiments; the duration of the delay period was 2.0 sec, although in the early phase of the experiment it was sometimes shorter (1.0–2.0 sec). The visual stimuli were 24 monochrome Fourier descriptors extending ∼5 × 5°. Eye movements were monitored with a PC-based CCD camera system (Naya et al., 2001). If the eye position deviated >1–1.5° from the center of the screen during the period from 500 msec before the cue onset to the end of the delay period, the trial was automatically terminated. All three monkeys responded correctly >90% of the time.

Anatomical hierarchy of the IT cortex and behavioral task. A, Schematic view representing the hierarchical level of IT cortex (gray box), which consists of two subdivisions with reciprocal connections: A36 in the limbic cortex (green box) and TE in the neocortex (red box). B, The PA task used to characterize the pair-coding response of A36 and TE neurons.Left, Twelve pairs of Fourier descriptors were used in the PA task. Right, Cue stimuli were presented at the center of a video monitor. Choice stimuli were presented randomly in two of four positions on the video monitor. One is the paired associate of the cue (Correct); the other is a distracter from a different pair (Error).
Electrophysiology. The procedure for single-unit recording is described in detail elsewhere (Higuchi and Miyashita, 1996; Naya et al., 1996). The activity of single neurons was recorded extracellularly from one hemisphere in each monkey using a glass-insulated tungsten microelectrode. The microelectrode was inserted vertically into the target region through the intact dura matter along a stainless steel guide tube using a hydraulic microdrive manipulator (Narishige, Tokyo, Japan). We recorded from the first well isolated neuron encountered in searching for the next neuron along each penetration of the microelectrode. Placement of the microelectrode into A36 and TE was guided by the individual brain atlases from MRI scans, and the location of each electrode track was determined using x-ray images.
Recording sites. After the experiments, the recording sites were histologically reconstructed using three or four electrolytic lesions and two or three injected dyes as markers. The border between TE and A36 was determined from the cytoarchitecture (Suzuki and Amaral, 1994; Saleem and Tanaka, 1996). There was a clear separation between layers V and VI in TE but not in A36, and layer II was thicker in TE than in A36.
A flat map of single units was constructed as described previously (Van Essen and Maunsell, 1980). The positions of the recorded neurons were projected onto layer IV of histological sections, and the arrays of the positions were aligned so that histological markers (e.g., border and sulcus) connected smoothly and so that the region of interest was aligned with minimum distortion.
Data analysis. The present study focused on neuronal responses during the cue period as some of our previous studies did (Sakai and Miyashita, 1991; Higuchi and Miyashita, 1996), whereas some of our previous studies focused on activities during the delay period (Sakai and Miyashita, 1991; Naya et al., 1996, 2001). The following data analyses were conducted for the neurons that exhibited responses to the cue presentation, which was confirmed by on-line rastergrams and an audio speaker. Stored data were analyzed off-line on a PC (NEC, LaVie) using MATLAB 6.1. We defined a cue response as the firing rate during the period extending from 60 to 320 msec after the cue onset; the first 60 msec was excluded to compensate for the minimum latency of visual responses in the temporal cortex (Xian and Brown, 1998; Liu and Richmond, 2000). The stimulus selectivity of cue responses for the 24 stimuli was evaluated by one-way ANOVA.
The pair-coding index (PCI) was defined using a correlation coefficient as in Higuchi and Miyashita (1996): PCI = Σ[(xi − μ)(xi′ − μ′)]/{[Σ (xi − μ)2][ Σ(xi′ − μ′)2]}1/2(i = 1–12), where xi denotes the mean cue response for the i-th stimulus (thei-th and i′-th pictures belong to a pair), μ and μ′ are the averages of xi andxi′ . The selectivity index (STI) was defined using an R2 statistic from the ANOVA table (Keppel and Zedeck, 1989; Erickson and Desimone, 1999): STI = Σmj (xj − μtot)2/Σ (xj,k − μtot)2(j = 1–12, 1′-12′; k = 1-mj ), wherexj,k denotes the cue response in thek-th trial for the j-th stimulus,xj is the mean cue response for thej-th stimulus, mj is total number of the trials for the j-th stimulus, and μtot is the average of the cue responses across the total trials. The tuning index (TNI) was defined using kurtosis (Miyashita, 1988; Lehky and Tanaka, 2001): TNI =E[(x − μ)4]/ς4, where x is the cue responses to each stimulus, μ is the average of x over all the stimuli, ς is the SD, andE(X) is the expected value ofX.
Spike trains were smoothed by convolution with a Gaussian kernel (ς = 10 msec) to obtain smoothed peristimulus time histograms (PSTHs). The smoothed PSTH is hereafter referred to as PSTH. The cue stimulus that exhibited the strongest cue responses is referred to as the cue-optimal stimulus. The trial in which the cue-optimal stimulus was presented as a cue stimulus is referred to as the optimal trial; the trial in which the paired associate of the cue-optimal stimulus was presented as a cue stimulus is referred to as the pair trial.
Response latency was determined for each neuron using the responses to the cue-optimal stimulus. The baseline activity was defined as the mean discharge rate during the 300 msec period just preceding the cue onset. The latency of the neuronal response was determined as the time azpoint when the PSTH in the optimal trials first exceeded +2 SD above baseline activity (MacPherson and Aldridge, 1979; Tomita et al., 1999).
The population-averaged PSTHs were calculated using normalized firing rates. We first calculated the mean firing rate of each neuron during the cue period in the optimal trials, after which the firing rate during each 1 msec bin was divided by that mean firing rate. The resultant normalized firing rates were then averaged across neurons and smoothed by convolution with a Gaussian kernel (ς = 10 msec). Because the normalization was conducted using the mean firing rate during the cue period, peak amplitude in the PSTH of the optimal trials exceeds the value of 1.0 (see Fig. 3A).
Early response index (ERI) was defined as (early response − late response)/(early response + late response), where “early response” was the mean firing rate during 60 msec immediately after the instant when the response in the optimal trial reached 50% of its peak from the baseline, and “late response” was the mean firing rate during the succeeding 200 msec. The early and late responses in the pair trials were calculated for each neuron using the same time windows as in the optimal trials. The half-peak time of the firing rate (HPT) of each neuron during the optimal and pair trials was defined as the period from the cue onset to the instant when the PSTH reached 50% of its peak rise from baseline. For each neuron, the “initial response vector,” y, was defined as a 1-by-2 row vector of ERI and HPT. Using the Mahalanobis distance (MD), we calculated a multivariate measure of the separation between the initial response vectors on the two-dimensional space (Flury and Riedwgl, 1983; Kitazawa et al., 1998). The MD between yl andym is defined as MDlm2 =t(yl −ym)V−1(yl −ym), where V is the sample covariance matrix. A hierarchical cluster tree was created by Ward linkage that uses the increase in the total within-group sum of squares as a result of joining neuronal groups (Ward, 1963). The within-group sum of squares of a cluster was defined as the sum of the squares of the MD between all the initial response vectors in the cluster and the centroid of the cluster. The clusters were automatically determined to minimize the incremental sum of squares.
The PCI and STI at time t from the cue onset [PCI(t) and STI(t), respectively] were defined for each neuron as follows. The mean discharge rate during the 50 msec window (Tovée et al., 1993) centered at the given time pointt for each stimulus was calculated asx(t)i(i = 1–12). This time window was stepped in 1 msec increments. PCI(t) was defined as the correlation coefficient relatingx(t)i andx(t)i′(i = 1–12; the i-th and i′-th pictures belong to a pair). STI(t) was defined as (R(t)2 −R2base)/(1 −R2base), where R(t)2 denotes the R2 statistic calculated using the mean discharge rates during the same time window as the PCI(t), andR2baserepresented the mean ofR(t)2 during the 100 msec immediately preceding the cue onset.
Results
Database
We conducted an extensive mapping of single-unit responses in the two subdivisions of IT cortex. As a result, a total of 2368 neurons were recorded from A36 (510 neurons) and TE (1858 neurons) in the three monkeys performing the PA task. Of those, 475 neurons (85 neurons in A36 and 390 neurons in TE) showed responses to the cue presentation for at least one stimulus among the 24 learned stimuli. Of them, 423 neurons (76 neurons in A36 and 347 neurons in TE) showed significant (p < 0.01; ANOVA) stimulus selectivity during the cue period (60–320 msec from cue onset) and hereafter are referred to as cue-selective neurons.
Pair-coding response
The responses of a representative cue-selective neuron in A36 are shown in Figure2A,B. One stimulus elicited the strongest response during the cue period from this neuron (Fig. 2A, thick black line, B, filled bar in pair 4). We refer to the stimulus that elicited the strongest cue response from each neuron as the cue-optimal stimulus. The trials, in which the cue-optimal stimulus was presented as a cue stimulus, are hereafter referred to as the optimal trials. On the other hand, we refer to the trial, in which the paired associate of the cue-optimal stimulus was presented as a cue stimulus, as the pair trial. In the pair trials, this neuron exhibited response amplitudes comparable with those in the optimal trials (Fig. 2A, thick gray line, B, open bar in pair 4). In contrast to the robust responses to this stimulus pair, this neuron responded only negligibly when a stimulus from any of the other pairs was presented as a cue stimulus (Fig.2A, thin black line, the averaged responses to the other 22 stimuli, B). Those trials are referred to hereafter as the other trials. The responses of another representative cue-selective neuron in A36 are shown in Figure 2,C and D. This neuron also exhibited strong responses to a particular pair of stimuli (Fig. 2D,pair 5), although the neuron responded to some of the other pairs. These patterns of stimulus selectivity, which encode the paired associates, have been described as the pair-coding response of IT neurons (Sakai and Miyashita, 1991; Higuchi and Miyashita, 1996;Erickson and Desimone, 1999). In subsequent experiments, we compared the pair-coding responses in A36 with those in TE.

Stimulus-selective responses to both paired associates of two representative A36 neurons (A andB for one neuron; C and Dfor the other neuron). A, C, Raster displays and PSTHs in the optimal (optimal, thick black line) and pair (pair, thick gray line) trials. The trials were aligned at the cue onset. Thethin black line denotes the averaged responses in the other trials (other). The horizontal gray bar indicates the cue presentation period. B,D, Mean discharge rates during the cue period (60–320 msec from the cue onset) for each cue presentation. Twelve pairs of stimuli are labeled on the abscissa. Theopen and filled bars in pair 1, for example, refer to the responses to stimulus 1 and 1′, respectively. Error bars denote SEM.
Population responses to paired associates
We first analyzed the pair-coding responses of A36 and TE neurons at the population level. Figure 3 shows the population-averaged PSTHs in the optimal trials (A) and the pair trials (B). Each population-averaged PSTH was calculated by using the normalized firing rates of all the cue-selective neurons in A36 (n = 76;green) and those in TE (n = 347;red). For each neuron, the instantaneous firing rate was divided by the mean firing rate during the cue period in the optimal trials (A36, mean = 25.3 ± 1.6 Hz; TE, mean = 32.9 ± 1.0 Hz; p < 0.001; t test). This normalization assured the direct comparisons in the PSTH between the two areas, particularly about the response time courses in the optimal trials and the response amplitudes in the pair trials. In the optimal trials, the PSTH for the TE neurons began to rise slightly earlier than that for the A36 neurons (Fig. 3A). This difference was found to reflect the significant difference in the response latencies of the single neurons (see Materials and Methods) (A36, mean = 93.8 ± 3.2 msec; TE, mean = 86.2 ± 1.5 msec; p < 0.05; t test). In the pair trials, the amplitudes of the PSTHs for both the A36 and the TE neurons were larger than in the other trials (Fig. 3B). Moreover, the difference in PSTH amplitude in the pair trials and the other trials was much larger for the A36 neurons than the TE neurons (Fig.3B). These observations concerning the PSTH amplitudes were also confirmed at the single neuron level. Figure4 shows the distributions of differences in response amplitude between the pair and other trials for the cue-selective neurons (A36, green; TE, red). The distribution is significantly shifted toward positive values in both areas (A36, median = 0.27; TE, median = 0.03;p < 0.001 in both areas; Wilcoxon's signed-rank test), with the distribution for the A36 neurons shifted to a significantly higher value than that for the TE neurons (p < 0.001; Kolmogorov–Smirnov test). Thus, in addition to the cue-optimal stimulus itself, both the A36 and the TE neurons responded selectively to the paired associate of the cue-optimal stimulus, and the response was more prominent in A36 than in TE.

Responses of cue-selective neurons in A36 and TE to paired associates. A, B, Population-averaged PSTHs for all cue-selective neurons in A36 (n = 76; green) and TE (n = 347; red) showing the responses in the optimal (A), pair (B), and other (A, B,other) trials. The responses of each neuron were normalized on its mean firing rate during the cue period in the optimal trials (mean ± SEM; 25.3 ± 1.6 Hz in A36; 32.9 ± 1.0 Hz in TE).
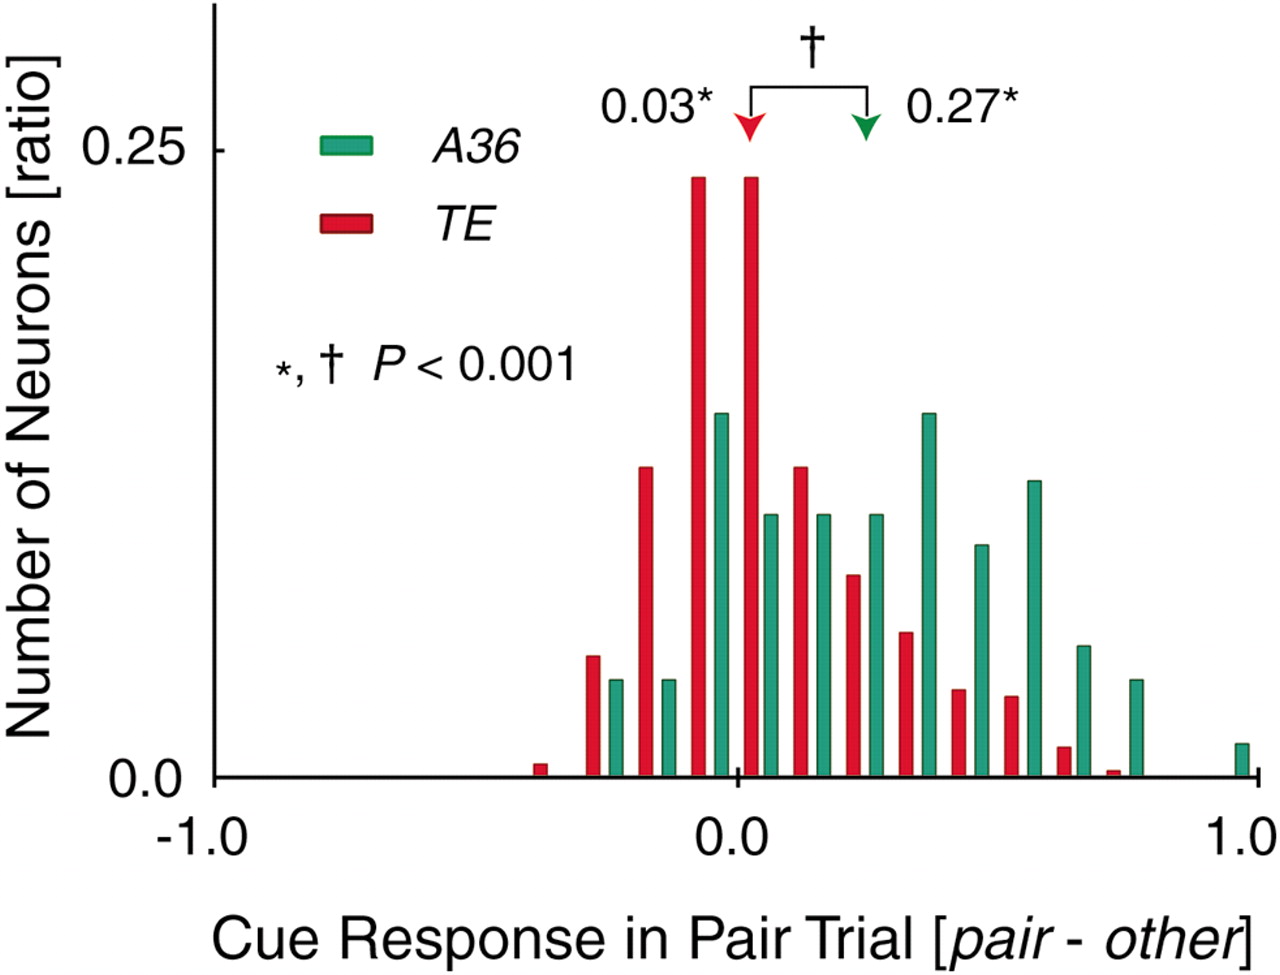
Distribution of response amplitudes in the pair trials. The cue responses in the pair trials were quantified for each neuron as follows. The mean firing rate during the cue period in the pair trials was subtracted by that in the other trials. The subtracted values were then normalized to the mean firing rates during the cue period in the optimal trials. The ordinate indicates the frequency of neurons in each bin that was normalized to the total number of the cue-selective neurons (n = 76 in A36,green; n = 347 in TE,red). Note that the distributions in both areas were shifted significantly toward more positive values (*p < 0.001; Wilcoxon's signed rank test). Moreover, the distribution of A36 neurons was shifted to significantly higher values than that of TE neurons (†p < 0.001; Kolmogorov–Smirnov test).
Correlation analysis
We next analyzed the pair-coding response of the A36 and TE neurons by considering the cue responses to all of the stimuli. A correlation coefficient was calculated for each neuron between the mean firing rate during the cue period to one stimulus and the mean firing rate during the cue period to the paired associate of that stimulus (PCI) (see Materials and Methods). PCI was influenced by weak responses if the stimulus selectivity of the neuron was rather broad, as in the case of the neuron shown in Figure 2D (PCI = 0.45), but much less so if the stimulus selectivity was sharp, as in the case of the neuron shown in Figure 2B (PCI = 0.98). If a single neuron in a population showed the pattern of stimulus selectivity that was independent of the stimulus pairs, the mean value of the PCI for the neuronal population would be expected to approach zero as the number of neurons in the population increased. We found that the distributions of the PCIs for all the cue-selective neurons shifted to the positive values in both areas (A36, median = 0.51; TE, median = 0.14; p < 0.001; Wilcoxon's signed-rank test) (Fig. 5, Table1). Moreover, the PCIs for the A36 neurons were significantly higher than those for the TE neurons (p < 0.001; Kolmogorov–Smirnov test) (Figs.5, 6A, Table 1). Furthermore, a substantial number of A36 neurons showed significantly positive PCIs at the single neuron level: p < 0.01 (i.e., PCI >0.71) (pair-coding neuron). The percentage of the pair-coding neurons among the cue-selective neurons was also higher in A36 (33%, median PCI = 0.86) than TE (4.9%, median PCI = 0.81) (p < 0.001; χ2test) (Table 1). Therefore, neurons in both areas acquired stimulus selectivity through associative learning, although the effect of the associative learning was engraved more intensely on the neuronal representation in A36 than in TE.

Distribution of response correlation to paired associates. The distributions of PCIs in both areas (n = 76 in A36, green;n = 347 in TE, red) were shifted significantly toward more positive values (*p < 0.001; Wilcoxon's signed rank test). Moreover, the distribution of A36 neurons was shifted to significantly higher values than that of TE neurons (†p < 0.001; Kolmogorov–Smirnov test).
Median values of the PCIs and percentages of the pair-coding neurons among the cue-selective neurons in A36 and TE of each monkey
Stimulus selectivity
We then tested whether general response properties, such as the sharpness of the stimulus selectivity, could explain the difference in the pair-coding responses between the two areas. For this purpose, we defined two indices: the STI (R2 statistic), which provides an estimate of how much of the variance in firing rate can be accounted for by the factor of stimulus, and the TNI for each neuron (kurtosis), which is a measure of the sharpness of the stimulus selectivity. The distribution of STIs for the cue-selective neurons did not differ between two areas (A36, median = 0.74; TE, median = 0.72;p > 0.99; Kolmogorov–Smirnov test) (Fig.6B). The distribution of TNIs did not differ between the two areas either (A36, median = 5.3; TE, median = 4.7; p > 0.41) (Fig.6C). These results indicated that the stimulus selectivity specified by either STI or TNI cannot explain the difference in the pair-coding responses of TE and A36.

Response correlation to paired associates and general response properties of cue-selective neurons. A, Cumulative frequency histograms of PCIs for A36 (n= 76; green) and TE (n = 347;red) neurons. PCIs for A36 neurons were significantly higher than those for TE neurons (†p< 0.001; Kolmogorov–Smirnov test). B,C, Cumulative frequency histograms of STIs (B) and TNIs (C) for A36 (green) and TE (red) neurons. Neither the STIs (p > 0.99) nor the TNIs (p = 0.41) significantly differ between A36 and TE neurons.
Spatial distribution of the pair-coding neurons
The spatial distributions of the cue-selective and pair-coding neurons are shown in the two-dimensional unfolded map of each animal (Fig. 7). In all three animals, most of the cue-selective neurons in A36 were localized in a focal patch. Because the pair-coding neurons are a subpopulation of the cue-selective neurons, they too were localized in the focal patch. In TE, the cue-selective neurons also tended to aggregate; however, their distribution was broader than in A36. The pair-coding neurons in TE were not necessarily distributed in the region near the borderline with A36, and we found no subregion in which the ratio of the pair-coding to the cue-selective neurons was higher than in A36 (Fig. 7).

Spatial distributions of pair-coding neurons. The positions of the pair-coding (orange filled diamond), cue-selective (black open square), and other recorded (black dot) neurons are shown on two-dimensional unfolded maps for each monkey. Black lines, Area borders; gray lines, fundus or lips of sulci;amts, anterior middle temporal sulcus;ots, occipital temporal sulcus; pmts, posterior middle temporal sulcus; rs, rhinal sulcus;sts, superior temporal sulcus; vl, ventral lip; A, anterior; P, posterior;L, lateral; M, medial. Scale bar, 5.0 mm.
Initial component of the pair-coding response
Pair-coding neurons in A36
We next examined whether the pair-coding response of A36 neurons was elicited by feedforward input from TE or feedback input from other higher centers. The population-averaged PSTHs for the A36 pair-coding neurons (n = 25) in the optimal (Fig.8, green) and pair (light green) trials differed not only in their amplitudes but also in their time courses. The amplitudes of initial transient responses (∼135 msec from the cue onset) were much larger in the optimal trials than in the pair trials, although the amplitudes of late responses (∼200 msec from the cue onset) were more similar. The response amplitudes in both the optimal and pair trials were larger than in the other trials.

Population-averaged PSTH for the pair-coding neurons in A36 (n = 25). Shown are the averages of the normalized responses in the optimal (optimal,green), pair (pair, light green), and other (other, dark green) trials.
The initial component of the pair-coding response was then characterized in terms of two indices (HPT and ERI) of the PSTHs for the optimal and pair trials for each neuron. Half peak time of firing rate was defined as the period from the cue onset to the instant when the PSTH reached 50% of its peak from the base line, whereas early response index was defined as (early response − late response)/(early response + late response) (see Materials and Methods). Then using HPT and ERI, we conducted a cluster analysis (see Materials and Methods) (Fig. 9A) and found that the 25 pair-coding neurons separated into two groups, one with 17 neurons (Type1, filled circles; median PCI = 0.88) and another with 8 neurons (Type2,open circles; median PCI = 0.77). Figure 9Bshows the HPTs in the pair trials plotted against those in the optimal trials. For Type1 neurons, the HPTs did not differ in the two types of the trials (p = 0.30; Wilcoxon's signed-rank test; median = 98 msec in both trials). For Type2 neurons, however, the HPTs were larger in the pair trials (median = 145 vs 114 msec; p < 0.05). Furthermore, comparison of the responses of the two neuron types in the pair trials revealed the HPTs to be larger for Type2 neurons than Type1 neurons (p < 0.001; Kolmogorov–Smirnov test). In the optimal trials, the HPTs did not significantly differ (p = 0.34). Figure 9C shows the scatter plot of the ERIs. For Type1 neurons, the ERIs in the optimal (median = 0.30) and pair (median = 0.37) trials did not differ significantly (p = 0.65; Wilcoxon's signed-rank test). For Type2 neurons, by contrast, the ERIs were smaller (p < 0.05) in the pair trials (median = 0.12 vs 0.30). In the pair trials, moreover, the ERIs were smaller for Type2 neurons than Type1 neurons (p < 0.005; Kolmogorov–Smirnov test). In the optimal trials, they did not differ significantly (p = 0.21).

Two subgroups of the pair-coding neurons.A, ERI in the pair trials minus ERI in the optimal trials plotted as a function of the HPT in the pair trials minus the HPT in the optimal trials for the pair-coding neurons in A36.B, HPT in the pair trials plotted as a function of HPT in the optimal trials. C, ERI in the pair trials plotted as a function of ERI in the optimal trials. A–C, Type1 and Type2 neurons were plotted as filled circles(n = 17) and open circles(n = 8), respectively. D,E, Population-averaged PSTH for the Type1 (D) and Type2 (E) neurons, showing the normalized responses in the optimal (green), pair (light green), and other (dark green) trials. F, The same format as in A for the pair-coding neurons in TE (gray filled circle; n = 17).
From the averaged PSTHs for all pair-coding neurons (Fig. 8), we derived the averaged PSTHs for the two neuronal subpopulations (Fig.9D,E). The averaged PSTHs for Type1 neurons showed an initial transient response that declined to a steady level of activity in both the optimal trials and pair trials (Fig.9D). For Type2 neurons, the averaged PSTH in the optimal trials followed a time course similar to those of Type1 neurons: an initial transient response declined to a steady activity level. On the other hand, the averaged PSTH in the pair trials differed and exhibited only sustained activity that developed after a delay of tens of milliseconds (Fig. 9E).
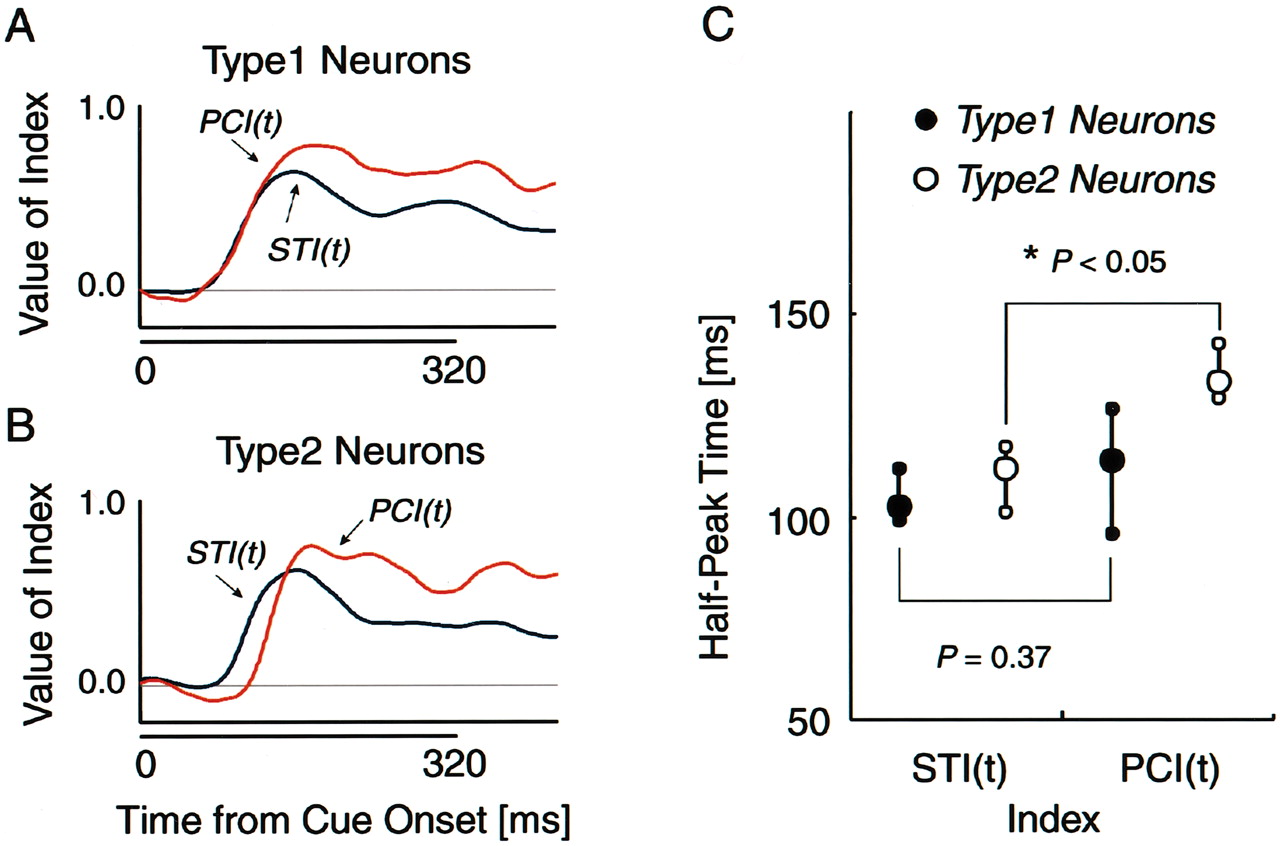
To further characterize the pair-coding neurons in each group, we determined the time at which their stimulus-selective responses started to show the property of the pair coding. For this purpose, the instantaneous STI and PCI index at a given time point of tfrom the cue onset [STI(t) and PCI(t), respectively] were calculated for each neuron using the same time window (see Materials and Methods). Figure10, A and B, show the population-averaged time courses of the two indices in Type1 (A) and Type2 (B) neurons. In Type1 neurons, STI(t) (blue) and PCI(t) (orange) began to rise together (A), whereas in Type2 neurons, the rise of the PCI(t) (orange) followed that of the STI(t) (blue) with a delay of 20–30 msec (B).

Differential temporal dynamics of STI(t) and PCI(t) in Type1 and Type2 pair-coding neurons in A36. Population-averaged STI(t) (blue) and PCI(t) (orange) are plotted against time from the cue onset for the Type1 neurons (n = 17) (A) and the Type2 neurons (n = 8) (B). In Type1 neurons, PCI(t) showed the same time course as the STI(t). In Type2 neurons, by contrast, PCI(t) began to rise with a significant delay after the rise of STI(t). C, Median values (large circle) of half-peak time of STI(t) (left) and PCI(t) (right) are shown for the Type1 (filled circle; n = 17) and Type2 (open circle; n = 8) neurons. The small circles indicate the superior and inferior quartile points. The half-peak times of the two indices were not significantly different for the Type1 neurons (median = 127 msec in STI(t); median = 138 msec in PCI(t); p = 0.38; Wilcoxon's signed-rank test). On the other hand, for the Type2 neurons, the half-peak times in the PCI(t)s were significantly larger than in the STI(t)s (median = 136 msec in STI; median = 157 msec in PCI; *p < 0.05).
We assessed the time courses of STI(t) and PCI(t) in each group at the single neuron level by calculating the half-peak time in each neuron. In Type1 neurons, the half-peak time of the two indices did not differ (median = 127 msec in STI; median = 138 msec in PCI; p = 0.38, Wilcoxon's signed-rank test) (Fig. 10C). In Type2 neurons, by contrast, the half-peak time of PCI(t) was larger than that of STI(t) (median = 136 msec in STI; median = 157 msec in PCI; p < 0.05). Furthermore, the half-peak times of the PCI(t)s for Type2 neurons were significantly larger than those for Type1 neurons (p < 0.01; Kolmogorov–Smirnov test). The distributions of the half-peak times of the STI(t)s did not differ significantly (p = 0.36). These results indicate that more than two-thirds of the pair-coding neurons in A36 began to exhibit the pair-coding response as soon as they exhibited stimulus selectivity.
Pair-coding neurons in TE
We also examined the initial component of the pair-coding response in TE, although the percentage of the pair-coding neurons in TE was much smaller than that in A36 (Table 1). Because the pair-coding neurons were not separable on the two-dimensional space constructed using HPT and ERI (Fig. 9F), we treated them as one group (n = 17). In this population, neither HPTs nor ERIs differed between the optimal (median = 106 msec in HPT; median = 0.36 in ERI) and pair (median = 106 msec in HPT; median = 0.38 in ERI) (p = 0.63 in HPT;p = 0.41 in ERI) trials. The half-peak times of STI(t) and PCI(t) also did not differ (median = 129 msec in STI; median = 134 msec in PCI;p = 0.38), which suggests that, as a population, the pair-coding neurons in TE showed initial transient responses similar to Type1 neurons in A36 rather than Type2 neurons.
Discussion
In the present study, we examined the differences in the neuronal responses representing a pair-association memory in the two subdivisions of IT cortex (TE and A36) and tested whether the association between the representations of paired associates proceeds forward from TE to A36. We found that in monkeys trained to do a PA task, the responses of both TE and A36 neurons to paired associates were significantly correlated at the population level and that this correlation was much stronger in A36 than TE (median, 0.51 in A36 vs 0.14 in TE). In A36, a substantial number of neurons showed significantly (p < 0.01) correlated responses to the paired associates at the single neuron level (pair-coding neuron). The percentage of the pair-coding neurons was also much higher in A36 than TE (33% in A36 vs 4.9% in TE, of the cue-selective neurons). The pair-coding neurons in A36 were further separable into the two groups on the basis of their initial transient responses after presentation of the cue stimulus (68% were Type1 and 32% were Type2). Type1 neurons began to encode the association between the paired stimuli as soon as they exhibited stimulus selectivity, whereas Type2 neurons began to encode the association 20–30 msec after they started to show stimulus selectivity. This suggests that Type1 neurons encode the associative memory by directly combining the feedforward input from TE. By contrast, Type2 neurons may encode the association memory by the feedback input from other higher centers (Hasegawa et al., 1998; Rainer et al., 1999) or by the intrinsic input from other neurons in A36 (e.g., Type1 neuron). The spatial distribution of the pair-coding neurons demonstrates that the pair-coding neurons in TE were not necessarily distributed in the region near the border with A36. This suggests that the percentage of the pair-coding neurons did not increase in a gradual manner from lateral to medial in IT cortex. Moreover, within TE, there was no subregion where the percentage of the pair-coding neurons was comparable with that in A36. These anatomical observations are consistent with our physiological result that the percentage of the pair coding neurons dramatically increased from TE to A36. Taken together, we conclude that the representation of stimulus–stimulus association memory proceeds forward through the anatomical hierarchy of IT cortex, from TE to A36.
In this study, PCI in A36 is substantially larger than that reported in previous studies (Sakai and Miyashita, 1991; Higuchi and Miyashita, 1996; Erickson and Desimone, 1999; Messinger et al., 2001). The most important reason for this result is that we conducted recordings in A36 separate from those in TE. Another possibility is that the long-term learning in the present study may have induced larger effects in A36, compared with the short-term (one or two sessions) learning in other studies (Erickson and Desimone, 1999; Messinger et al., 2001). The other possible reason is that the associative memory measures (i.e., PCI) may depend on the stimulus set. However, the stimulus selectivity specified by either STI or TNI did not differ between A36 and TE for the stimulus set used in the present study (Fourier descriptors). It is also unlikely that information on the present stimulus set is preferentially processed in A36 rather than in TE. This is clear from the fact that the percentage of the cue-selective neurons of the recorded neurons was higher in TE than in A36 (19% in TE; 15% in A36). A previous electrophysiological study using stimulus sets other than Fourier descriptors (Nakamura et al., 1994) also showed that stimulus-selective properties of visual responses did not differ between TE and A36. Thus, the conclusion reached in the present study would not change if other more general, complex objects were used as a stimulus set.
Murray et al. (1993) identified neural substrates of visual stimulus–stimulus association memory by bilaterally ablating the rhinal cortex [the perirhinal (PRh) and entorhinal cortices]. Buckley and Gaffan (1998) further demonstrated that ablation restricted to PRh cortex impaired monkeys' performance of a visual paired-associate learning task. They suggested that PRh cortex is engaged in mnemonic processing or in processing of stored knowledge of objects, whereas TE functions specifically in perceptual processing or in processing of the structural attributes of objects. In the present study, we observed several differences in the mnemonic representations in the two areas, and we suggest that our findings provide a physiological basis for the results of the aforementioned lesion experiments.
There are a few reports that have described the differences in single-unit activity in PRh cortex and TE. Xian and Brown (1998), for example, showed that the memory span concerning the recency of the stimulus was longer in PRh cortex than TE. These authors suggested that this physiological difference in coding of recency memory between the two areas is caused by a difference in the distribution/density of ion channels and receptors (e.g., muscarinic receptors) at the single neuron level (Massey et al., 2001), rather than by the feedforward processing proposed in the present study. Liu and Richmond (2000)trained monkeys using delayed match-to-sample trials combined with visually cued reward schedules and found that the cue-related responses in TE were related to a feature of the stimulus (the cue's brightness), whereas those in PRh cortex were related to the stimulus–reward association (the trial schedules). The reward expectation signal is believed to be provided from areas outside of TE; consequently, the visual stimulus should be associated with the reward expectation through more complex neural circuits than the stimulus–stimulus association investigated in the present study. Nevertheless, these two types of association may be substantiated by common cellular/molecular mechanisms in PRh cortex that integrate two separate signals into a complex representation for learned behavior.
The forward processing of the pair-association memory most likely requires selective convergence. The perceptual information about either of the paired associates that are coded by the separate TE neurons would converge onto the same A36 neuron, in particular, on a Type1 neuron (the “selective-convergence” model). Several lines of evidence support this idea. First, neurons in the temporal lobe learn to associate stimuli on the basis of temporal contiguity (Miyashita, 1988; Sakai and Miyashita, 1991; Stryker, 1991; Booth and Rolls, 1998;Yakovlev et al., 1998), and PRh neurons show delayed responses to a visual stimulus (Miyashita, 1988; Miyashita and Chang 1988; Yakovlev et al., 1998), particularly to a novel stimulus (Erickson and Desimone, 1999). Given that the paired associates are presented sequentially during the PA task, the resultant synaptic weight on an A36 neuron could be strengthened by the temporal contiguity. Second, Tokuyama et al. (2000, 2002) observed in monkeys that expression of BDNF andzif268 mRNA was selectively induced in a focal patch within A36 during memory formation in a PA task. Furthermore, the location of the focal patch expressing BDNF and zif268 was similar to the location at which aggregates of pair-coding neurons were detected by single-unit recording in the present study. It is likely that the molecular events mediated by the expression of these genes serve to modify the synaptic connections of the A36 neurons during the formation of pair-association memory.
We also found a small but significant percentage of pair-coding neurons among the cue-selective neurons in TE. We therefore cannot logically exclude an alternative neural mechanism in which all of the pair-coding responses in A36 are driven by the direct input from the pair-coding neurons in TE (the “direct-driven” model). However, this alternative cannot easily explain the dramatic increase in pair-coding neurons in A36. Moreover, the direct-driven model requires that the non-pair-coding neurons (i.e., most of the cue-selective neurons) in TE do not drive A36 neurons as effectively as the pair-coding neurons do. Because TE neurons send dense fiber projections to A36 neurons (Suzuki and Amaral, 1994; Saleem and Tanaka, 1996), this model seems unlikely, unless we suppose some kind of synaptic mechanism that selectively suppresses most of the input from TE. The direct-driven model is not supported by the results of a previous experiment in which the rhinal cortex was lesioned (Higuchi and Miyashita, 1996). Because the rhinal lesion eliminated the pair-coding neurons in TE, the formation of pair-coding neurons in TE would depend on the plasticity of the neural circuit mediated by the long-term feedback effect from A36. We therefore suggest that the pair-coding neurons in TE are not the parents of the pair-coding neurons in A36 but are their offspring in the long time scale. In other words, the pair-coding neurons in TE are presumably built up through the consolidation-like effect (Zola-Morgan and Squire, 1990; Yoshida et al., 2003) that is substantiated by the long-term feedback from A36 to TE.
In the previous study, we reported the retrieval of the paired associates by measuring the prospective component of delay activity (Naya et al., 2001). As to the correspondence between the pair-coding neurons and pair-recall neurons, they were separate subpopulations in TE (i.e., the percentage of the neurons in which both pair-coding and pair-recall signals were significant was only 1% of the cue selective neurons). On the other hand, in A36, some of the pair-coding neurons overlapped with some of the pair-recall neurons (15%). This is because Type2 neurons in A36 mostly exhibited significant pair-recall signals. The late sustained activity of Type2 neurons may encode the paired associate of the cue stimulus rather than the cue stimulus itself, but the origin of this sustained activity is not yet known. Recently, the pairing of a particular flavor and a spatial location in one trial, which forms “episodic-like” memory (Morris, 2001), was reportedly impaired by blockage of the glutamate receptor in the hippocampus of rats (Morris and Day, 2003). The late sustained activity of the A36 Type2 neurons might reflect the association process involving the hippocampus and might be a component of the mechanism that leads to the formation of the selective convergence of the TE inputs onto the A36 Type1 neurons. We propose that this kind of selective convergence is the neuronal basis of cortical cell assembly for “semantic-like” memory, which is the partner to episodic-like memory that may require more distributed networks in the hippocampus (Gaffan, 1994;Clayton and Dickinson, 1998; Morris, 2001; Morris and Day, 2003).
Footnotes
This work was supported by a Grant-in-Aid for Specially Promoted Research (14002005) to Y.M. and a Grant-in-Aid for Encouragement of Young Scientists (09780744) to Y.N. from the Ministry of Education, Culture, Sports, Science and Technology of Japan. We thank A. Ito and S. Shibata for technical assistance. We thank H. Aizawa, K. Ohki and W. Tokuyama for discussions.
Correspondence should be addressed to either of the following: Yuji Naya, Department of Physiology, The University of Tokyo School of Medicine, Hongo, Tokyo 113-0033, Japan, E-mail: naya-ns{at}umin.ac.jp; or Yasushi Miyashita, Department of Physiology, The University of Tokyo School of Medicine, Hongo, Tokyo 113-0033, Japan, E-mail:yasushi_miyashita{at}m.u-tokyo.ac.jp.


