

Abstract
Age-related loss of brain tissue has been inferred from cross-sectional neuroimaging studies, but direct measurements of gray and white matter changes from longitudinal studies are lacking. We quantified longitudinal magnetic resonance imaging (MRI) scans of 92 nondemented older adults (age 59–85 years at baseline) in the Baltimore Longitudinal Study of Aging to determine the rates and regional distribution of gray and white matter tissue loss in older adults. Using images from baseline, 2 year, and 4 year follow-up, we found significant age changes in gray (p < 0.001) and white (p < 0.001) volumes even in a subgroup of 24 very healthy elderly. Annual rates of tissue loss were 5.4 ± 0.3, 2.4 ± 0.4, and 3.1 ± 0.4 cm3 per year for total brain, gray, and white volumes, respectively, and ventricles increased by 1.4 ± 0.1 cm3 per year (3.7, 1.3, 2.4, and 1.2 cm3, respectively, in very healthy). Frontal and parietal, compared with temporal and occipital, lobar regions showed greater decline. Gray matter loss was most pronounced for orbital and inferior frontal, cingulate, insular, inferior parietal, and to a lesser extent mesial temporal regions, whereas white matter changes were widespread. In this first study of gray and white matter volume changes, we demonstrate significant longitudinal tissue loss for both gray and white matter even in very healthy older adults. These data provide essential information on the rate and regional pattern of age-associated changes against which pathology can be evaluated and suggest slower rates of brain atrophy in individuals who remain medically and cognitively healthy.
Introduction
Stereological studies of neuron counts in the human brain suggest that there is little neuron loss in normal aging (Morrison and Hof, 1997; Pakkenberg and Gundersen, 1997). The conclusions drawn from these postmortem studies, which are necessarily cross-sectional, stand in contrast to data from in vivo imaging studies, which reveal age differences in brain volumes and CSF spaces (Gur et al., 1991; Coffey et al., 1992;Pfefferbaum et al., 1994; Murphy et al., 1996; Courchesne et al., 2000). One difficulty in interpreting both the postmortem and in vivo imaging studies is the cross-sectional nature of the majority of investigations. Estimates of age effects based on such designs are confounded by secular changes in nutrition, medical care, and other factors. Indeed, secular drifts in body and brain weight have been documented (Miller and Corsellis, 1977), and rates of brain changes can only be determined from longitudinal investigations.
An advantage of the use of in vivo imaging to study brain changes is that repeated assessments can be performed over time. By controlling for variability between individuals, within-individual comparisons can identify subtle changes over time. There have been few longitudinal neuroimaging studies, and none have examined global and regional changes in both gray and white matter using high-resolution magnetic resonance imaging (MRI). One longitudinal MRI study reported puzzling findings of longitudinal increases in some brain volume measures and decreases in subarachnoid CSF over a 3–6 year interval (Mueller et al., 1998). Low reliability (inter-rater agreement of 0.71) for measurement of subarachnoid CSF on images of 4 mm thickness suggested difficulties in identifying the interface between CSF and brain parenchyma, leading to inaccuracies in measurement of brain and sulcal CSF volumes. More recently, Tang and colleagues (2001)reported a 2.1% annual rate of cerebral volume loss over 4.4. years, using stereological techniques to estimate a global measure of cerebral volume from MRI sections of 5 mm thickness.
Since 1994, we have been conducting a longitudinal brain imaging study of older adults in the Baltimore Longitudinal Study of Aging (BLSA) to identify brain changes that may be predictors of cognitive decline and Alzheimer's disease. High-resolution MRI (1.5 mm thickness) and a validated approach for image analysis (Goldszal et al., 1998; Resnick et al., 2000) are used for quantitation of global and regional gray and white volumes. We hypothesized that loss of both gray and white matter would be detectable over the 4 year interval. Consistent with other cross-sectional studies (Grant et al., 1987; Gur et al., 1991; Coffey et al., 1992; Pfefferbaum et al., 1994) and our own data on 1 year change (Resnick et al., 2000), we hypothesized that ventricular volume would continue to increase over the course of the study. We also examined the effects of age and sex on the rates of change for regional brain volumes and ventricular volume. In this report, we provide the first evidence of substantial longitudinal loss of both gray and white matter tissue volumes over a 4 year interval even in healthy elderly. In addition, we show steady age-related increases in ventricular CSF (V-CSF). The rate of increase in V-CSF is influenced by age but is similar in male and female older adults.
Materials and Methods
Subjects. The present sample includes 92 participants (50 men, 42 women) in the neuroimaging study of the BLSA (Resnick et al., 2000) who completed a baseline MRI study and assessments at year 3 (2 year interval) and year 5 (4 year interval). Three additional participants were excluded from these analyses because they had developed serious CNS pathology (but remained free of dementia). Neuroimaging participants in this sample are a subset of BLSA volunteers, aged 59–85 at baseline, who agreed to return annually and who did not meet any of the following exclusionary criteria at initial evaluation: CNS disease [epilepsy, stroke, bipolar illness, previous diagnosis of dementia according to Diagnostic and Statistical Manual (DSM)-III-R criteria (Spitzer and Williams, 1987)], severe cardiovascular disease (myocardial infarction, coronary artery disease requiring angioplasty or bypass surgery), severe pulmonary disease, or metastatic cancer. Individuals showing signs of cognitive decline that did not meet criteria for dementia (n = 4) and those with past or current depression (n = 8) were included, because these factors may be risk factors for dementing illness. All participants remained free of dementia at year 5 follow-up, using diagnostic procedures described previously (Kawas et al., 2000). Demographic characteristics and measures of functional status are presented in Table 1 for the entire sample and for a subgroup of 24 participants who remained very healthy (no medical conditions or cognitive impairment) at year 5 evaluation. This research protocol was approved by the local institutional review board, and written informed consent was obtained from all participants in conjunction with each neuroimaging visit.
Sample characteristics at baseline imaging assessment (mean ± SD)
Image acquisition. MR acquisition procedures are detailed inResnick et al. (2000). MR scanning was performed on a GE Signa 1.5 Tesla scanner. The current results are based on a high-resolution volumetric “spoiled grass” (SPGR) series (axial acquisition; repetition time = 35; echo time = 5; flip angle = 45; field of view = 24; matrix = 256 × 256; number of excitations = 1; voxel dimensions of 0.94 × 0.94 × 1.5 mm slice thickness). Two similarly configured scanners were used interchangeably over the course of the data collection, which spanned from February 1994 through July 1999. During this time period, there were no major hardware upgrades, and all acquisitions were completed before the LX software upgrade. Quality control scans were performed daily.
Image analysis. Quantitative analysis of MR volumes is accomplished using a semi-automated approach, with demonstrated validity and high reliability (Goldszal et al., 1998). Images are first reformatted parallel to the plane containing the anterior and posterior commissures. Extracranial tissue, the cerebellum, and brainstem structures inferior to the mammillary bodies are removed by a single, highly experienced, image-processing technician using a semi-automated procedure, with high inter-rater and test–retest reliability (Goldszal et al., 1998). The remaining tissue is classified, using an adaptive Bayesian segmentation algorithm (Yan and Karp, 1995), into gray matter, white matter, and CSF. V-CSF is defined by drawing a crude region of interest to mask out any nonventricular CSF. After this step, all image processing is fully automated and operator independent. The segmented images provide quantitative volumetric measures of total gray, white, and brain (gray + white) matter, as well as V-CSF volumes and ventricle-to-brain ratios (VBRs). Stabilities over 1 year for these measures are all >0.95. Sulcal CSF is not quantified, because the interface between CSF and the cranium is difficult to determine reliably on SPGR images. Moreover, our longitudinal analysis focuses on direct measurements of changes in brain parenchyma, rather than indirect measurements of such changes via sulcal spaces.
Regional analysis of volumes examined in normalized space, the RAVENS approach (Goldszal et al., 1998), is used for quantification of regional volumes and investigation of local brain changes. The segmented images are transformed to the Talairach stereotaxic coordinate space (Talairach and Tournoux, 1988), using the elastic deformation algorithm of Davatzikos (1996). This approach allows quantitation of absolute volumes within the standard reference space and applies a boundary constraint for the ventricles, which are often enlarged in the elderly. Volumes of frontal, parietal, temporal, and occipital brain regions, for gray and white matter, are determined automatically within the Talairach coordinate space (Andreasen et al., 1996), yielding stabilities over 1 year between 0.86 and 0.97 (Resnick et al., 2000). In addition, the RAVENS approach yields average brain maps for analysis of local differences between groups of subjects or longitudinal change. Image intensities reflect the amount of expansion or contraction relative to a template brain and correspond to the distribution of gray, white, or CSF volumes in the average RAVENS maps. For example, if a subject's ventricles are larger relative to other subjects, this subject's RAVENS V-CSF map will be relatively brighter. The same holds for gray matter and white matter structures. Accordingly, regional volumetric measurements are performed via regional analysis of the RAVENS maps. Effect sizes for differences in intensities over time reveal local longitudinal changes.
Statistical analysis. Statistical analysis was performed using SAS Version 6.12 on a DEC α computer running OpenVMS. Two and 4 year stabilities were estimated by Pearson product–moment correlations. Mixed-effects regression was used to investigate longitudinal changes and the effects of age (as a continuous covariate), sex, and hemisphere on changes for individual brain regions. Separate analyses were conducted for total brain, gray, and white matter volumes, frontal, parietal, temporal, and occipital volumes, ventricular volumes, and VBR. Height was entered as a covariate for volume but not ratio measures. Longitudinal change was included in each model by addition of time (baseline, year 3, year 5) as a fixed-effects term. In addition, all two-way interactions, excluding those with height, and three-way interactions of interest were included in the initial model. A backward elimination procedure was used, whereby all lower-order terms remained in the final model but nonsignificant interactions (p > 0.05) were eliminated at each step until a final solution was reached (Morrell et al., 1997). Annual rates of change were calculated from the slope of volume versus age at assessment, providing estimates that can be compared across the various brain volume measurements. Finally, the differential effects of age and sex across different tissue types (i.e., gray versus white), brain regions (i.e., frontal, parietal, temporal, occipital), and hemispheres (right, left) were examined using multivariate ANOVA (MANOVA). In these analyses, sex and age (<70 years versus 70–85 years at baseline) were grouping factors; time (baseline, year 3, year 5) and tissue type or region were repeated-measures factors. Tissue type and region were examined in separate analyses, with the analysis of lobar volumes including both gray and white matter. Two sets of additional analyses were performed. The first excluded the four subjects with mild cognitive impairment. In the second, analyses of global and lobar measures were repeated, restricting the sample to the 24 individuals who remained free of medical problems and did not meet criteria for mild cognitive impairment.
Statistical analysis of local gray and white matter volume changes was performed using the RAVENS images and voxel-based paired ttests as implemented in Statistical Parametric Mapping (SPM) 99 (Friston et al., 1995). Tissue outside the brain, as well as V-CSF, was masked from each image before SPM analysis. Images were smoothed using a 9 mm3 filter, chosen on the basis of our previous validation experiments (Davatzikos et al., 2001) and the spatial specificity of our normalization approach. Because we were interested in identifying regions of absolute volumetric changes, we did not adjust for global changes in brain volume. Longitudinal change was calculated as baseline minus year 5 images, with significance set at p < 0.001, uncorrected. Anatomic localization was determined from our average gray matter map for the 92 subjects, using standard anatomical references (Mai et al., 1997; Duvernoy, 1999).
Results
Stability over time
All measurements were highly stable over both 2 and 4 year intervals, with test–retest correlations ranging from 0.94 to 0.99. Four year stabilities for brain and ventricular volumes (Fig.1, top and bottom, respectively) illustrate the high stability in the face of changing absolute volumes. These scatterplots show declines in brain volumes and increases in V-CSF for the majority of individuals. Although the magnitude of decline in brain volume appears relatively consistent across subjects, there is a tendency for greater V-CSF increases in individuals with larger baseline volumes.

Scatterplots showing stability of brain (top) and ventricular (bottom) volumes over 4 years. Against a background of highly stable measurement, brain volumes decrease and ventricular volumes increase over the 4 year interval.
Age effects on global and lobar volumes
Results of the mixed-effects regression analyses are summarized in Tables 2 and3 for the whole sample and very healthy subsample, respectively. Cross-sectional effects of age and sex on brain and ventricular volumes were consistent with our previous report of baseline and 1 year follow-up assessments (Resnick et al., 2000). As indicated by the significant effects of time, longitudinal brain changes reached statistical significance for all regions examined. These findings indicated longitudinal decreases in brain volume measurements and increases in VBR. For ventricular volume and VBR, there was a significant age by time interaction, revealing a faster rate of change in both measures with advancing age. In the presence of this interaction, the main effect of time for V-CSF did not reach significance, although significant longitudinal increases were evident when the interaction was omitted from the model. Rates of change in brain and ventricular volumes did not differ significantly for men and women. Longitudinal changes remained significant excluding the four individuals with mild cognitive impairment and for the analyses based on 24 individuals free of medical problems and even very mild cognitive change. Interestingly, cross-sectional effects of age did not reach significance in the very healthy group, highlighting the greater sensitivity of intra-individual measurements of longitudinal change.
Results of mixed-effects regression analyses for entire sample of 92 participants
Results of mixed-effects regression analyses for main effects in subsample of 24 very healthy individuals
Direct comparison of longitudinal tissue loss for gray versus white matter was performed using repeated-measures MANOVA. Consistent with the mixed-effects regression results, the overall loss of brain tissue over time was highly significant:F(2,88) = 146.0; p < 0.0001. However, there were no significant differences between gray and white matter in the magnitude of tissue loss. In contrast to these findings, analysis of the magnitudes of longitudinal tissue loss for frontal, parietal, temporal, and occipital regions revealed significant differences among regions (time × region:F(6,84) = 4.73; p < 0.001). To further examine this interaction, values were standardized within each region using a z-transformation based on the mean and SD at baseline for each region separately. Longitudinal tissue loss was greater for frontal and parietal lobes than temporal and occipital lobes (Fig. 2). The magnitudes of longitudinal changes in the lobar regions were not significantly influenced by age and sex. MANOVA restricted to the very healthy subsample showed significant longitudinal changes that did not differ as a function of tissue type or lobar brain region.

Magnitudes of longitudinal change as a function of brain (gray + white) region. To illustrate the significant region-by-time interaction, mean longitudinal change for each lobar brain region is plotted as a z-score, using the mean and SD from lobar brain volumes at baseline to control for differences in absolute volumes. Frontal and parietal brain volumes show greater relative tissue loss compared with temporal and occipital regions.
The magnitudes of the annual rates of change for each of the volumetric measurements are presented in Figure 3for total brain, gray, white, and ventricular volumes and in Table4 for lobar regions. Remarkably, this community-dwelling sample of older adults shows an average loss of 5.4 cm3 of brain volume and increase of 1.4 cm3 in ventricular volume each year. (Note that the discrepancy between volume loss and ventricular volume increase is attributable to the fact that we have not measured the sulcal CSF surrounding the cortex in this study.) Exclusion of the four participants with mild cognitive impairment yielded nearly identical rates of change for the global measures. The magnitude of brain tissue loss was somewhat reduced in the very healthy elderly, but these individuals still showed significant volume change. As described above, the apparent trend toward greater decline in rates of change for white compared with gray matter volume was not statistically significant when compared directly using repeated-measures MANOVA.

Annual rates of change in brain, gray, white, and ventricular volumes (cubic centimeters) for the entire sample, the subgroup with some medical problems, and the subgroup of very healthy individuals. Mean values are displayed at the axis ends. All values are significant at p < 0.001 except gray (NS) and white (p < 0.05) in the healthy group. Note that the nonsignificant trend for gray matter tissue loss in the healthy subgroup is significant in the more sensitive mixed-effects regression analysis (see Results).
Absolute rates (cm3) and annual percentage changes for lobar brain regions
Age effects on local gray and white matter tissue volumes
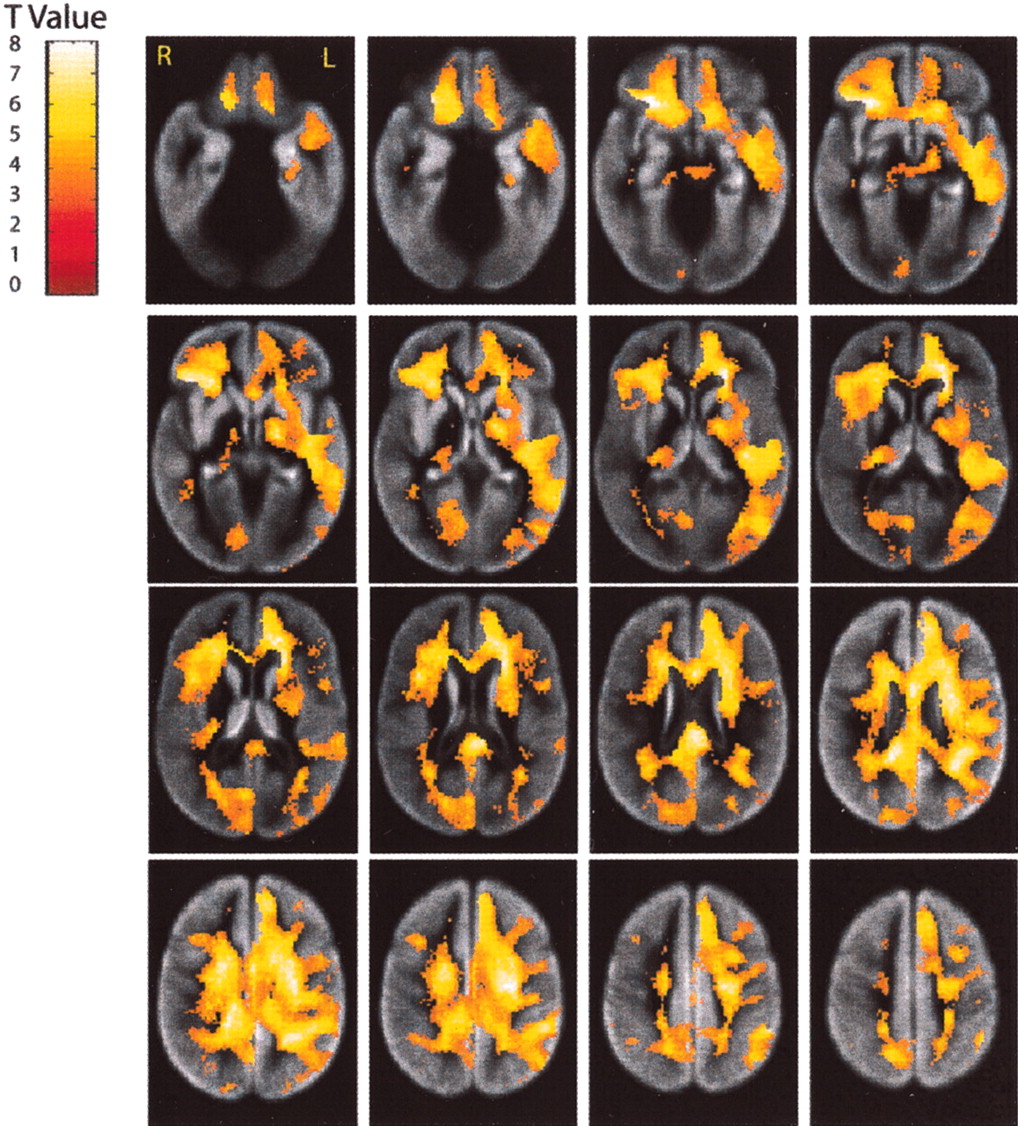
Voxel-based paired t tests were performed on the RAVENS gray and white matter images, separately, to examine localized loss of tissue over 4 years (Figs. 4, 5). Substantial gray matter tissue loss (Fig. 6) is observed in the regions of the interhemispheric and Sylvian fissures, affecting cingulate and insular cortex, respectively. Consistent with our cross-sectional observations (Resnick et al., 2000), the orbital and inferior frontal cortex and the mesial temporal cortex, albeit to a lesser extent, are also vulnerable to longitudinal tissue loss. In addition, significant gray matter tissue loss is observed in the inferior parietal region. There appears to be a lateralized pattern to the gray matter volume loss, with greater change for the right compared with left hemisphere in many regions. The right greater than left asymmetry is most pronounced in inferior frontal and anterior temporal regions, but shows a reversed pattern in the inferior parietal region. Local analysis of white matter tissue loss reveals widespread changes throughout the brain. Although there is some asymmetry in the white matter tissue loss, this asymmetry appears limited to the temporal lobe, with greater loss of left than right temporal white matter.

Local changes in gray matter volume. Longitudinal declines in tissue volumes over the 4 year interval are shown by the color-coded t score values, calculated from a voxel-based comparison between baseline and year 5 gray matter images. Images are thresholded at p < 0.001 orz = 3.18. To facilitate anatomic localization, significant voxels are superimposed on transaxial slices of a map of the average gray matter distribution of the baseline images after segmentation and stereotaxic normalization. Brighter regions of the gray matter image are more likely to contain gray matter.

Local changes in white matter volumes. Longitudinal declines in white matter tissue volume from baseline to year 5 are shown as t values for each voxel. See Figure4 for a more detailed description.

Three-dimensional views of significant longitudinal tissue loss in specific gray matter regions. Three-dimensional views of the t statistic are shown projected on the outer cortical surface of a representative subject in our sample. The projection on the surface was performed by averaging the value of the t statistic along the normal of each surface vertex; only voxels with t statistic >3.18 were included in this averaging procedure. The color bar shows the colors corresponding to these calculated average t statistics.Bottom, Views of the right and left hemispheres highlight tissue loss in inferior frontal, insular, and posterior temporal regions (right > left) and the inferior parietal (left > right) region. Top, Gray matter volume loss in the insula (right > left; inferior and coronal views), orbital frontal cortex (inferior and sagittal views), and cingulate cortex (sagittal and coronal views) are highlighted. In the inferior view, the anterior temporal lobe is cut away to expose the surface of the insular cortex.
Discussion
This report provides the first evidence of substantial longitudinal declines in both gray and white matter brain volumes in older adults ranging in age from 59 to 85 years at baseline. Moreover, we provide the first quantitative data of the rates and regional distribution of local gray and white matter tissue loss in older adult men and women. Although other investigations have indicated brain volume loss in specific brain regions, such as the hippocampus (Kaye et al., 1997; Jack et al., 1998; Mueller et al., 1998), or more global volume loss (Chan et al., 2001; Tang et al., 2001), our findings reveal significant longitudinal declines throughout the brain involving multiple selected brain regions and both gray and white matter. Previous cross-sectional imaging studies, primarily using older imaging techniques, have yielded inconsistent results regarding differential age effects on gray versus white matter (Pfefferbaum et al., 1994; Raz et al., 1997; Guttmann et al., 1998). In a voxel-based analysis of high-resolution MR images from 465 individuals ranging in age from 17 to 79 years, Good and colleagues (2001) reported cross-sectional declines in global gray but not white matter volumes during adulthood. However, this study included few individuals over age 65 years. Using high-resolution MR images and a validated approach to image processing, we previously reported cross-sectional age effects for both gray and white matter volumes in adults aged 59 years and older (Resnick et al., 2000). Consistently, our present longitudinal results from serial MRI evaluations show 4 year tissue loss for both gray and white matter even in the very healthy subgroup of older adults. Although there was a trend for greater longitudinal tissue loss in white compared with gray matter, this difference was not statistically significant.
Rates of tissue loss were similar in men and women and in older and younger adults. In contrast, the rates of increase in ventricular volume, reflecting central brain atrophy, were significantly greater in older compared with younger individuals. Although we (Resnick et al., 2000) and others (Yue et al., 1997) have observed sex differences in V-CSF in older adults, with older men having larger ventricles than older women, trends toward sex differences in rates of V-CSF enlargement did not reach significance when adjusted for baseline ventricular volume. Although some studies have suggested that men may show earlier increases in ventricular size (Kaye et al., 1992), the magnitude and age at which sex differences appear remain unclear. We have begun enrolling younger BLSA participants into our neuroimaging study to investigate the age at which rates of brain atrophy accelerate in both men and women.
Although tissue loss was distributed across gray and white matter, analysis of lobar regions and voxel-based comparisons of local changes revealed regional patterns of vulnerability to age-related tissue loss. Consistent with other studies and our own cross-sectional findings on lobar volumes of gray and white matter, frontal and parietal appeared more vulnerable than temporal and occipital lobes. Voxel-based analyses of local regions provided complementary information and indicated that cingulate, insular, orbital, and inferior frontal cortex, and, to a lesser extent, mesial temporal regions showed longitudinal changes in gray matter. Relative vulnerability of insular and cingulate regions to age-related gray matter loss is consistent with the cross-sectional voxel-based analysis of Good and colleagues (2001), but our observations of modest longitudinal volume loss in mesial temporal structures is contrary to their report of relative preservation of tissue in these regions. Differences in age distributions for the two samples may account in part for these discrepancies. Region-based analyses of hippocampal volumes have also yielded differing results across studies, although recent longitudinal investigations of older adults show small but significant tissue loss with age (Jack et al., 1998; Mueller et al., 1998).
The local pattern of gray matter tissue loss observed in our study of older adults is intriguing in light of the staging by Braak and Braak (1997) of the deposition of amyloid in a nonselected series of autopsy brains. Initial pathology appears in the basal neocortex, including perirhinal and orbital cortex, and next spreads into adjacent neocortical association areas and the hippocampal formation, followed finally by its appearance in primary neocortical areas. Because amyloid deposition increases as a function of age, the neurotoxic consequences of amyloid may contribute to our observations of a regional pattern of gray matter tissue loss. Longitudinal declines in local white matter volumes were more widespread throughout the brain, most likely reflecting demyelinating changes in older individuals (Wiggins et al., 1988; Svennerholm et al., 1997). There was a notable hemispheric asymmetry in white matter volume loss in the temporal lobe, with greater left compared with right tissue loss.
One important limitation of our analysis of local gray and white matter changes is that there is greater sensitivity for detection of age effects in regions with more accurate stereotaxic transformation. Registration errors limit our ability to detect change in voxel-based analyses, and these difficulties will be most pronounced in regions of high cortical variability. Recent progress in the development of new algorithms for elastic deformation (Davatzikos et al., 2001; Shen and Davatzikos, 2001) will result in substantial improvement in registration accuracy and will enhance identification of change in regions of greater anatomic variability. The next phase of our analysis will use these new methods for detection of more highly localized age effects.
Nevertheless, the current approach identified substantial magnitudes of age-related tissue loss. Annual rates of cerebral tissue loss were 5.4 cm3 (0.5% per year) and of V-CSF increase were 1.4 cm3 (4% per year), with changes over the 4-year interval of 21.6 and 5.6 cm3, respectively. This volume loss cannot be explained by disproportionate changes in a limited number of individuals. Inspection of Figure 1, top and bottom, indicates that, against a background of highly stable measurement, longitudinal decreases in brain tissue volume and increases in V-CSF occur across almost all individuals in this age range. Although some argue that any tissue loss reflects pathological changes associated with preclinical dementia rather than normal aging, the uniformity of our findings across individuals argues against this interpretation unless all are in a preclinical stage of dementia. Thus, our data provide normative values against which potential pathological increases in rates of change can be evaluated. However, it should be cautioned that some of these individuals will ultimately develop dementia. We would hypothesize that those showing the fastest rates of change in mesial temporal and orbital frontal regions are more vulnerable to disease, given our observations of a regional pattern of age-related gray matter tissue loss and the distribution of progression of neuropathology associated with Alzheimer's disease (Braak and Braak, 1997). Thus, heightened vulnerability to disease may be indicated by accelerated change in specific regions against a background of age-related tissue loss.
Although our findings indicate that most older adults show some tissue loss over time, there is substantial variability in the magnitude of this change. The trend toward reduced volume loss in the very healthy subsample suggests that brain atrophy may be reduced in individuals who remain medically and cognitively healthy. Our sample is composed of relatively healthy individuals, and they have shown, on average, little cognitive change over this initial 4 year interval. However, with continued longitudinal follow-ups we expect to detect cognitive change and impairment in some portion of this aging sample. These follow-up studies will determine the clinical relevance of the observed brain changes and will identify which brain regions are associated with cognitive and other behavioral changes. There is already substantial evidence that loss of mesial temporal lobe tissue, particularly in hippocampus and entorhinal cortex, is associated with memory impairment and the development of Alzheimer's disease (Convit et al., 1997;Petersen et al., 2000). Our findings indicate that other brain regions, e.g., orbital-frontal and insular cortex, also show significant longitudinal tissue loss and may predict other cognitive and functional impairments in elderly individuals. Finally, our findings from in vivo MRI studies can help direct more focused neuropathological studies of specific brain regions. Such correlative neuropathological studies will be critical in elucidating the cellular basis of thesein vivo imaging findings and will help clarify the apparent paradox between volume loss observed on MRI and reports of minimal neuron loss with aging.
Footnotes
We gratefully acknowledge the assistance of Cynthia Wursta in image processing, Dr. Dongrong Xu and Xiadong Tao in preparation of three-dimensional displays of results, Beth Nardi for study coordination, and the Baltimore Longitudinal Study of Aging volunteers for their continued participation.
Correspondence should be addressed to Dr. Susan M. Resnick, Laboratory of Personality and Cognition, Box 03, National Institute on Aging, 5600 Nathan Shock Drive, Baltimore, MD 21224-6825. E-mail:susan.resnick{at}nih.gov.


