

Abstract
Neuronal nicotinic acetylcholine receptors (nAChRs) belong to a family of ligand-gated ion channels that play important roles in central and peripheral nervous systems. The subcellular distribution of neuronal nAChRs has important implications for function and is not well understood. Here, we analyzed the targeting of two major types of neuronal nAChRs by expressing epitope-tagged subunits in cultured hippocampal neurons. Surprisingly, the α7 nAChR (α7) and α4/β2 nAChR (α4β2) displayed distinct patterns of expression, with α7 targeted preferentially to the somatodendritic compartments, whereas α4β2 was localized to both axonal and dendritic domains. When fused to CD4 or IL2RA (interleukin 2 receptor α subunit) proteins, which are normally distributed ubiquitously, the M3–M4 intracellular loop from the α7 subunit promoted dendritic expression, whereas the homologous M3–M4 loop from the α4 subunit led to surface axonal expression. Systemic screening and alanine substitution further identified a 25-residue leucine motif ([DE]XXXL[LI]) containing an axonal targeting sequence within the α4 loop and a 48-residue dileucine and tyrosine motif (YXXØ) containing a dendritic targeting sequence from the α7 loop. These results provide valuable information in understanding diverse roles of neuronal nAChRs in mediating and modulating synaptic transmission, synaptic plasticity, and nicotine addiction.
Introduction
Nicotinic acetylcholine receptors (nAChRs) are pentameric membrane proteins that form cation-selective ion channels. There are two broad classes of nAChRs based on their general location: muscle nAChRs and neuronal nAChRs. Five genes coding for muscle nAChR subunits (α, β, δ, ε, and γ) and 11 genes coding for neuronal nAChRs (α2–α7, α9–α10, and β2–β4) have been identified so far in mammalian organisms (Sargent, 1993; Lukas et al., 1999; Corringer et al., 2000).
Neuronal nAChRs are present on many cells in the central and peripheral nervous systems. These receptors play important physiological roles and have been implicated in disease states such as Alzheimer's disease and nicotine addiction (Dani and Heinemann, 1996; Role and Berg, 1996). Structurally, neuronal nAChRs are composed of various pentameric combinations of 11 subunits with distinct pharmacological properties and anatomical localizations (Sargent, 1993). At the subcellular level, neuronal nAChRs may be localized in many parts of the cells, including cell bodies, presynaptic terminals, and postsynaptic sites (Role and Berg, 1996; Wonnacott, 1997; Dajas-Bailador and Wonnacott, 2004). Although physiological functions of neuronal nAChRs depend critically on their locations in specific regions of the neuron, little is known about the subcellular distribution of neuronal nAChRs, and even less is known about the mechanisms responsible for their assembly and targeting process.
We chose to study neuronal nAChRs containing either the α7 subunit (α7) or combinations of the α4/β2 subunits (α4β2), because they are the most abundant in the brain and because they participate in important processes, such as synaptic transmission, cognitive function, gene expression, and drug addiction (Dani and Heinemann, 1996). Although the subject has been pursued intensively in the past, the subcellular location of α7 remains elusive and controversial. Electrophysiological and immunochemical evidence supports a mainly presynaptic role and location for α7 at synapses (McGehee et al., 1995; Gray et al., 1996; Fabian-Fine et al., 2001; Jones and Wonnacott, 2004), although other evidence suggests that α7-containing nAChRs are also concentrated to somatodendritic and postsynaptic locations (Alkondon and Albuquerque, 1993; Frazier et al., 1998b; Hefft et al., 1999; Levy and Aoki, 2002; Khiroug et al., 2003). The subcellular distribution of α4β2 is also poorly understood. According to functional and immunochemical studies, α4β2 may be present at presynaptic locations (Jones et al., 2001; Zoli et al., 2002; Salminen et al., 2004) and postsynaptic/somatodendritic locations (Alkondon et al., 1999; Arroyo-Jiménez et al., 1999; McQuiston and Madison, 1999; Nashmi et al., 2003). Despite these findings, the question of how α4β2 receptors are expressed remains unclear. In fact, it is not known whether α4β2 may coexist in both presynaptic and postsynaptic locations in the same cell.
Studies of the distribution and function of the neuronal nAChR have been hindered by the lack of subunit-specific antibodies (Herber et al., 2004) and the low expression of endogenous receptors in the brain. The complexity of the brain structure further prevents precise mapping of neuronal nAChRs in a single neuron. To circumvent these problems, we expressed tagged receptors in primary hippocampal cultures. Because neurons in such cultures develop morphological polarity in vitro and because their neurites are arrayed essentially in two dimensions at relatively low densities, compared with the densely packed condition in the brain, hippocampal cultures were widely used for examining polarized expression of neuronal membrane proteins (Craig and Banker, 1994). The presence of at least two subtypes of neuronal nAChRs on hippocampal cultures, as demonstrated by electrophysiological studies (Alkondon and Albuquerque, 1993) and immunohistochemical studies (Zarei et al., 1999; Liu et al., 2001; Kawai et al., 2002), further suggests that these cultures can be applied to identify conditions that control the distribution of nAChRs within neurons. In this study, we demonstrate that neuronal nAChRs composed of different subunits are expressed with distinct patterns on the membrane of cultured neurons. We further identified an axonal targeting motif within the α4 loop and a dendritic targeting motif from the α7 loop. These findings may help to elucidate cellular mechanisms involved in the precise targeting of nicotinic receptors, a prerequisite for their proper physiological functions.
Materials and Methods
Molecular biology.
Rat α7, α4, and β2 nAChR subunits were each tagged by adding hemagglutinin (HA) or green fluorescent protein (GFP) at their C terminals. All new restriction sites were generated by PCR mutagenesis with the QuikChange protocol (Stratagene, La Jolla, CA). nAChR–HA and nAChR–GFP constructs were expressed in the mammalian expression vector pcDNA3 (Invitrogen, Carlsbad, CA) or pEGFP (Clontech, Mountain View, CA). The human interleukin 2 receptor α subunit (IL2RA) coding sequence was amplified by PCR from the pMLSV-N1/N4-s expression vector (American Type Culture Collection, Manassas, VA) and was further subcloned into pcDNA3. Dr. Gary Banker (Oregon Health & Science University, Portland, OR) kindly provided transferrin receptor (TfR)–GFP. Postsynaptic density-95 (PSD-95)–GFP was provided by Dr. David Bret (University of California, San Francisco, CA). CD4 construct was provided by Dr. Lily Jan (University of California, San Francisco, CA). Tau–GFP was provided by Dr. John Thomas (The Salk Institute, La Jolla, CA), and GFP–NMDA receptor 1 (NR1) was provided by Dr. Stefano Vicini (Georgetown University, Washington, DC).
Cell culture preparation, DNA transfection, and protein staining.
Hippocampal neurons from postnatal day 0 rats were cultured using standard techniques. After ∼1 week in culture, cells were transfected using the calcium phosphate method. To detect proteins expressed on the cell surface, living cells were incubated with primary antibody diluted in culture medium for 10–15 min at room temperature, fixed (4% paraformaldehyde and 4% sucrose for 20 min), and processed for additional immunostaining. To detect total proteins, cells were fixed before permeabilization (1.5% Triton X-100 in PBS buffer) and immunostaining. To detect internalized proteins, live neurons were incubated with primary antibody for 30 min at 37°C, chilled in 4°C TBS to stop endocytosis, and then exposed to 0.5 m NaCl/0.2 m acetic acid, pH 3.5, for 4 min on ice to remove surface-bound antibody. Cultures were subsequently rinsed, fixed, and permeabilized, followed by secondary antibody staining of internalized proteins. Antibodies/probes were used as follows: mice anti-HA (Covance, Princeton, NJ); rabbit anti-HA (Santa Cruz Biotechnology, Santa Cruz, CA); rabbit anti-GABA (Sigma-Aldrich, St. Louis, MO); chicken anti-GFP antibody (Clontech); rabbit anti-synapsin (Millipore, Billerica, MA); anti-PSD-95 monoclonal (Affinity BioReagents, Golden, CO); anti-CD4 monoclonal (Caltag Laboratories, South San Francisco, CA); anti IL2RA monoclonal (Covance); anti-microtubule-associated protein 2 (MAP2) monoclonal (Sigma-Aldrich); rabbit anti-MAP2 (Millipore); rabbit anti-neurofilament (Millipore); Alexa 488 α-bungarotoxin (Invitrogen, Eugene, OR); Alexa dye-labeled secondary antibodies (Invitrogen); and cyanine 3 (Cy3)- and Cy5-labeled secondary antibodies (Jackson ImmunoResearch, West Grove, PA).
Image analysis and processing.
Neurons were imaged on an LSM 510 microscope (Zeiss, Thornwood, NY). Each cell was imaged as a stack of optical sections, 1 μm in depth apart. The cell body was approximately in the center of each image. All calculations were performed on compressed images. All measurements were made with NIH ImageJ software. VolumeJ from the BIJ plugin packages was installed to ImageJ for three-dimensional (3D) reconstruction. The CorrelationJ 1e and JACoP plugins were used to calculate the overlap coefficient.
We used several methods to distinguish axons and dendrites. To facilitate morphological distinctions, GFP was coexpressed along with neuronal nAChRs to trace and visualize neurites. Previously defined morphological criteria were applied to distinguish neurites as axons or dendrites (Dotti et al., 1988). For example, dendrites have irregular contours, taper gradually, and branch at relatively acute angles. Axons, in contrast, display a smoother contour, have a relatively even diameter along their course, and extend much farther away from the cell body. Among these traits, particularly valuable in our study is the distinction that all of the long processes in the hippocampal culture represent axons (Dotti et al., 1988). This distinction was confirmed in our own experiments. We examined >30 GFP-transfected cells. In every case, neurites extending at least 250 μm from the cell body corresponded to axons, based on their negative immunostaining of MAP2. In this study, we identified a neurite as an axon only when it extended at least 250 μm from the cell body and also fitted other morphological distinctions described above (an example was provided in supplemental Fig. 5G–J, available at www.jneurosci.org as supplemental material). In addition to morphological criteria, axons and dendrites were further identified in some experiments based on a differential distribution of MAP2 (a dendritic marker) (supplemental Fig. 5A–F, available at www.jneurosci.org as supplemental material) and neurofilament (an axonal marker) (see Fig. 4). Dendritic protrusions were classified into two broad categories, spines and filopodia, based on criteria defined previously (Papa et al., 1995; Hering and Sheng, 2001). Briefly, a filopodia-like structure was identified if it was >2 μm in length with a base wider than the tip and did not terminate in enlarged heads, which is typical for spines.
Xenopus oocyte preparation, cDNA injection, and whole-cell current recording.
Standard protocol was used for oocyte preparation. Subunit cRNAs were synthesized in vitro (Message Machine; Ambion, Austin, TX) from linearized plasmid templates. Whole-cell currents were measured at room temperature, 1–2 d after RNA injection, using a GeneClamp 500 amplifier (Molecular Devices, Union City, CA) in a standard two-microelectrode voltage-clamp configuration. Oocytes were clamped between −40 and −65 mV and superfused in ND96 containing 1.8 mm CaCl2 and 1 μm atropine.
Results
C-terminally tagged receptors are expressed at the surface of transfected neurons and are capable of forming functional channels
To facilitate labeling, we first tagged the neuronal nAChRs by adding HA or GFP to their C terminals. Based on the topology of the receptor, tags at the C terminal are less likely to interfere with receptor trafficking than insertions at the N-terminal or intracellular loop domains. We confirmed that tagged neuronal nAChRs were capable of forming functional channels with biophysical properties similar to those of wild-type receptors when expressed in Xenopus oocytes (Fig. 1A–D). Surface expression of tagged receptors could not be detected in human embryonic kidney (HEK) cells (data not shown), although internal expression was visualized by immunofluorescence and detected by Western blot analysis (data not shown).

Tagging the receptors at C termini does not affect function and assembling of neuronal nAChRs. A–D, Representative examples of nicotine-induced currents from oocytes expressing wild-type α4β2 (A), α4–HA/β2–HA (B), wild-type α7 (C), and α7–HA (D). Voltage clamping was performed 24 h after injecting RNA into Xenopus oocytes. E–J, Surface staining of recombinant α7 is consistent with α-bungarotoxin labeling. Hippocampal neurons were transfected with α7–HA at 8 DIV and stained at 12 DIV. E, Surface expression of recombinant α7 stained by HA antibody. F, Surface expression of α7 stained by α-bungarotoxin (a-BGT). G, Same view as E and F. Cell nuclei were labeled with 4′,6′-diamidino-2-phenylindole dihydrochloride (DAPI) to show that one neuron of many from this view was transfected and that the surface expression level of endogenous α7 from nontransfected cells in this view was below detection using fluorescence-labeled α-bungarotoxin in our experiments. H, Overlay of E and F shows the consistent labeling of surface α7 by HA antibody and α-bungarotoxin, except for occasional nonspecific labeling of apparent cell debris by Alexa 488–α-bungarotoxin. I, Enlarged boxed region from H. Ia, HA stain. Ib, a-BGT stain. Ic, Overlay of Ia and Ib. J, Immunofluorescence intensity profiles along the 100 μm line in H were measured from the original TIFF (tagged image file format) images with NIH ImageJ. Scale bars: (in G) E–H, 50 μm; I, 15 μm.
We transfected cultured primary neurons with tagged α7 using the CaPO4 method. In marked contrast to HEK cells, neuronal surface expression of recombinant α7 was readily detectable by immunofluorescence (Fig. 1E–J). Furthermore, α7 surface expression detected by antibody staining resembled staining by α-bungarotoxin (Fig. 1E–J), which binds with high affinity to assembled α7 receptors (Couturier et al., 1990; Kawai et al., 2002). Therefore, adding an epitope tag does not appear to interfere with receptor assembly. However, HA antibody staining yielded a higher signal/background ratio and better spatial resolution and was more suitable for examining the subcellular distribution in our experiments (Fig. 1J).
Polarized expressions of α7 and α4β2 receptors in hippocampal neurons
We first examined the axonal/somatodendritic distribution of neuronal nAChRs in cultured hippocampal neurons. GFP was coexpressed along with the tagged receptors to visualize cell morphology. To avoid labeling intracellular receptors that might confound our results, we initially stained surface receptors only by applying antibody to live neurons for a short period of time at room temperature (see Materials and Methods). The distributions of expressed receptors were examined in transfected neurons that had clearly identifiable axons and dendrites (see Materials and Methods). Surprisingly, surface α7–HA immunostaining was detected almost exclusively in dendrites (Fig. 2B). Much lower surface expression was detected at proximal axonal regions (within ∼100 μm from the cell body), but the signal decreased sharply along the axonal process (Fig. 2B, arrows). Weak axonal immunoreactivity away from the cell body (beyond ∼200 μm) was detected in 5% of the transfected neurons (10 independent transfections) (Fig. 2E). In contrast, surface α4β2 was localized to both axons and dendrites (Fig. 2D) in all of the transfected neurons (Fig. 2E). As expected, surface expression was not detectable in cells transfected with α4 or β2 alone (data not shown).
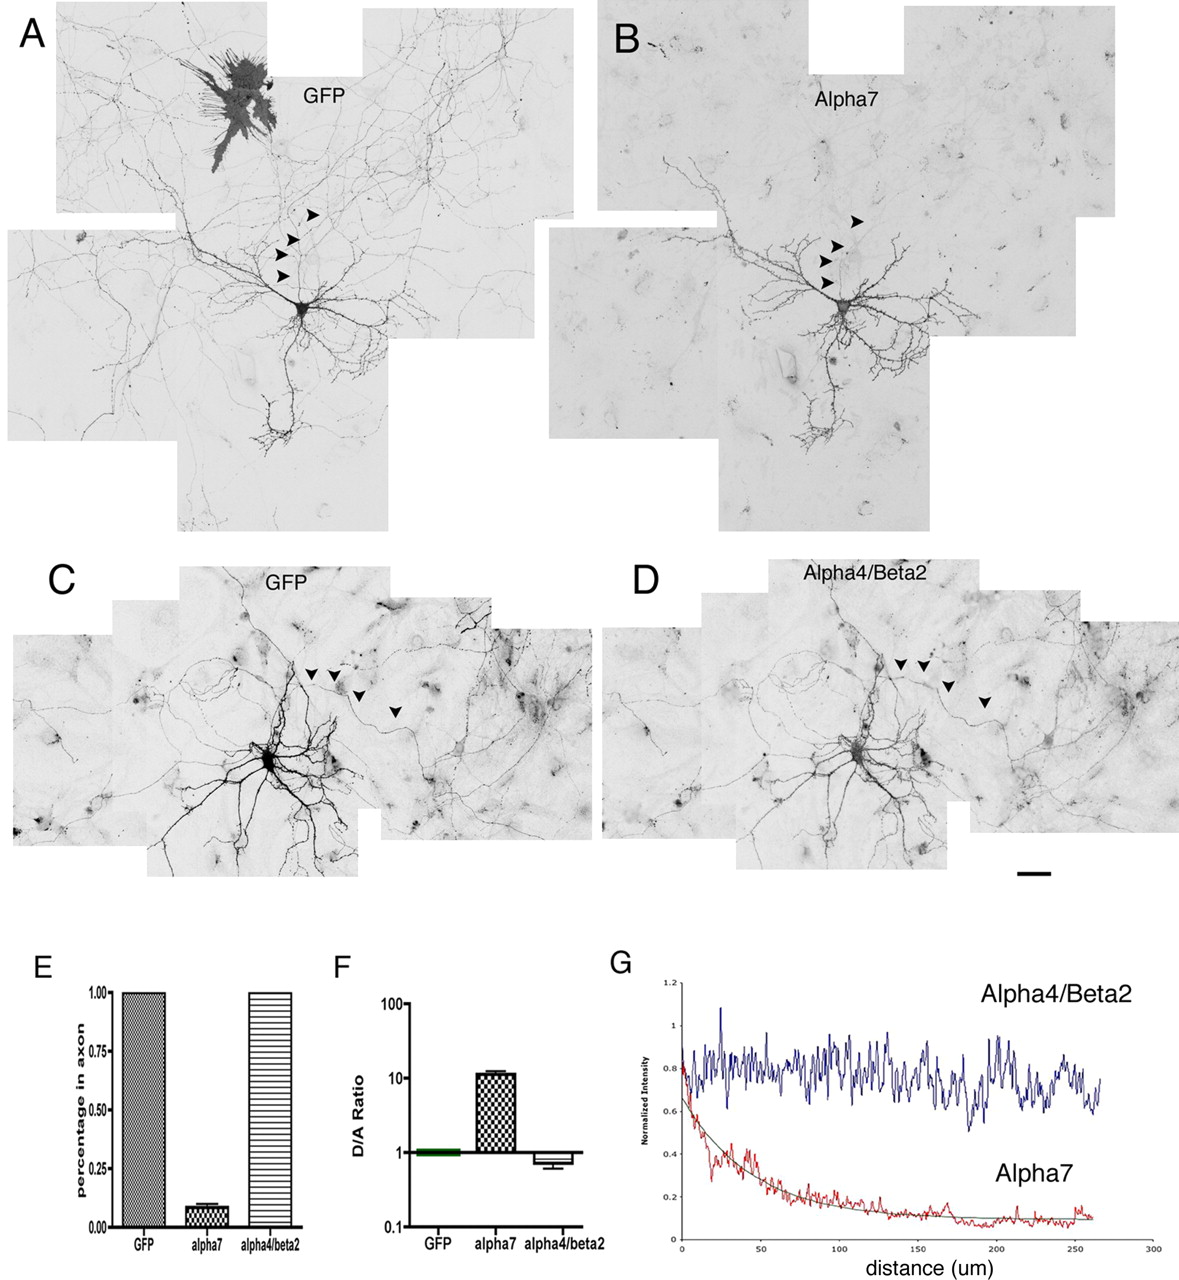
Differential targeting of α7 and α4β2 expressed in cultured hippocampal neurons. A–D, Neurons were transfected at 8 DIV with α7–HA plus GFP. Surface receptor was labeled at 16 DIV with HA antibody. GFP fluorescence was used to outline neuronal morphology. Multiple images were taken from the LSM 510 confocal microscope and assembled to obtain a larger view. Unlike GFP (A), surface α7 (B) was targeted to dendrites and excluded from axons (arrowheads). Low surface expression of α7 was detected at initial regions of axons. This signal sharply decreased along the axonal process. Also note that surface expression of α7 in transfected glia cells (A, top left) was below detection in B. Surface expression of the α4β2 receptor (D) was localized to both soma-dendrites and axons in the transfected neuron also expressing GFP (C). Scale bar, 50 μm. Note that the surface α4β2 level was considerably lower than that of α7. Higher amplification in microscope scanning was necessary to acquire α4β2 imaging. E–G, Quantitative analysis of receptor polarization in neurons. E, Percentage of cells expressing recombinant proteins in axons. Unlike GFP and α4β2, surface expression of α7 at axons ∼200 μm away from the cell body was detected in only 5% of transfected cells (10 independent transfections). F, Normalized ratios of average fluorescence intensity for dendrites versus axons (see methods in supplemental Fig. 1, available at www.jneurosci.org as supplemental material). G, Averaged intensity profiles of surface α4β2 and α7 along axons. The method used is described in supplemental Figure 1 (available at www.jneurosci.org as supplemental material). The decay constant for α7 traveling along axons was estimated to be 45.6 μm. There is no reduction of α4β2 signal along axons. Error bars are SEM.
Quantitative examination of protein polarization is complicated by differences in the diameters of axons and dendrites, which result in a higher intensity in dendrites versus axons, even for proteins that are expressed ubiquitously, such as GFP. To more accurately assess receptor polarization, we used two methods for quantitative analysis (supplemental Fig. 1, available at www.jneurosci.org as supplemental material).
First, coexpressed GFP was used for normalization, as described previously (Rivera et al., 2003; Sampo et al., 2003). A value for normalized ratio of dendrite-to-axon expression (D/A) was derived by dividing the ratio of receptor density in dendrites versus axons by the corresponding ratio of GFP from the same cell (supplemental Fig. 1A–D, available at www.jneurosci.org as supplemental material). This normalized D/A ratio should reflect the extent of polarization expression more precisely. In our study, D/A value was calculated for at least 20 different cells for each construct. The average D/A value for α7 was 12.94 ± 0.68 (n = 20), indicating a preferential localization to the dendrite, significantly different from the D/A value for α4β2 (0.76 ± 0.069; n = 20; p < 0.001) (Fig. 2F).
Second, we used GFP to visualize the axonal processes, and we analyzed the surface expression of recombinant proteins along the axons (supplemental Fig. 1E–G, available at www.jneurosci.org as supplemental material). As seen in Figure 2B and supplemental Figure 1E (available at www.jneurosci.org as supplemental material), the intensity of surface α7 decreased drastically down the axons. In fact, such a decline fits well with single-exponential decay with a distance constant of 45.6 μm (n = 14) (Fig. 2G). Unlike α7, α4β2 surface expression level did not vary along axons (Fig. 2D,G).
It has been established that distinct mechanisms underlie specific targeting of neuronal membrane proteins (Silverman et al., 2001; Sampo et al., 2003). In the case of α7, the absence of axonal surface expression may arise from either the absence of axonal transport or the absence of subsequent membrane insertion and stabilization. To distinguish between these two possibilities, we used permeabilized cells to stain intracellular as well as surface proteins. If α7 was transported but not inserted into the membrane, then axonal staining would be expected in permeabilized cells. Instead, we observed a predominant dendritic localization of total α7 (supplemental Fig. 2D–F, available at www.jneurosci.org as supplemental material) (D/A, 12.4 ± 0.55; n = 20), similar to surface α7 (D/A, 12.94 ± 0.68; n = 20). Thus, selective transport is likely to account for polarized expression of α7, resembling the mechanism of dendritic targeting observed for Kv4.2 potassium channels (Rivera et al., 2003) and TfR–GFP (Silverman et al., 2001).
To more directly compare the expressions of α7 and α4β2 within one cell, we cotransfected GFP-tagged α7 (α7–GFP) and HA-tagged α4 and β2 into primary neurons. We used double labeling with antibodies to GFP and HA to visualize surface α7 and α4β2 simultaneously. Consistent with previous results, subcellular expression profiles of α7 and α4β2 in the same neurons were quite distinctive, with surface α7 localized preferentially to somatodendritic compartments, in contrast to surface α4β2, which was detected at both axons and dendrites (Fig. 3A–D). Even in dendrites in which both α7 and α4β2 were expressed, a fraction of α7 clusters did not colocalize with those of α4β2 (Fig. 3E–F) (Pearson's coefficient, r = 0.56 ± 0.04; n = 6). This result once again indicates that distinct targeting mechanisms are used for different nAChR subunits.

Direct comparisons of surface α7 and α4β2 in the same transfected neuron. A, B, Hippocampal neurons were cotransfected with α7–GFP and HA-tagged α4 and β2 (α4–HA/β2–HA) at 8 DIV. Surface α7 was stained by chicken anti-GFP antibodies, and surface α4β2 was stained by mouse anti-HA antibody at 16 DIV. Neurons were fixed and blocked before incubating with secondary antibody (Alexa 568-labeled goat anti-mouse and Alexa 647-labeled goat anti-chicken antibodies). Images were scanned from the LSM 510 confocal microscope. Pseudocolors were initially applied to represent surface signals of α7 (green) and α4β2 (red) before converting to gray channel. Multiple images were taken from the LSM 510 confocal microscope and were assembled to obtain a larger view. Surface α7 was mostly expressed in soma-dendrites; a faint signal can be detected at initial axonal regions, but it decreased below detection along the axons (A). Surface α4β2 was expressed at both axons and soma-dendrites (B). Arrowheads indicate axon regions. C, D, Intensity line profiles of α7 and α4β2 along axons from the transfected neuron shown in A and B. Arrows mark the start of blank regions. E, F, Neurons were transfected and stained similarly to those in A and B, except that staining was performed at 22 DIV. A neuron expressing both α7–GFP and α4–HA/β2–HA is shown in E. The boxed region from E is enlarged in F. Although α7 and α4β2 were both expressed in somatodendritic compartments, a large fraction of surface clusters from different receptors did not overlap (F). Scale bars: (in B) A, B, 100 μm; E, 30 μm; F, 10 μm.
Comparisons of surface nAChRs to neuronal subcellular markers
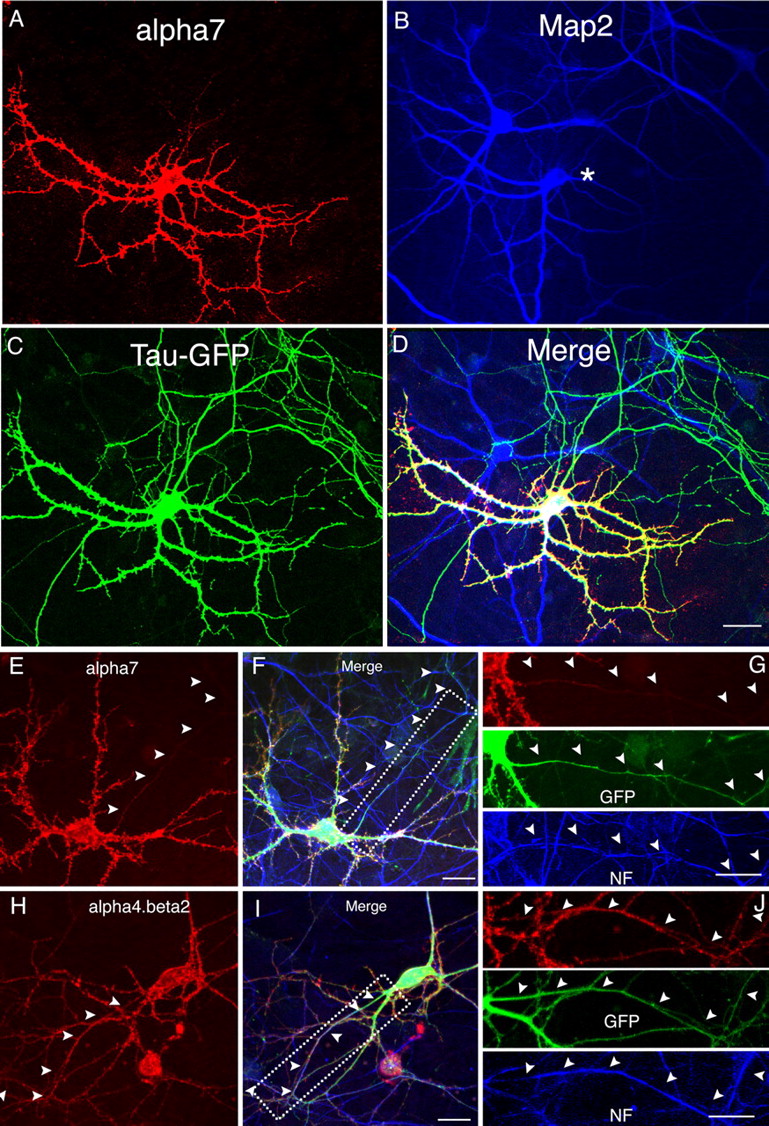
In addition to morphological criteria, we also used MAP2 staining and neurofilament staining to discriminate between soma-dendrites and axons. Consistent with previous conclusions, α7 was present within dendrites marked by MAP2 antibody (Fig. 4A,B, supplemental Fig. 5A–C, available at www.jneurosci.org as supplemental material) but was absent from axons labeled with neurofilament antibody (Fig. 4E–G). When coexpressed with other markers, α7 expression overlapped with TfR–GFP (supplemental Fig. 3A–C, available at www.jneurosci.org as supplemental material), a dendritic marker (Silverman et al., 2001), but not with Tau–GFP (Fig. 4A,C), a protein marker highly expressed in axons (Callahan et al., 1998). Altogether, these results confirmed that surface-expressed α7 was highly restricted to somatodendritic compartments. In contrast, α4β2 staining was found in axons labeled with neurofilament antibody (Fig. 4H–J) as well as dendrites labeled by MAP2 antibody (supplemental Fig. 5D–F, available at www.jneurosci.org as supplemental material). Using a different set of markers, α4β2 staining was found in both dendrites and axons, labeled by TfR–GFP (supplemental Fig. 3D–F, available at www.jneurosci.org as supplemental material) and Tau–GFP (supplemental Fig. 4D–F, available at www.jneurosci.org as supplemental material), respectively.

Comparison of α7 and α4β2 with dendritic and axonal markers. A–D, α7–HA was cotransfected with Tau–GFP into cultured neurons at 8 DIV and stained at 12 DIV. Surface α7 (A) was MAP2 positive (B) but did not overlap with Tau–GFP in axons (C). D, Merged images of A–C. The asterisk in B indicates the transfected neuron. E–G, HA-tagged receptor subunits were cotransfected with GFP into cultured neurons at 8 DIV. Neurons were triple labeled with surface α7 or α4β2 (red), GFP (green), and neurofilament (blue) at 12 DIV (F, I). Surface α7 (E) was mostly excluded from axons labeled by neurofilament antibody (F, G). In contrast, surface α4β2 (H) was found in neurofilament-positive axonal fibers (I, J). Boxed regions in F and I are shown with separated channels at higher magnification in G and J, respectively. Arrowheads mark axons. NF, Neurofilament. Scale bars: (in D) A–D, 50 μm; (in F, G, I, J) E–J, 25 μm.
Surface expression of nAChRs in hippocampal GABAergic neurons
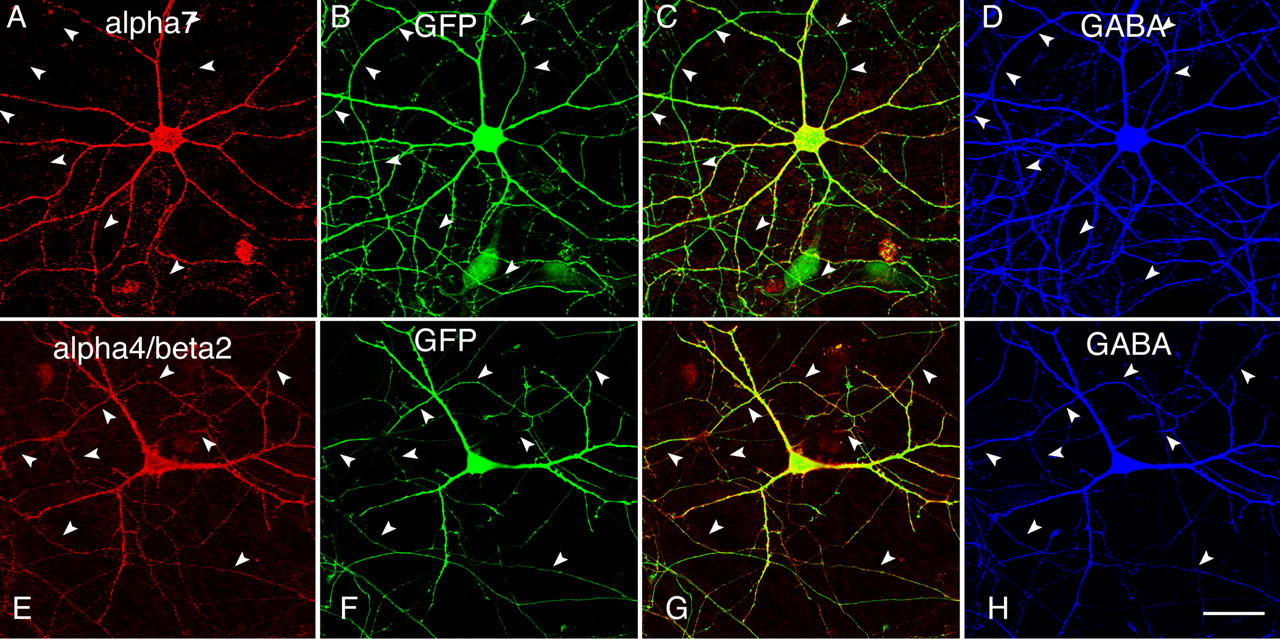
In the hippocampus, neuronal nAChRs are distributed on both the excitatory pyramidal neurons (McGehee et al., 1995; Gray et al., 1996) and the inhibitory GABAergic interneurons (Jones and Yakel, 1997; Frazier et al., 1998a; Alkondon et al., 2000; Khiroug et al., 2003). A large body of evidence indicates that neuronal nAChRs in the GABAergic neurons can modulate synaptic transmission and influence inhibitory activity in the brain (Alkondon et al., 1997; Frazier et al., 1998b; Ji et al., 2001). We next examined the distribution of receptors in GABAergic neurons (∼4–8% of the neurons in our preparation). Hippocampal cultures were stained with anti-GABA antibody for the identification of GABAergic neurons (Fig. 5D,H). Analysis of transfected GABAergic cells (>20 cells from multiple transfections) demonstrated the predominant surface expression of α7 in the somatodendritic compartment (Fig. 5A–D), compared with ubiquitous expression of α4β2 in both axons and dendrites (Fig. 5E–H). Thus, we found that the distribution of neuronal nAChRs was similar in both inhibitory and excitatory neurons.

Differential targeting of α7 and α4β2 in GABAergic neurons. A–D, Transfected GABAergic neuron triple labeled with surface α7 (A), GFP (B), and GABA (D). C, Merged A and B. Surface α7 was not detected in axons (arrowheads). E–H, Transfected GABAergic neuron triple labeled with surface α4β2 (E), GFP (F), and GABA (H). H, Merged E and F. Surface α4β2 resided in axons and dendrites of GABAergic neurons. Scale bar, 50 μm.
Synaptic locations of nAChRs in hippocampal neurons
Because neuronal nAChRs play important roles in synaptic transmission (McGehee et al., 1995; Gray et al., 1996; Mansvelder and McGehee, 2000; Ji et al., 2001), we next inspected the synaptic locations of α7 and α4β2 in cultured hippocampal neurons. We cotransfected HA-tagged α7 with postsynaptic marker PSD-95–GFP (Fig. 6). On neurons 12 d in vitro (DIV) in culture, the patches of α7 subunits on dendrites often colocalized with the postsynaptic marker PSD-95–GFP (Fig. 6A1–A3, arrows), in agreement with previous findings of the postsynaptic location of α7 (Liu et al., 2001; Kawai et al., 2002). Interestingly, α7 was also frequently observed at long necks and tips of the filopodia-like structures (Fig. 6A1, arrowheads), a phenomenon described previously from GABAergic neurons (Kawai et al., 2002). Because it is not always easy to distinguish filopodia from spines based on morphology standards, we also used glutamate receptor 1 (GluR1) staining, which was shown previously to form clusters almost exclusively at dendritic spines (Rao et al., 1998), as a marker. We found that the majority of PSD-95–GFP puncta were positive in α7 and GluR1 staining (arrows). However, at the tip or neck of thin structures that look like filopodia (arrowheads), only α7 staining was found, whereas both PSD-95 and GluR1 were absent or did not appear as punctate clusters (Fig. 6A1–A4). To determine whether the location of α7 in dendrites follows a developmental pattern, we examined its distribution from neurons with different days in culture. In confirmation of previous studies (Papa et al., 1995; Boyer et al., 1998), the fraction of filopodia-like structures decreased and the density of spine synapses increased as cultures matured (Fig. 6A2,B2,C2). Consistent with this time course, the distribution of α7 was also shifted to structures that showed concentrated clustering of PSD-95 and GluR1. The overall Pearson's coefficient of α7 to PSD-95–GFP increased from 0.71 ± 0.024 (n = 10; 12 DIV) to 0.78 ± 0.022 (n = 10; 17 DIV; p = 0.037; t test) and up to 0.82 ± 0.025 (n = 10; 22 DIV; p = 0.26; t test, 17 vs 22 DIV). Even at 22 DIV, when dendritic spines with distinct spiny heads were more evident (Fig. 6C2), α7 can still be seen in the few visible long filopodia. Together, these results confirm that α7 may be expressed at both mature synapses and filopodia-like structures in hippocampal neurons.

The locations of α7 at spines and filopodia-like structures. Shown are dendritic regions from hippocampal neurons cotransfected with α7–HA and PSD-95–GFP at 8 DIV. Cultures at 12 (A1–A4), 17 (B1–B4), and 22 (C1–C4) DIV were triple labeled with surface α7, PSD-95–GFP, and endogenous GluR1. Arrowheads label colocalized puncta of α7, PSD-95, and GluR1. Arrows point to locations at the tip or neck of filopodia-like structures at which α7 was present, but PSD-95 and GluR1 were not. Spine synapses were more evident in older neurons. The fraction of filopodia-like structures decreases progressively as the neurons mature. Consistent with this time course, α7 distribution was shifted to punctate clustering similar to that of PSD-95 and GluR1. The overall Pearson's coefficient of α7 to PSD-95 increased from 0.71 ± 0.024 (n = 10; 12 DIV) to 0.78 ± 0.022 (n = 10; 17 DIV; p = 0.037, t test) and farther to 0.82 ± 0.025 (n = 10; 22 DIV; p = 0.26, t test, 17 vs 22 DIV). Scale bars, 15 μm.
To further analyze the synaptic locations of α7, 3D reconstructions were performed from confocal image stacks. Surface-expressed α7 was often concentrated in discrete clusters within dendritic spines of mature neurons (Fig. 7C). Furthermore, α7 clusters usually were in close contact but not overlapped with presynaptic clusters labeled with anti-synapsin antibody (Fig. 7B,D) (Pearson's coefficient, r = 0.369; Manders' coefficients, M1 = 0.141, which represents the fraction of synapsin overlapping α7). (Note that calculation based on compressed images tends to overestimate the degree of overlapping. The actual overlapping coefficient is likely to be even smaller.) Finally, double labeling of tagged α7 (Fig. 7E,F, green) and endogenous PSD-95 (Fig. 7E,F, red) revealed a high degree of colocalization in mature neurons (22 DIV; note that PSD-95 puncta outside of α7 were from nontransfected cells). All of these results are consistent with the location of α7 at or close to postsynaptic sites.

Comparisons of recombinant α7 with endogenous synaptic markers. A–D, 3D reconstruction from image stacks scanned from a cell (22 DIV) transfected previously by α7 and GFP. α7 surface expression (C, red) was concentrated on spines (arrowheads) and often juxtaposed to presynaptic clusters labeled with anti-synapsin antibody (B, blue; D, merged). A small fraction of α7 puncta was also seen at filopodia-like structures (A, C, arrows) that usually do not have presynaptic counterparts (D). Matured mushroom-like spines are marked by arrowheads. E, F, Double labeling of neuron for surface-expressed α7 and endogenous PSD-95. 3D reconstruction (E) from boxed region in F showed colocalization of α7 (green) and endogenous PSD-95 (red). Image stacks were scanned from a cell (22 DIV) transfected previously by α7. Note that the PSD-95 antibody stained transfected and nontransfected cells. Scale bars: (in D) A–D, 10 μm; (in F) E, 20 μm; F, 40 μm.
We also examined possible synaptic locations of α4β2, in addition to α7 (Fig. 8). In the somatodendritic compartments, a number of α4β2-positive clusters were also apposed to endogenous presynaptic clusters labeled by anti-synapsin antibody (Fig. 8B,D), similarly to α7 (Fig. 8A,C). However, α4β2 clusters were also distributed with presynaptic clusters in axons (Fig. 8F), in contrast to the absence of α7 in these regions (Fig. 8E). Like α7 in dendrites (Fig. 8G), fractions of α4β2 clusters were also found to overlap with PSD-95–GFP clusters (Fig. 8H), with a degree of correlation not significantly different from that of α7 (Pearson's r = 0.67 ± 0.04 for α4β2, n = 8, 12–14 DIV; r = 0.71 ± 0.02 for α7, n = 10, 12–13 DIV; p > 0.05, t test; Pearson's coefficients were calculated by ImageJ with soma regions excluded for analysis).
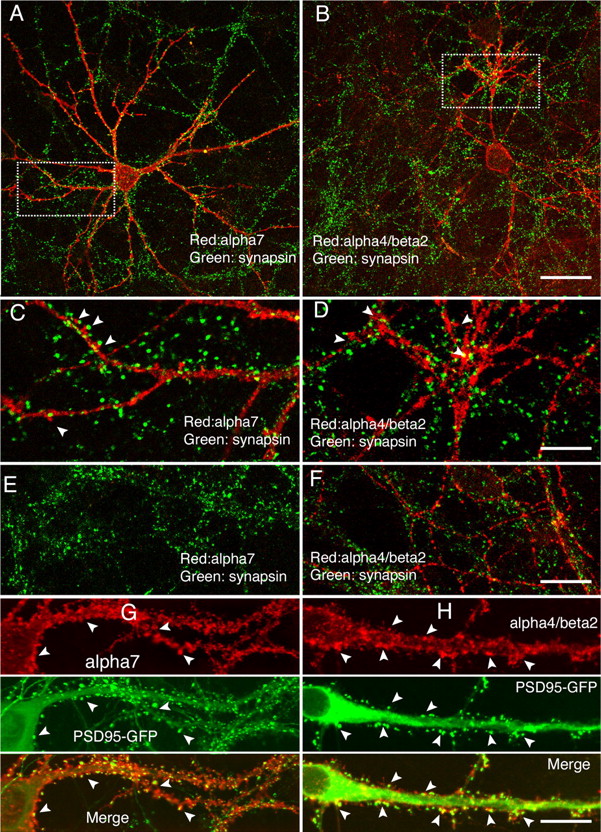
Synaptic locations of recombinant α4β2. A–F, Neurons transfected with tagged α7 (A) or α4β2 (B) were surface labeled with mouse anti-HA antibodies (red), followed by labeling with rabbit anti-synapsin antibodies at 16 DIV (green). C, D, Enlarged images from the boxed regions in A and B, respectively. Note that the clusters of α7 from the dendritic region were often in close contact with presynaptic clusters (C, arrowheads). Fractions of α4β2 clusters were also in close contact with presynaptic marker (D, arrowheads). Small regions ∼300 μm from the cell body in which axons were located were shown from α7-transfected cells (E) or α4β2-transfected cells (F). G, H, Neurons transfected at 8 DIV with tagged α7 (G) or α4β2 (H) plus PSD-95–GFP (middle) were surface labeled with anti-HA antibodies (top) at 14 DIV. A number of overlapped clusters were indicated by arrowheads (bottom). Within the somal area, PSD-95–GFP was observed in a perinuclear distribution, typical for intracellular proteins. Scale bars: (in B) A, B, 50 μm; (in D) C, D, 20 μm; (in F) E, F, 20 μm; (in H) G, H, 20 μm.
Finally, we cotransfected tagged α7 or α4β2 with presynaptic marker synaptophysin–GFP (Fig. 9). There is very little overlap between α7 and synaptophysin (Fig. 9A,B), other than in the cell bodies (Fig. 9A,B, inset), consistent with the absence of α7 in axons (Fig. 2). Both α4β2 and synaptophysin–GFP were expressed along axon fibers, although α4β2 was distributed more uniformly compared with synaptophysin–GFP (Fig. 9C,D). More than 60% of the synaptophysin–GFP clusters, the expression of which often associates with functional presynaptic compartments (Y. Zhu and C. F. Stevens, unpublished data), were colocalized with α4β2-positive clusters (Fig. 9E). Colocalization analysis also revealed a high degree of correlation between synaptophysin–GFP and α4β2 (Pearson's coefficient, r = 0.65 ± 0.06; n = 6 cells, >2000 clusters) (Fig. 9F).

Comparisons of α7 and α4β2 with synaptophysin–EGFP (enhanced GFP). Neurons were transfected with recombinant neuronal nAChRs plus synaptophysin–GFP at 8 DIV. Surface receptors were labeled with mouse anti-HA antibodies at 16 DIV. α7 (A) did not overlap with synaptophysin–GFP (B), except for cell bodies (inset). Both α4β2 and synaptophysin–GFP were expressed along axons, although α4β2 was distributed more uniformly (C) than synaptophysin–GFP (D). More than 60% of the synaptophysin–GFP clusters were colocalized with α4β2 (E; colocalized clusters were labeled in white). The correlation coefficient was further calculated using ImageJ (CorrelationJ 1e plugin; F).
M3–M4 loops contain subcellular targeting sequences
Sequences from several groups of membrane proteins have been identified to mediate dendritic or axonal targeting (Stowell and Craig, 1999; Ruberti and Dotti, 2000; Garrido et al., 2001; Gu et al., 2003; Rivera et al., 2003). It is thus natural to speculate that specific sequences act as signals within neuronal nAChRs to mediate subcellular targeting. We examined the M3–M4 intracellular loop for several reasons. First, primary sequences in the M3–M4 loop are the most diverse among different receptors (Le Novere et al., 1999; Corringer et al., 2000) (see Fig. 11C for sequence alignment). This may be consistent with the diversity of polarized expression observed for different receptors. Second, M3–M4 loops compose the largest cytoplasmic domain within neuronal nAChRs that is likely to interact with the machinery involved in the protein sorting, trafficking, and membrane insertion. Indeed, it has been demonstrated that the M3–M4 loop from chick α3 subunit targets this receptor to subdomains within individual synapses on developing chick ciliary ganglion (CG) neurons in vivo (Williams et al., 1998; Temburni et al., 2000).
We constructed a series of chimeras by swapping M3–M4 loops among the α4, α7, and β2 subunits. However, surface expression was not observed from cells expressing chimeras alone or in various combinations (data not shown). To determine whether M3–M4 loops contain subcellular localization motifs, we attached loop sequences to the C terminal of the CD4 protein, a transmembrane protein that localizes nonspecifically in neurons (see Fig. 10J) (Gu et al., 2003). Consistent with previous reports, surface expression of CD4 was not polarized in our study (D/A, 0.78 ± 0.10; n = 20) (Fig. 10A–C). The addition of the M3–M4 loop from α7 caused the resulting fusion protein, CD4–α7, to localize to the soma-dendrites (D/A, 6.52 ± 0.46; n = 20) (Fig. 10G–I). This was in marked contrast to the localization of CD4–α4 (D/A, 0.09 ± 0.015; n = 20) (Fig. 10D–F). The difference in the pattern of expression was significant (p < 0.001). The CD4–β2 was not expressed to the surface of transfected neurons (data not shown). In summary, these results demonstrate that the M3–M4 loop can function out of the context of neuronal nAChRs to mediate axonal/dendritic targeting and strongly suggest that M3–M4 loops are involved in the targeting of neuronal nAChRs.

M3–M4 loops from nAChR subunits confer signals for subcellular targeting. Neurons were transfected at 8 DIV with CD4 (A–C), CD4–α4 (D–F), and CD4–α7 (G–I) plus GFP. Surface CD4 and CD4 fusion proteins were stained 4 d later with anti-CD4 antibody. GFP signals (left) labeled axons and dendrites of transfected cells. A–C, CD4 surface expression was not polarized. Arrowheads indicate axons. D–F, The M3–M4 loop from α4 promoted axonal distribution of fusion protein. Arrows indicate soma-dendrites. G–I, Ubiquitously expressed CD4 became polarized to dendrites after fusion with the M3–M4 loop from α7. Scale bars: (in F, I) A–I, 40 μm. J, Schematic representation of CD4 and the CD4/M3–M4 loop fusion proteins. K, Normalized D/A ratios of CD4 and the CD4/M3–M4 loop fusion proteins. Error bars are SEM.
Identifying sequence motifs that target neuronal nAChRs to dendrites and axons
To further identify the critical determinants in the α4 and α7 loops, a series of C-terminal or N-terminal truncations or internal fragments of M3–M4 loops from the α4 (Fig. 11A) and α7 (Fig. 11B) subunits were fused to another nontargeted protein, IL2RA (IL2RA was chosen instead of CD4 to facilitate screening because of its higher surface expression in our system). Positions of amino acids are based on the sequence alignment of the loop sequences shown in Figure 11C. All IL2RA fusion proteins were transfected into cultured hippocampal neurons. Ratios of polarized expression were determined by comparing with coexpressed GFP (Fig. 11A,B, right columns). Analysis of surface distributions from these constructs identified a 25-residue axonal targeting sequence within the α4 loop (residues 30–54) (Fig. 11A) and a dendritic targeting sequence from the α7 loop (residues 33–80) (Fig. 11B). The amino acid sequences for both motifs are illustrated in Figure 11D.

Identification of motifs in M3–M4 loops from the nAChR α4 and α7 subunits that mediate targeted polarization in neurons. A, B, Series of C-terminal or N-terminal truncations or internal fragments of M3–M4 loops from α4 (A) or α7 (B) were fused to IL2RA. Red, black, and blue bars indicate “polarized surface expression,” “nonpolarized” (NP), and “not available” (NA), respectively. Relative ratios of polarization for each construct were also represented by + symbols, with +++ representing the most polarized and + representing slightly polarized. Low surface expression was observed from some constructs (A, B, right column); for most of these constructs, surface polarization ratios were labeled as NA because of the difficulties in image analysis. C, Sequence alignment of M3–M4 loops from α4, α7, and β2. The axonal sequence in α4 is highlighted in yellow, the dendritic signal of α7 is highlighted in pink, and the first 30 aa from β2, which abolishes surface expression, is highlighted in blue. D, Identified targeting sequences. Analysis of the surface distribution from fusion proteins defined a 25-residue sequence within α4 loops that governed axonal expression (residues 30–54) and a 48-residue segment from the α7 loop (residues 33–80) that was necessary for dendritic expression. Potential key targeting motifs within the identified segments are underlined, with the consensus motif marked above or below.
Multiple signals that consist of short sequences of amino acid residues have been identified previously to mediate membrane sorting and endocytosis (Bonifacino and Traub, 2003). Interestingly, some of these signals have also been implicated in basolateral targeting in polarized epithelial cell and axon/dendrite targeting in neurons (Rivera et al., 2003). Close examination of targeting sequences revealed several potential motifs, such as a leucine-based signal and a tyrosine-based signal (Fig. 11D). To test the hypothesis that these short motifs might be involved in the targeted expression of the receptor, mutations were introduced to either α7–HA or CD4–α4, which we found to be the most polarized to either dendrites or axons, respectively (Figs. 2F, 10K). Three amino acid changes (LIE/AAA) in the leucine-based motif ([DE]XXXL[LI]) from the α4 axonal targeting sequence (Fig. 11D, top) almost abolished axonal targeting of CD4–α4 (Fig. 12A,C). In contrast, mutation of the FW sequence (FWP/AAA) had little effect (Fig. 12C). The α7 dendritic targeting sequence (Fig. 11D, bottom) comprises a stretch of 6 aa (LLYIGF) that may include both dileucine and YXXφ motifs. Mutating three critical residues in these motifs (LLY to AAA) led to a fivefold decrease in D/A ratio (Fig. 12B,D), whereas mutations in the diarginine sequence (PRR/AAA) had little influence on D/A ratio (Fig. 12D). Furthermore, mutations within either the YXXφ motif (YIG/AAA and IGF/AAA) or the dileucine motif (LL/AA mutant) all resulted in reductions of D/A ratios (Fig. 12D), suggesting that both motifs participated in dendritic targeting of α7, although the YXXφ motif might play more important roles, because larger decreases in D/A ratios were observed from the YIG/AAA and IGF/AAA mutations than from the LL/AA mutation (Fig. 12D).

Identifications of key residues within the axonal and dendritic targeting motifs. A, Neurons were transfected at 8 DIV with CD4–α4 (top) and CD4–α4–LIE/AAA mutant (bottom) plus GFP (left). GFP signals labeled axons and dendrites of transfected cells. Surface CD4 and CD4 fusion proteins were stained 6 d later with anti-CD4 antibody (right). Note the absence of signals in soma-dendrites from CD4–α4 but not LIE/AAA mutants. B, Neurons were transfected at 8 DIV with α7–HA (top) and α7–LLY/AAA mutant (bottom) plus GFP (left). Surface receptors were stained 4 d later with anti-HA antibody (right). Note the absence of axonal signals from wild-type α7 but not LIE/AAA mutant. C, The dendrite/axon ratio of CD4–α4 was affected by the LIE/AAA mutation but not the FWP/AAA mutation. D, The dendrite/axon ratio of α7 was affected by mutations introduced in the dileucine and YXXφ motifs but not by the PRR/AAA mutation. ***p < 0.001; ** p < 0.05; t test. Error bars are SEM.
Axonal targeting signal in the α4 loop is inactive in the assembled α4β2 complex
Although the M3–M4 loop from α4 was able to confine nonpolarized proteins (CD4 and IL2RA in our experiments) exclusively to the axonal surface (Figs. 10D,E, 11A, 12A), assembled α4β2 was expressed more uniformly in axons and dendrites. There are two possibilities: either the axonal targeting signal in α4 was not active (for instance, it might be “masked” in the assembled α4β2 complex) or there might be competing signals in the β2 sequence or other regions in the α4 sequence that promote dendritic expression.
If α4-targeting signal is actively involved in targeting of α4β2, then mutations within this signal are predicted to affect α4β2 subcellular distribution. However, unlike the (LIE/AAA) mutations in CD4–α4, which almost abolished axonal targeting (Fig. 12A), the same mutations introduced in the α4 subunit only resulted in a modest change in D/A ratio when coexpressed with the β2 subunit (0.83 ± 0.073, n = 20, compared with 0.76 ± 0.069 from wild-type α4β2, n = 20). This difference was not statistically significant (p = 0.49; t test), suggesting that axonal signal from α4 does not play active roles in the α4β2 complex.
Next, we sought to determine whether there might be targeting signals in the M3–M4 loop of β2 subunits. Because attaching a full β2 loop to CD4 and IL2RA precluded surface expression, we adhered IL2RA to different regions from the β2 loop. Fusion of IL2RA to the first 30 aa from the β2 loop abolished surface expression (data not shown). In contrast, the chimeric protein with a truncated β2 loop that lacks the first 30 aa (IL2RA-β2 31–126) was expressed on neuronal surface in a nonpolarized pattern (D/A, 0.89 ± 0.13; n = 10) (supplemental Fig. 5G–J, available at www.jneurosci.org as supplemental material), suggesting that the β2 loop region (31–126) does not contain a subcellular targeting signal. Although we cannot positively exclude the possibility of the existence of a subcellular targeting signal in the first 30 aa of the β2 loop, sequence examination suggests that it is less likely, because this region is rather hydrophobic (Ren et al., 2005) and thus unlikely to be exposed in folded protein. In fact, residues in this region were implicated in early stages of receptor biogenesis, such as subunit assembly (Yu and Hall, 1994) and endoplasmic reticulum (ER) export (Ren et al., 2005), that take place before vesicle sorting, transporting, and endocytosis events, which regulate polarized expression (Horton and Ehlers, 2003).
With very few exceptions (Sampo et al., 2003), almost all known neuronal targeting signals were found in cytoplasmic regions of membrane proteins. Another cytoplasmic domain in neuronal nAChRs, the M1–M2 loop, might be too short (only 6 aa, with an almost identical sequence among all neuronal nAChRs) to hold functional targeting signals, as was confirmed by nonpolarized expression pattern when these short loops were attached to CD4 (data not shown). Whether or not targeting signals may exist in other regions in the β2 and α4 sequences remains to be determined experimentally. In summary, we found that mutation of key residues in the axonal targeting motif of α4 did not affect surface distribution of the α4β2 receptor. We did not find other targeting signals in β2 and α4 sequences from the regions we examined. Altogether, it is possible that the difference of axonal expression of fusion proteins containing the α4 loop (CD4–α4 and IL2RA–α4) versus nonpolarized expression of the α4β2 receptor may be caused by “inactivation” or masking of axonal signal in the α4 subunit in the assembled α4β2 receptor complex.
Dendritic targeting signal in the α7 loop mediates selective delivery, whereas axonal targeting signal in the α4 loop mediates fast dendritic endocytosis
One of two general mechanisms may be responsible for the selective localization of polarized proteins on the surface of neurons: selective transport or selective retention. In the first scenario, proteins destined for either axons or dendrites are segregated from one another into different carriers and only delivered to appropriate subcellular domains. Alternatively, proteins could be delivered equally to axonal and dendritic domains but retained on the surface only in the destined domain.
Quantitative analysis revealed that both surface CD4–α7 (D/A, 6.52 ± 0.46) and total CD4–α7 (D/A, 6.06 ± 0.53) were expressed primarily in soma-dendrites. This is also consistent with a predominant somatodendritic localization of total α7 receptors (D/A, 12.4 ± 0.55) and surface α7 receptors (D/A, 12.94 ± 0.68). Thus, selective transport to dendrites but not axons is likely to account for dendritic confinement for proteins containing the α7 dendritic targeting motif, as was proposed for dendritic targeting of Kv4.2 potassium channels (Rivera et al., 2003) and TfR–GFP (Silverman et al., 2001).
Interestingly, although surface CD4–α4 was only observed in axons (Fig. 13A) (D/A, 0.09 ± 0.015), total CD4–α4 was found equally in both axons and dendrites (Fig. 13B) (D/A, 0.89 ± 0.065; n = 15). This result implies that the α4 axonal signal in CD4–α4 was not used for direct transport to axons; instead, it may be used either to prevent membrane insertion or to rapidly remove CD4–α4 from dendritic surface. To distinguish between these two possibilities, we conducted an endocytosis assay to determine whether CD4–α4 was endocytosed from neuronal surface. Briefly, living cells expressing CD4–α4 were first exposed to primary antibody for prolonged periods at 37°C, followed by the quick stripping of surface-bound receptor. The cells were than fixed, permeabilized, and stained with secondary antibody. Under these conditions, only internalized protein can be visualized. In contrast to the predominant display of surface protein on axons (Fig. 13A) and nonpolarized form for total proteins (Fig. 13B), imaging analysis reveals that the majority of endocytosed signals were restricted to soma-dendrites, with very little in axons (Fig. 13C), implying that CD4–α4 was quickly endocytosed from the surface of dendrites, but not axons, after membrane insertion. This result may explain the observed preferential axonal expression of surface CD4–α4 at the steady state. A similar mechanism has been proposed for axonal targeting of NaV1.2 (Garrido et al., 2001) and VAMP (vesicle-associated membrane protein) (Sampo et al., 2003).

Axonal signal in α4 mediates fast dendritic endocytosis. Sister cultures were studied for surface axonal targeting mediated by α4 axonal sequences. Neurons were transfected with CD4–α4 at 8 DIV. Staining of surface CD4–α4 (A), total CD4–α4 (B), and endocytosed CD4–α4 (C) was performed at 12 DIV. Surface CD4–α4 was primarily found in axons (A; D/A, 0.09 ± 0.015), whereas total CD4–α4 was found equally in both axons and dendrites (B; D/A, 0.89 ± 0.65; n = 15). Endocytosis assay was performed by first exposing the cells to primary antibody for 30 min at 37°C, followed by the quick stripping of surface-bound receptor. The cells were then fixed, permeabilized, and stained with secondary antibody. Under these conditions, only internalized proteins were visualized. In contrast to the predominant display of surface protein on axons (A) and nonpolarized form for total protein (B), the majority of endocytosed signals were found in soma-dendrites with little in axons (C). Arrows indicate soma-dendrites. Arrowheads indicate axons. Scale bars, 50 μm.
Discussion
Our principal findings reported here are, first, that in the hippocampal cultures, α7 and α4β2 displayed distinct patterns of distribution, with α7 targeted preferentially to the somatodendritic compartments, whereas α4β2 was expressed at both axonal and dendritic domains. Second, M3–M4 loops from neuronal nAChRs may play key roles in mediating subcellular targeting for these receptors.
Hippocampal culture has been used as an excellent model system to study neuron polarization. Here, we show that this culture system can be applied to identify key sequence elements and conditions that control the distribution of neuronal nAChRs. Unquestionably, receptor distributions in the brain are more complex and likely to vary from different cell types. Nevertheless, our findings agree with results from immunochemical analysis and electrophysiological recordings that α7 receptors are present at somatodendritic compartments in neurons (Alkondon and Albuquerque, 1993; Kawai et al., 2002; Levy and Aoki, 2002). Lacking axonal expression of α7 in hippocampal culture is interesting and unexpected. We cannot rule out the presence of the α7 subunit at specific axons or presynaptic terminals in the brain, as other groups have reported (McGehee et al., 1995; Gray et al., 1996; Fabian-Fine et al., 2001; Jones and Wonnacott, 2004). It is possible that axonal expression of α7 requires assembly with another subunit (Yu and Role, 1998), was below detection in our experiments, or does not occur in hippocampal cultures. We detected somatodendritic locations of α4β2. This finding is in agreement with the presence of non-α7-like receptors, possibly α4β2, in soma-dendrites of hippocampal neurons (Alkondon et al., 1999; McQuiston and Madison, 1999). The non-α7-like receptors in those hippocampal neurons most likely contain α4β2 subunits, because they mediate slowly desensitizing responses that are sensitive to the blockade to dihydro-β-erythroidine and mecamylamine but not to α-bungarotoxin or methyllycaconitine (Alkondon et al., 1999; McQuiston and Madison, 1999). We also detected α4β2 in axons and presynaptic terminals in hippocampal neurons. This observation is consistent with an important role of α4β2 in modulating transmitter release (Zoli et al., 2002; Champtiaux et al., 2003; Salminen et al., 2004).
It is unlikely that subcellular locations we observed from transfected neurons were caused by overexpression artifact. First, the differential distribution for α7 and α4β2 subunits is inconsistent with a prediction resulting from overexpression. Second, other membrane proteins that we examined, such as the recombinant glutamate receptor NR1, were expressed at the predicted somatodendritic locations when cotransfected with neuronal nAChRs in cultured neurons (supplemental Fig. 6, available at www.jneurosci.org as supplemental material). Third, we found that the patterns of expression did not vary with different levels of protein expression, which we frequently observed in the transfected neurons. Fourth, we found that sequence motifs from M3–M4 loops of neuronal nAChRs can mediate subcellular targeting in an autonomous manner when fused to normally nonpolarized proteins, consistent with the differential expression that we observed for the nicotinic receptor subunits themselves.
It has been shown previously that some transmembrane proteins are localized in dendrites as a result of direct vesicular transport (Burack et al., 2000). The confinement of total α7 and surface α7 in dendrites but not in axons implies that direct vesicular transport is also responsible for dendritic expression of α7. We observed weak axonal surface expression of α7 at initial regions of axons. This signal may be caused by the diffusion of surface α7 from dendrites. However, the presence of a diffusion barrier (Kobayashi et al., 1992; Winckler et al., 1999) at the axonal hillock/initial segment may prohibit these proteins from advancing farther into axons. Although the exact location of such a barrier is not known, Winckler et al. (1999) suggested that the barrier might be situated at the initial segment instead of the hillock. They found that GluR1, a dendritic AMPA receptor, extended ∼33 μm beyond the axon hillock (∼50 μm from the cell body, assuming the axon hillock to be ∼20 μm). This measurement is comparable with the distance we estimated for α7 (λ = 47 μm). Interestingly, weak axonal staining at the initial segment was also seen from several other dendritic-targeted proteins, such as EAAT3 (excitatory amino acid transporter 3) (Cheng et al., 2002) and TfR–GFP (Burack et al., 2000; Silverman et al., 2001). These observations suggest that the occurrence of dendritic proteins at the initial region of the axon might be a common phenomenon that is in agreement with the existence of a diffusion barrier within the initial segment of axons.
The mechanism accounting for the distribution of α4β2 in hippocampal neurons is more problematical to understand. This is, at least to some extent, attributable to the complexity of receptor heteromerization, another important but poorly understood aspect of neuronal nAChRs. What is really intriguing is that the axonal targeting motif found in the α4 loop was capable of constraining surface expression of nonpolarized proteins, such as CD4 and IL2RA, to axons, but the same signal was ineffectual for axonal targeting of the α4β2 complex. One explanation is that the α4 axonal signal was masked in the assembled α4β2 complex but was exposed in CD4–α4 and IL2RA–α4 proteins. A previous report that an ER retention signal is buried in assembled muscle nAChRs but is exposed on unassembled subunits suggests that such a hypothesis is plausible (Wang et al., 2002). Consistent with this hypothesis, mutating key residues within the axonal motif in the α4 subunit did not lead to a significant change of dendrite/axon ratio. Whether or not this axonal targeting signal is exposed when α4 subunits assemble with other subunits remains to be determined. It is also possible that this axonal targeting signal could be reexposed when the α4β2 receptor undergoes conformational changes, such as transitions between opening, closed, and desensitization stages. Provided that the axonal targeting motif in α4 operates by facilitating fast dendritic endocytosis (Fig. 13C), a fine control of its conformational or functional state may provide an additional mechanism for neurons to upregulate or downregulate surface receptors in dendrites.
The amino acid sequence of the long cytosolic M3–M4 loop is highly divergent among all of the nAChR subunits (Le Novere et al., 1999). What are the roles of these M3–M4 loops in the biogenesis of nAChRs? Previous studies indicate that residues within M3–M4 loops are involved in receptor assembly (Yu and Hall, 1994), ER export (Ren et al., 2005), and the ubiquitin–proteosome pathway (Ficklin et al., 2005). It has also been demonstrated that the M3–M4 loop from the chick α3 subunit targets this receptor to subdomains within individual synapses on developing CG neurons (Williams et al., 1998; Temburni et al., 2000). Here, we show that M3–M4 loops from mammalian neuronal nAChRs are involved in axon/dendrite distribution. These results further underscore the diverse functions of these cytoplasmic loops. We fully expect future studies of these loops from other neuronal nAChRs to lead to a better understanding of receptor targeting in neurons.
In the past several years, progress has been made in identifying axonal and dendritic targeting motifs for voltage-gated ion channels (Garrido et al., 2001, 2003; Gu et al., 2003; Rivera et al., 2003). Sequence requirements for the subcellular targeting of ligand-gated receptors are less clear. Although several motifs have been identified, such as the C-terminal domains from the metabotropic glutamate receptors (Stowell and Craig, 1999) and AMPA receptors (Ruberti and Dotti, 2000), the required amino acids have not been mapped precisely. Here, we identified a 25-residue axonal targeting sequence that contains the dileucine motif ([DE]XXXL[LI]) and a 48-residue dendritic targeting sequence enclosing the dileucine and tyrosine (YXXØ) motifs. These findings contribute to an understanding of the subcellular distribution of neuronal nAChRs and perhaps other neuronal membrane proteins. The exact mechanism by which these targeting motifs mediate neuronal targeting of nAChRs is unknown. Both tyrosine-based and dileucine-containing signals have been found to bind to subunits of adaptor protein complexes (Ohno et al., 1995; Rapoport et al., 1998). It is possible that the interactions of such adaptors with the targeting motifs that we have identified may either facilitate clathrin-mediated endocytosis of the existing receptors or contribute to the loading of newly synthesized receptors into vesicles bound for specific locations (Burack et al., 2000; Garrido et al., 2001; Bonifacino and Traub, 2003).
In conclusion, our results demonstrate distinct targeting patterns for different neuronal nAChRs that depend on critical sequence elements in the intracellular domains of the nAChR subunits. We found that both α7-containing and α4β2-containing receptors were expressed at soma and mature spines in cultures of primary neurons. We also found that α4β2-containing receptors were expressed to axons and presynaptic terminals in these neurons. These findings have implications for the roles of neuronal nAChRs in synaptic transmission and in nicotine-induced behaviors.
Footnotes
-
This work was supported by National Institutes of Health Grants DA018247, NS028709, and AG010435. J.X. was supported by a National Alliance for Research on Schizophrenia and Depression Young Investigator Award. We thank Dr. Anis Contractor for advice. We also thank Dr. Gary Banker for providing TfR–GFP, Dr. Lily Jan for CD4 construct, Dr. David Bredt for PSD-95–GFP, Dr. John Thomas for Tau–GFP, and Dr. Stefano Vicini for GFP-NR1.
- Correspondence should be addressed to Dr. Stephen F. Heinemann, Molecular Neurobiology Laboratory, The Salk Institute, 10010 North Torrey Pines Road, La Jolla, CA 92037. heinemann{at}salk.edu


