

Abstract
α-Neurexins constitute a family of neuronal cell surface molecules that are essential for efficient neurotransmission, because mice lacking two or all three α-neurexin genes show a severe reduction of synaptic release. Although analyses of α-neurexin knock-outs and transgenic rescue animals suggested an involvement of voltage-dependent Ca2+channels, it remained unclear whether α-neurexins have a general role in Ca2+-dependent exocytosis and how they may affect Ca2+ channels. Here we show by membrane capacitance measurements from melanotrophs in acute pituitary gland slices that release from endocrine cells is diminished by >50% in adult α-neurexin double knock-out and newborn triple knock-out mice. There is a reduction of the cell volume in mutant melanotrophs; however, no ultrastructural changes in size or intracellular distribution of the secretory granules were observed. Recordings of Ca2+ currents from melanotrophs, transfected human embryonic kidney cells, and brainstem neurons reveal that α-neurexins do not affect the activation or inactivation properties of Ca2+ channels directly but may be responsible for coupling them to release-ready vesicles and metabotropic receptors. Our data support a general and essential role for α-neurexins in Ca2+-triggered exocytosis that is similarly important for secretion from neurons and endocrine cells.
- neuroendocrine cells
- exocytosis
- neurohormones
- pituitary gland
- melanotrophs
- cell adhesion molecules
- Ca2+ channels
Introduction
Understanding the mechanisms of Ca2+-triggered exocytosis has emerged as a central problem in neurobiology, because it provides insights into the foundations of our cognitive abilities as well as the regulation of endocrine functions. Secretory activity of neurons and endocrine cells shares many characteristics, including the machinery that mediates the steep [Ca2+] dependence of release and stimulus–secretion coupling (Rettig and Neher, 2002; Sudhof, 2004). We previously showed that the presynaptic transmembrane proteins neurexins (Missler et al., 1998a) perform an essential role in synaptic transmission. Knock-out mice that lack two or all three α-neurexins displayed a severe reduction in neurotransmitter release, causing premature death of all triple knock-out and most of the double knock-out animals (Missler et al., 2003).
All three neurexin genes include independent promoters for α- and β-neurexins (Rowen et al., 2002; Tabuchi and Sudhof, 2002). α-Neurexins contain more extracellular sequences than β-neurexins, but they share with β-neurexins the C-terminal extracellular domain, transmembrane region, and intracellular tail (Missler and Sudhof, 1998). Although biochemistry revealed shared intracellular partners for α- and β-neurexins (Hata et al., 1996; Butz et al., 1998; Biederer and Sudhof, 2000, 2001), their mostly distinct extracellular interactions (Ichtchenko et al., 1995; Missler et al., 1998b; Sugita et al., 2001; Boucard et al., 2005) are likely responsible for their different proposed roles at synapses (Missler et al., 2003; Graf et al., 2004).
As an explanation for the inefficient exocytosis in α-neurexin-deficient mice, we have suggested previously that α-neurexins regulate the function of voltage-dependent Ca2+ channels (VDCCs), because specific Ca2+ channel inhibitors such as ω-conotoxin and agatoxin were less efficient in blocking synaptic transmission between knock-out neurons when compared with control cells and because peak Ca2+ current amplitudes were decreased in mutant brainstem neurons (Missler et al., 2003; Zhang et al., 2005). Transgenic rescue experiments, furthermore, showed that the effect on neurotransmission is specific for α-, but not β-neurexins, and mostly involves N-type (CaV2.2) and P/Q-type (CaV2.1) Ca2+channels (Zhang et al., 2005). Although these studies demonstrated an essential role for α-neurexins in synaptic function, important open questions remained. Are α-neurexins also required for other forms of Ca2+-dependent release such as exocytosis of secretory granules from endocrine cells? If high VDCCs are involved in the process, which aspect of their function is affected by α-neurexins?
Here we addressed these issues by studying secretory granule release from endocrine cells of α-neurexin knock-out mice and by analyzing the effects of α-neurexins on Ca2+ currents in melanotrophs, brainstem neurons, and transfected cell lines. For our purpose melanotrophs of the pituitary gland, when tested in an acute slice preparation, are an excellent model of endocrine exocytosis, because release from these cells is coupled tightly to several Ca2+ channel subtypes (Mansvelder and Kits, 2000; Sedej et al., 2004), resembling many central synapses. We found that α-neurexins play an important role in secretory granule release and that the effect of α-neurexins on Ca2+ channels may involve coupling the channels to release-ready vesicles rather than modulating their activity.
Materials and Methods
Mice.
Knock-out mice lacking one, two, or all three α-neurexin isoforms were generated and genotyped as described previously (Missler et al., 2003). Mice were housed under a 12 h light/dark regimen with access to food and water ad libitum. Animal procedures were performed according to German laws and ethical guidelines set by the University of Göttingen. Experiments were performed with newborn triple knock-outs lacking neurexins 1α and 2α and 3α (TKO) and newborn and adult double knock-outs deficient for either neurexins 1α and 2α (DKO1/2) or neurexins 2α and 3α (DKO2/3). Littermate single knock-out mice deficient only for neurexin 2α (SKO2) and a wild-type (WT) line of the same genetic background served as controls, as described before (Missler et al., 2003; Zhang et al., 2005).
Reverse transcriptase-PCR.
Total RNA was isolated with RNAzol B (WAK-Chemie, Steinbach, Germany) from brains and pituitary glands of wild-type mice. Pituitary glands from six to eight animals were pooled to obtain enough material for RNA isolation. The RNA was reverse-transcribed with the GeneAmp Gold RNA PCR Core Kit (Applied Biosystems, Foster City, CA), using Oligo-dT primer. The following primer pairs specific for neurexin (Nrxn) isoforms were used: Nrxn1α, 5′-CCACAACGGGCTACACGCAAGAAG-3′ (MM04–38) versus CAGGATGAGGCCATTTGGCTCCG (MM04–39); Nrxn2α, CTACCTTCTGCTGGACATGGGCTCC (MM04–40) versus CAGAAAGGAGCAACGCCCACAGCC (MM04–41); Nrxn3α, GCACCATCAAAGTGAAGGCCACTC (MM04–42) versus CTGCTTGGCGCTCATGCGTGAAC (MM04–43); Nrxn1β, CTGATCTGGATAGTCCCGCTCACC (MM04–44) versus GTGCAGCTCCAGGTAGTCACCCAG (MM04–45); Nrxn2β, GTCTCGTCCAGCCTCAG-CACCACC (MM04–46) versus CTCACGATGGCGTTGGGCTCATC (MM04–47); Nrxn3β, CTCCGGGATCTCACTCTCAGCAGG (MM04–48) versus GTGAAGCTGGAGGAAGTCGCCAAG (MM04–49); synaptotagmin 1, GCTGCCCCTATCACCACTGTTG (MM04–50) versus GGGCTCCTCCTTTTCTTCTCCACT (MM04–51). The primers were placed in exons 8 and 9 for α-neurexins and in the β-specific exon and exon 18 (Nrxn1β) or 17 (Nrxn2β and Nrxn3β) for β-neurexins (Tabuchi and Sudhof, 2002). To quantitate the expression levels with real-time PCR, we used different pairs of primers that were located closer together: Nrxn1α, 5′-CCACAACGGGCTACACGCAAGAAG-3′ (MM04–38) versus GCAAGTCGCGATAATTCCAGCCT (MM05–11); Nrxn2α, CTACCTTCTGCTGGACATGGGCTCC (MM04–40) versus GCGTGCTGCGGCTGTTCACA (MM05–12); Nrxn3α, GCACCATCAAAGTGAAGGCCACTC (MM04–42) versus GCCCAGATACATGTCCCCCTCCA (MM05–13); Nrxn1β, CCATGGCAGCAGCAAGCATCATTCA (MM05–14) versus CGTGTACTGGGGCGGTCATTGGGA (MM05–15); Nrxn2β, GTCTCGTCCAGCCTCAGCACCACC (MM04–46) versus CGTGTCATGGGCCGGTCATTGGGA (MM05–16); Nrxn3β, CTCCGGGATCTCACTCTCAGCAGG (MM04–48) versus GATGAGGCCACCGCTTTTCCCAA (MM05–17); β-actin, CGTGCGTGACATCAAAGAGAAGCTG (MM05–03) versus GGATGCCACAGGATTCCATACCCAAG (MM05–04). Quantitative PCR was performed by using SYBR Green PCR Master Mix (Applied Biosystems) in an ABI Prism 7000 Sequence Detection System (Applied Biosystems), with all reactions performed in duplicate. Signals were analyzed by ABI Prism Sequence Detection software (Applied Biosystems), and the ΔΔC t method was used for relative quantification of neurexin transcripts. Standard curves for all of the isoform-specific reactions were generated with serial fivefold dilutions of cDNA in triplicate. DNA melting curves were generated after each experiment to confirm the specificity of amplification.
Histology.
Deeply anesthetized mice were perfused transcardially with PBS, followed by 4% paraformaldehyde in 0.1 m phosphate buffer. Pituitary glands were dissected, postfixed in 4% paraformaldehyde for 2 h, and cryoprotected with 25% sucrose in 0.1 m phosphate buffer overnight. For morphometric analysis 25 μm cryosections were thaw-mounted on poly-l-lysine-coated slides and stained with hematoxylin and eosin. For immunofluorescence 12 μm cryosections were permeabilized with 0.3% Triton X-100 in PBS and incubated in blocking solution (5% normal goat serum in PBS) for 1–2 h at room temperature. Primary antibodies were applied overnight at 4°C: anti-growth hormone, 1:30,000; adrenocorticotropic hormone, 1:20,000; follicle-stimulating hormone, 1:1000; luteinizing hormone β, 1:30,000; thyroid-stimulating hormone β, 1:30,000; prolactin, 1:20,000 (all from Dr. Parlow, National Hormone and Peptide Program, National Institute of Diabetes and Digestive and Kidney Diseases, Bethesda, MD); α-melanocyte-stimulating hormone (α-MSH), 1:500 (Peninsula Laboratories, Belmont, CA); pro-opiomelanocortin, 1:500 (Phoenix Pharmaceuticals, Belmont, CA); β-endorphin, 1:500 (Sigma, St. Louis, MO); vasopressin, 1:500 (Chemicon, Temecula, CA); and oxytocin, 1:500 (Chemicon). Secondary antibodies were goat anti-rabbit or goat anti-mouse Alexa 546 (Invitrogen, Carlsbad, CA) applied at 1:500 for 45 min. The sections were examined at an Axioscope 2 epifluorescent microscope, and images were captured with the AxioCam HRc digital camera (Zeiss, Oberkochen, Germany). The area of the anterior and posterior lobes and the thickness of the intermediate lobe were measured on corresponding frontal sections with AxioVision software (Zeiss). Overviews of the glands were composed of four to eight individual images, using Adobe Photoshop SC (Adobe Systems, Mountain View, CA).
Electron microscopy.
Pituitary glands were dissected and immersed immediately in 2% glutaraldehyde in 0.1 m cacodylate buffer, pH 7.4. After overnight fixation at 4°C the samples were fixed additionally with 1% OsO4 for 1 h at room temperature and were preembedding-stained with uranyl acetate. After dehydration with a consecutive series of ethanol and propylene oxide the samples were embedded in Agar 100 resin. The intermediate lobe was identified on toluidine blue-stained semithin sections (700 nm). Ultrathin sections (60 nm) were counterstained with uranyl acetate for 10 min and lead citrate for 2 min and then examined at a Philips CM 120 electron microscope (Philips, Eindhoven, The Netherlands). Images of melanotrophs were taken randomly with a 2048 × 2048 Tietz TemCam 224A camera (Tietz Video and Image Processing Systems, Gauting, Germany) at 8400× magnification. Measurements were made with DigitalMicrograph 3.4 software (Gatan, Munich, Germany). Only granules with a clearly visible membrane were included in the analysis (∼400–600 granules on 25 different images for each animal).
Pituitary gland physiology.
Pituitary glands were removed carefully from the skull and rinsed with ice-cold external solution one composed of the following (in mm): 125 NaCl, 2.5 KCl, 1.25 NaH2PO4, 2 Na-pyruvate, 3 myo-inositol, 0.5 ascorbic acid, 10 glucose, 26 NaHCO3, 3 MgCl2, 0.1 CaCl2, 6 lactic acid. Then the glands were embedded in 2.5% low-melting agarose (Seaplaque GTG-agarose, BMA, Walkersville, MD), glued onto the sample plate of a vibrotome VT1000S (Leica, Nussloch, Germany), and sectioned in ice-cold external solution two composed of the following (in mm): 2.5 KCl, 1.25 NaH2PO4, 2 Na-pyruvate, 3 myo-inositol, 0.5 ascorbic acid, 250 sucrose, 10 glucose, 26 NaHCO3, 3 MgCl2, 0.1 CaCl2, 6 lactic acid. Fresh 80 μm slices then were transferred to an incubation beaker containing oxygenated external solution one and kept at 32°C for up to 8 h. Changes in cell membrane capacitance (ΔC m) and Ca2+ currents were measured in single melanotrophs within intact clusters of the intermediate lobe, using the conventional whole-cell patch-clamp configuration essentially as described (Sedej et al., 2004). During measurements the slice was perfused continuously (1–2 ml/min) with external solution three composed of the following (in mm): 125 NaCl, 2.5 KCl, 1.25 NaH2PO4, 2 Na-pyruvate, 3 myo-inositol, 0.5 ascorbic acid, 10 glucose, 26 NaHCO3, 1 MgCl2, 2 CaCl2, 6 lactic acid. The osmolality of the extracellular solution was 300 ± 10 mOsm/kg, except for the experiments with 500 mm hypertonic sucrose, and the solution was bubbled continuously with 95% O2/5% CO2 to keep the pH stable at 7.3. Patch pipettes were filled with intracellular solution as follows (in mm): 140 CsCl, 10 HEPES, 2 MgCl2, 20 TEA-Cl, 2 Na2ATP, and 0.05 EGTA. Whole-cell currents and capacitance changes were recorded at 30–32°C, measured with a lock-in patch-clamp amplifier (SWAM IIC, Celica, Ljubljana, Slovenia), low-pass filtered (3 kHz, –3 dB), and stored on a standard PC. The cells were voltage clamped at –80 mV, and Ca2+ currents were leak corrected. For pulse generation, data acquisition, and basic analysis we used WinWCP version 3.3.9. software from J. Dempster (Strathclyde University, Glasgow, UK). High-resolution capacitance measurements (in the fF range) were made by using the compensated technique as described previously (Sedej et al., 2004, 2005; Turner et al., 2005), using a sinusoidal voltage (1600 Hz; 10 mV peak-to-peak). To determine ΔC m values, we first averaged membrane capacitance over the 30 ms preceding the depolarization to obtain a baseline value that was subtracted from the value estimated after the depolarization, averaged over a 40 ms window. The first 30 ms after the depolarization were excluded from the C m measurement to avoid contamination by nonsecretory capacitative transients related to gating charge movement (Horrigan and Bookman, 1994). All chemicals were obtained from Sigma, unless otherwise stated. Signal processing and curve fitting were done by using Sigmaplot (SPSS, Chicago, IL) and MatLab (MathWorks, Natick, MA). Differences between samples were tested by using Student's paired t test and one-way ANOVA (SigmaSTAT, SPSS).
Transfected heterologous cells.
A stable human embryonic kidney 293 (HEK293) cell line expressing three CaV2.2 calcium channel subunits was generated by using the Flp-In system (Invitrogen), following the manufacturer's suggestions (for a more detailed description, see supplemental text, available at www.jneurosci.org as supplemental material). Correct expression and targeting of all subunits that were introduced (hemagglutinin-tagged α1B, β3, and α2δ) were verified by immunoblots and immunohistochemistry (supplemental Fig. 6, available at www.jneurosci.org as supplemental material), using commercially available peptide antibodies (Chemicon and Alamone Labs, Jerusalem, Israel). HEK293_CaV2.2 cells were grown at 37°C in 5% CO2 in DMEM supplemented with 10% fetal bovine serum, 2 mm l-glutamine, 100 μg/ml hygromycin B, and 100 μg/ml penicillin–streptomycin. Cells stably expressing Ca2+ channels then were transiently transfected with 4 μg of each plasmid containing full-length α-neurexin joined to a green fluorescent protein (GFP) tag via an internal ribosome entry site (IRES) (pCMVNrxn1α_IRESGFP) alone or in combination with expression vectors for calcium/calmodulin-dependent serine protein kinase (CASK) and munc18-interacting 1 (Mint1) [cytomegalovirus (pCMV)-CASK, pCMVMint1; both courtesy of T. C. Sudhof, Dallas, TX], using the calcium phosphate method (MBS mammalian transfection kit, Stratagene, La Jolla, CA). After 24 h the cells were trypsinized briefly and plated onto 16 mm glass coverslips.
Patch-clamp experiments were done on the second and third days after plating in a custom-made chamber with an external bath solution composed of the following (in mm): 140 NaCl, 10 BaCl2, 1 MgCl2, 10 HEPES, 10 glucose, pH 7.4 (312 mOsm/kg osmolality) at room temperature. Patch pipettes (borosilicate glass, 1.8 mm outer diameter; Hilgenberg, Malsfeld, Germany) were pulled by a two-stage electrode puller (Narishige, Tokyo, Japan) and fire polished; they showed resistances of 3–5 MΩ. The internal pipette solution contained the following (in mm): 125 Cs-methane sulfonate, 20 TEA-Cl, 5 EGTA, 2 MgCl2, 10 HEPES, 4 Na2-ATP, 0.5 Na-GTP, pH 7.4 (280 mOsm/ kg osmolality). Aliquots of pipette solution were stored at −80°C and kept on ice after thawing. Whole-cell Ca2+current recordings were performed with an EPC7 patch-clamp amplifier (List, Darmstadt, Germany). The signals were filtered with a built-in Bessel filter at 3 kHz, digitized at 10 kHz by a custom-built analog-to-digital converter, and stored on a hard disc of the computer with an acquisition and evaluation program written in C. Cells were held at −80 mV in the whole-cell configuration. Leak currents and whole-cell membrane capacitance were determined by applying 50 ms pulses to −100 mV. Here whole-cell capacitance (C m) was calculated by integrating the area under the whole-cell capacitance transient current (charge transfer, Q) divided by the voltage of the pulse (V), i.e., C m = Q/V. Leak currents were subtracted off-line. Current–voltage (I–V) relationships were obtained by 20 ms voltage pulses from a holding potential of −80 to +50 mV in 10 mV increments. Currents were measured 15 ms after the onset of the test pulse as an average over 5 ms. I–V traces from individual cells were fit with a modified Boltzmann equation as follows: I = G max(V − V rev)/(1 + exp[−(V − V 1/2 act)/k act]), where G max is the maximum slope conductance, V rev is the reversal potential, V 1/2 act is the half-activation potential, and k act is the slope factor. Current densities were calculated as currents normalized to whole-cell capacitance. Steady-state inactivation properties were measured by evoking currents with a 20 ms test pulse to +10 mV after 2 s voltage displacement (prepulse) from –120 to +10 mV in 10 mV increments. Amplitudes of currents evoked by the test pulses were normalized to the maximum currents that were elicited and plotted against the prepulse potential. The data from individual cells were fit with a Boltzmann equation as follows: I norm = A1 + (A2 − A1)/(1 + exp[(V − V 1/2 inact)/k inact]), where A1 and A2 are the noninactivating and inactivating fractions, respectively, V 1/2 inact is the half-inactivation potential, and k inact is the slope factor. Initial analysis (measurements of current, leak resistance, and whole-cell capacitance) was done under LINUX, using a program written in C. Plotting and fitting of the data as well as statistical analysis were done in Prism (GraphPad Software, San Diego, CA). Statistical significance was evaluated by using an unpaired Student's t test and one-way ANOVA as appropriate.
Transfected tsA201 cells.
Cells were grown at 37°C in 5% CO2 in DMEM supplemented with 10% fetal bovine serum and penicillin–streptomycin. The tsA201 cells were plated onto 16 mm coverslips 1 d before transfection with α1B, β1b, and α2δ subunits, using a standard calcium phosphate protocol. Then 3 μg of cDNA encoding for each calcium channel subunit was transfected together with 0.3 μg of cDNA for enhanced GFP (pEGFP-C1; Clontech, Cambridge, UK) and 3 μg of pCMV-Neurexin 1α or control vector (pCMV5). After 12 h the cells were provided with fresh medium and maintained at 37°C for another 12 h. Then the cells were moved to 30°C in 5% CO2 and maintained for up to 6 d. Patch-clamp experiments were done on the fourth to sixth days after transfection, using a custom-made chamber with external bath solution composed of the following (in mm): 65 CsCl, 40 TEA-Cl, 20 BaCl2 or 10 CaCl2 (as indicated), 1 MgCl2, 10 HEPES, 10 glucose, pH 7.2, at room temperature. The internal pipette solution contained the following (in mm): 108 Cs-methane sulfonate, 4 MgCl2, 9 EGTA, 9 HEPES. The rest of the experimental conditions were the same as with HEK293_Cav2.2 cells except for the protocol for eliciting current–voltage (I–V) relationships, which were obtained by 150 ms voltage pulses from −40 to +50 mV in 10 mV increments.
Ca 2+ currents in brainstem neurons. All electrophysiological analyses were performed on neurons of the pre-Bötzinger complex as described previously (Zhang et al., 1999, 2005; Missler et al., 2003). Briefly, acute slices from newborn (postnatal day 1) littermate mice were used for whole-cell recordings. The bath solution in all experiments consisted of the following (in mm): 118 NaCl, 3 KCl, 1.5 CaCl2, 1 MgCl2, 25 NaHCO3, 1 NaH2PO4, 20 glucose, pH 7.4, which was aerated with 95% O2/5% CO2 and kept at 28–30°C. Voltage-activated Ca2+currents were measured with electrodes containing the following (in mm): 110 CsCl2, 30 TEA-Cl, 1 CaCl2, 10 EGTA, 2 MgCl2, 4 Na3ATP, 0.5 Na3GTP, 10 HEPES, pH 7.3, and with 0.5 μm tetrodotoxin (Alamone Labs) in the bath solution. Serial and membrane resistances were estimated from current transients induced by 20 mV hyperpolarization voltage commands from a holding potential of –70 mV. The serial resistance was compensated by 80%, and patches with a serial resistance of >20 MΩ, a membrane resistance of <0.8 GΩ, or leak currents of >150 pA were excluded. Currents were recorded in response to voltage step changes from –70 mV holding potential to test potentials between –80 and +30 mV and were quantified as peak currents in response to voltage steps from –70 to 0 mV. Ca2+current measurements were corrected by using the P/4 protocol. Baclofen (Research Biochemicals, Natick, MA) was prepared as a 10 mm stock solution and added to the bath to a final concentration as indicated in Results. Data acquisition and analysis were performed with commercially available software (pClamp 6.0 and AxoGraph 4.6, Molecular Devices, Union City, CA; Prism 3 software, GraphPad Software).
Results
Hypomorphic pituitary gland in adult α-neurexin double-mutant mice
Knock-out mice deficient for all three α-neurexin genes (Nrxn1α, Nrxn2α, Nrxn3α; triple knock-outs) and most of the double knock-out mutants die early postnatally because of respiratory dysfunction (Missler et al., 2003). Here we analyzed the small population of Nrxn1α − / −;Nrxn2α − / − and Nrxn2α − / −;Nrxn3α − / − double-mutant mice (DKO1/2 and DKO2/3) that survive into adulthood (∼5–10 and 35–40%, respectively). Because the phenotype of DKOs is characterized by a hypomorphic appearance (Fig. 1 A), an ∼40% reduction in body weight (Fig. 1 B), and an almost complete inability to breed (data not shown), we hypothesized that endocrine functions may be impaired in the absence of α-neurexins. Magnetic resonance imaging (MRI) of deeply anesthetized animals was performed to screen for structural alterations of brain areas regulating endocrine functions, using a manganese-enhanced T1-weighted technique essentially as described (Angenstein et al., 2006) (for a brief description, see supplemental text, available at www.jneurosci.org as supplemental material). Quantitative evaluation of scan data revealed a 44% reduction of the total volume of the pituitary gland in DKOs as compared with control animals (Table 1; Fig. 1 C,D), whereas the gross anatomy of other brain regions appeared normal, consistent with our earlier morphological observations in newborn triple knock-outs (Missler et al., 2003). To exclude the possibility that the defective pituitary gland is a mere consequence of a defect in the hypothalamus (Tomiko et al., 1983; Schneggenburger and Konnerth, 1992), we performed reverse transcriptase-PCR (RT-PCR) with neurexin isoform-specific primers (Fig. 1 E), demonstrating that two α- and two β-neurexins are expressed prominently in the gland tissue at levels comparable to the brain or even higher (Fig. 1 F). Because none of the morphological or physiological parameters examined in this study showed significant differences between the two surviving double knock-out populations (i.e., DKO1/2 represents Nrxn1α − / −;Nrxn2α − / − and DKO2/3 represents Nrxn2α − / −;Nrxn3α − / −), we pooled the double knock-out data and henceforth refer to them collectively as DKOs. Similarly, we used two different types of control animals, littermate mice that are deficient for Nrxn2α alone (SKO2) and mice from a genetically matching WT background line. In agreement with the low expression of Nrxn2α in the pituitary gland (Fig. 1 F), both WT and SKO2 genotypes showed virtually identical results in all of the parameters that were examined and are referred to collectively as controls.

α-Neurexin-deficient mice exhibit a small pituitary gland. A , Double knock-out mice (DKO; right) show a hypomorphic phenotype as compared with single knock-out littermate controls (SKO; left). B , Body weight of 5- to 6-week-old female mice lacking Nrxn2α and Nrxn3α (D2/3), Nrxn1α and Nrxn2α (D1/2), or Nrxn2α alone (control). Error bars represent the mean ± SEM. C , D , Manganese-enhanced MRI of adult wild-type ( C ) and α-neurexin double knock-out mice ( D ). The sample images show horizontal T1-weighted scans at the level of the base of the skull. Arrows point to the pituitary glands that highly enrich MnCl2, indicating reduced uptake of MnCl2 and/or size of the gland in mutant mice. E , RT-PCR demonstrates the presence of two α-neurexins and two β-neurexins in the RNA from adult pituitary gland. Syntag1, Synaptotagmin 1 (positive control); dH2O, distilled water. F , α-Neurexin isoforms are expressed in the pituitary glands at levels comparable to or higher than their expression in the brain. The relative quantification was performed by SYBR Green-based real-time PCR with β-actin as a reference gene. Error bars represent the mean ± SEM. G , H , Hematoxylin and eosin-stained frontal sections of the pituitary glands from control ( G ) and double knock-out mice ( H ). aL, Anterior lobe; iL, intermediate lobe; pL, posterior lobe. I , J , High-magnification pictures of the intermediate lobe of control ( I ) and double knock-out animals ( J ). Cells appear to be packed more densely in the latter (arrows). Scale bars are as indicated; level of statistical significance is indicated above the bars.
Quantitative morphological analysis of the pituitary gland in α -neurexin-deficient mice
To investigate which parts of the pituitary gland contribute to the overall diminished size detected in MRI scans, we performed a thorough histological analysis of the gland (Fig. 1 G–J) (also, supplemental Fig. 1, available at www.jneurosci.org as supplemental material), revealing that the reduction is mostly attributable to smaller anterior and intermediate lobes (Table 1). Examination of high-magnification images suggested that smaller individual endocrine cells accounted for the reduced size of the anterior and intermediate lobes (Table 1, Fig. 1 I,J). In contrast, the posterior lobe, which consists of glial cells and hypothalamic neuronal terminals releasing oxytocin and vasopressin, was not affected significantly (Table 1). We next used immunocytochemistry to test whether the smaller pituitary lobes of knock-out animals contain the appropriate peptide hormones. Cryosections were labeled with antibodies against the intermediate lobe marker pro-opiomelanocortin (POMC) and its cleavage products, β-endorphin and α-MSH (Fig. 2). In addition, cells of the anterior lobe were probed with antibodies against growth hormone, prolactin, and other trophic hormones, and the posterior lobe was stained with antisera to vasopressin and oxytocin (supplemental Fig. 2, available at www.jneurosci.org as supplemental material) (data not shown). No differences in distribution pattern or staining intensity were detected among genotypes, suggesting that the mutant cells express all of the peptides normally.
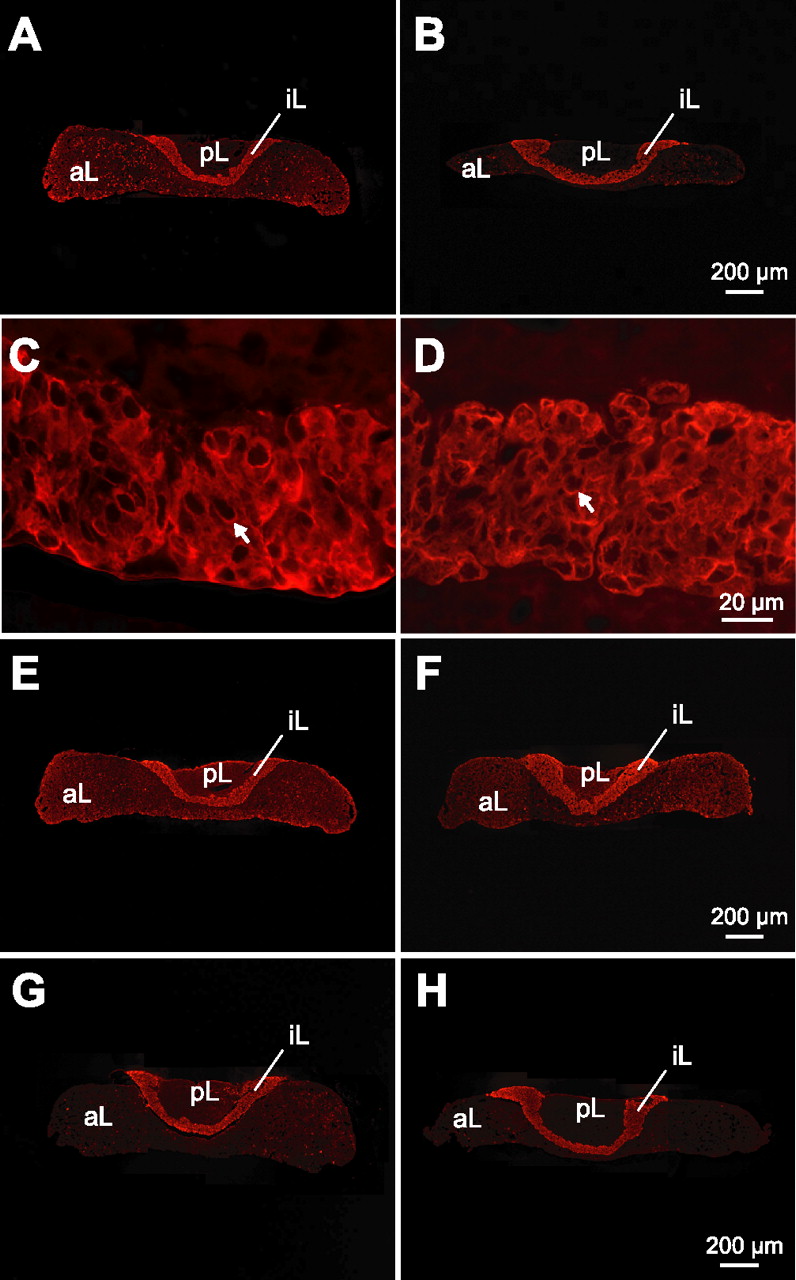
Melanotrophs show a normal expression of peptides in α-neurexin mutant mice. Control ( A , C , E , G ) and double knock-out ( B , D , F , H ) pituitaries were labeled with antibodies against intermediate lobe markers: POMC ( A–D ) and its cleavage products β-endorphin ( E , F ) and α-MSH ( G , H ), expressed by melanotrophs (arrows). aL, Anterior lobe; iL, intermediate lobe; pL, posterior lobe. Scale bars are as indicated.
Defective secretory activity from melanotrophs in adult α-neurexin double-mutant mice
To test directly whether the hypomorphic phenotype and smaller pituitary gland lobes are a sign of insufficient endocrine release, we monitored secretion from mutant and control melanotrophs by whole-cell patch-clamp measurements of membrane capacitance in fresh pituitary gland slices as characterized before (Sedej et al., 2004, 2005; Turner et al., 2005). Consistent with the morphological data reported above, the resting membrane capacitance (a parameter proportional to the membrane surface area) of adult double knock-out mice was reduced significantly as compared with wild-type and single knock-out control animals (Fig. 3 A), indicating that DKO melanotrophs had a smaller calculated cell volume (assuming spherical shape and specific membrane capacitance of 10 fF/μm2; control, 1359 ± 182 μm3 and n = 15; DKO, 861 ± 63 μm3 and n = 54) (Fig. 3 B). Consequently, all recordings were normalized to the resting capacitance. Ca2+-dependent secretion was triggered by a train of 200 depolarizing pulses from −80 to +10 mV for 40 ms at 10 Hz (Fig. 3 C, top panel), which stimulated a rise in cytosolic [Ca2+]i without significantly changing membrane conductance as defined by the real component of the admittance signal. The depolarization train reliably evoked secretory responses in melanotrophs from both DKO and control mice that were measured as a cumulative increase in membrane capacitance (ΔC m) (Fig. 3 C). However, in α-neurexin double-mutant cells the initial increase in ΔC m was much slower (Fig. 3 D) and did not reach control levels even after prolonged stimulation (Fig. 3 C,E), indicating that the secretory activity in DKO pituitary gland is impaired. A single-pulse analysis of these recordings showed that membrane capacitance changes in response to the first 40 pulses were affected predominantly by the mutation while the ΔC m changes during subsequent stimulations were similar (Fig. 3 F). To distinguish whether the reduced secretion in double-mutant cells was attributable to an impaired release process or reflected alterations in the number, size, or distribution of secretory granules, we performed an ultrastructural analysis of DKO and control melanotrophs (for representative electron microscopic pictures, see supplemental Fig. 3, available at www.jneurosci.org as supplemental material). The size of the granules, the distance from the plasma membrane, and the area density of the granules in the cytoplasm were measured on randomly sampled sections from the intermediate lobe and were found to be similar to published data (Zupancic et al., 1994). No significant differences in ultrastructure were observed between α-neurexin double knock-out mice and littermate controls (Table 2), indicating that the defect in secretion was not caused by reduced size and/or availability of secretory granules.

Release from pituitary gland melanotrophs is reduced in adult α-neurexin-deficient mice. A , B , Resting membrane capacitance was measured in melanotrophs of the intermediate lobes from adult wild-type (WT), single knock-out (SKO2), and double knock-out (DKO) pituitary glands ( A ), revealing that the average cell volume of DKO melanotrophs is reduced ( B ). C , Ca2+-dependent secretion was evoked by a train of 200 depolarizing pulses from −80 to +10 mV at 10 Hz. The secretory response was measured as ΔC m in WT and SKO2 controls and in α-neurexin DKO cells and is shown as the mean ± SEM in the traces. D , Higher-resolution plot of the first 4 s of capacitance change (boxed area in C ). E , Cumulative membrane capacitance change normalized to the resting C m in WT and SKO2 controls compared with α-neurexin DKO cells. F , Membrane capacitance changes evoked by the single pulses of the depolarization train. Data are represented as the mean ± SEM ( A–C , E , F ) and have been normalized to the resting capacitance ( C–E ). Level of statistical significance is indicated above the bars.
Ultrastructural analysis of secretory granules in melanotrophs
Functional, but not morphological, defect is the primary phenotype in the pituitary gland
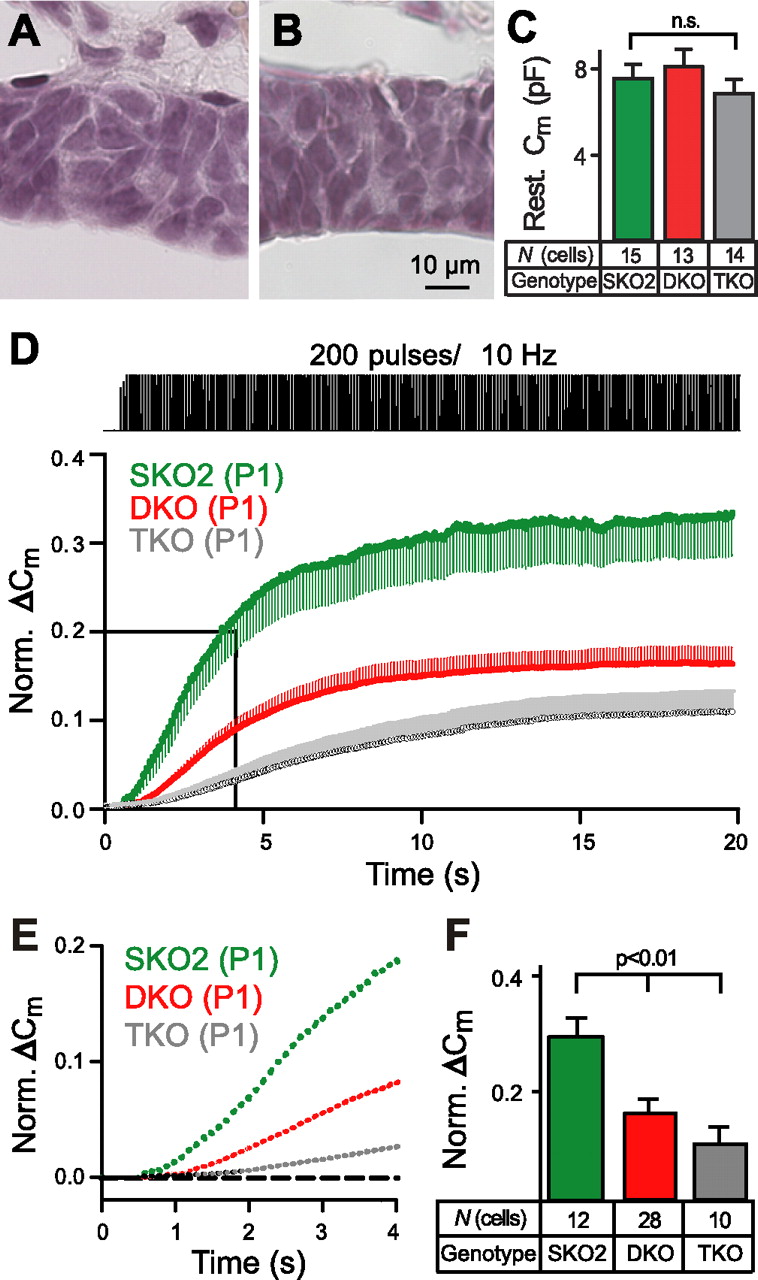
To address the question of whether the reduced size of the mutant anterior and intermediate lobes is a consequence of the defective release or, vice versa, the defective release is a manifestation of an impaired development of the pituitary gland in the absence of α-neurexins, we analyzed the morphology and secretory activity of the pituitary gland in newborn α-neurexin-deficient mice and littermate controls (Fig. 4). In contrast to the adult mutants, histology showed no differences in the size of the pituitary lobes or cell size in newborn mice (Fig. 4 A,B) (also, supplemental Fig. 4, available at www.jneurosci.org as supplemental material). The average thickness of the intermediate lobe measured 29.5 ± 0.6 μm in controls (n = 3) and 30.6 ± 1.0 μm in mutant mice (n = 3, not significant). In line with the morphometric analysis, electrophysiological recordings in melanotrophs showed an almost identical resting membrane capacitance in these young animals (Fig. 4 C), confirming that there is no difference in cell size. However, when we assessed the secretory activity in newborn melanotrophs, membrane capacitance measurements revealed a prominent defect in double knock-out cells (Fig. 4 D--F, red lines) when compared with single knock-out controls (Fig. 4 D–F, green). Consistent with our previous data on neurotransmission (Missler et al., 2003), the reduction in endocrine secretion was pronounced even more in newborn triple knock-outs lacking all three α-neurexin genes (Fig. 4 D–F, gray). The early presence of the functional secretory phenotype and the normal gland structure of newborn mutants together suggest that the impairment of the secretory granule exocytosis is the cause of the morphological changes in the pituitary gland. The cell size in the endocrine system generally is related to the secretory activity of the cells. Therefore, hypoactive melanotrophs tend to show smaller volumes (Chronwall et al., 1988). Preliminary data on the function of β-cells in α-neurexin knock-out mice support the idea of a generalized defect in endocrine secretion. The DKO mice are hyperglycemic, their pancreatic β-cells are similarlyhypomorph as melanotrophs, and stimulus–secretion experiments indicate that β-cells also may show an impaired responsiveness to depolarization protocols (M. Rupnik and M. Missler, unpublished observations). The generalized defect in endocrine secretion potentially underlies the overall hypomorphic phenotype and breeding difficulties observed in the surviving population of adult α-neurexin double-mutant mice.

The functional defect, but not the structural phenotype, is present in the pituitary glands of newborn mutant mice. A , B , Representative sections of the pituitary gland from newborn control ( A ) and triple knock-out ( B ) mice stained with hematoxylin and eosin, showing intermediate lobes of similar thickness and cell density. C , Resting membrane capacitance of melanotrophs from newborn double knock-out (DKO; red) and triple α-neurexin knock-out (TKO; gray) mice is not different from littermate control animals (SKO2; green). D , Ca2+-dependent secretion was evoked from melanotrophs of newborn control animals (SKO2; green trace) and α-neurexin double (DKO; red) and triple (TKO; gray) knock-out mice; responses are represented as changes in membrane capacitance, using the same protocol as for adult mice (see Fig. 3 C). E , Higher-resolution plot of the first 4 s of capacitance change (boxed area in D ). F , Cumulative membrane capacitance change normalized to the resting C m. Data are represented as the mean ± SEM ( C , D , F ) and have been normalized to the resting capacitance ( D–F ). Level of statistical significance is indicated above the bars; n.s., not significant. Scale bar (in B ) is as indicated.
Secretory activity during the early kinetic phase of secretion
In adult DKO and newborn TKO melanotrophs the responses to the early pulses of the depolarization train were reduced markedly (Figs. 3 D, 4 E). We next wanted to obtain an estimate of the pool size and secretion dynamics of the immediately releasable pool (IRP) of granules, which is the population of granules thought to colocalize with Ca2+ channels at release sites and thought to be equivalent to synaptic vesicles at the presynaptic active zone in terms of release kinetics (Thomas et al., 1993a; Parsons et al., 1995; Moser and Neher, 1997). We used two different approaches. First, we applied a dual-pulse protocol, adjusting the pulses to obtain two comparable charge injections (Gillis et al., 1996; Voets et al., 1999; Sedej et al., 2005) (Fig. 5 A). The use of this assay is justified only when substantial pool depletion takes place and the ratio between the capacitance response after second and first depolarization (r = ΔC m2/ΔC m1) is <0.7 (Gillis et al., 1996; Voets et al., 1999; Sedej et al., 2005). Given that this criterion was fulfilled in less than one-half of the cells that were examined, we took instead the sum of capacitance responses (S = ΔC m1 + ΔC m2) after both pulses as a measure of a release-ready vesicle pool size (Sedej et al., 2005). Significant differences were found in S value (Fig. 5 B), indicating that the pool sizes differed in DKO (7.8 ± 2.0 fF, n = 23) and control (16.2 ± 2.8 fF; n = 13) melanotrophs. This result together with ultrastructural observation suggests that, although the proportion of “docked” (membrane-near) secretory granules is similar in all genotypes (Table 2), the number of immediately releasable vesicles is reduced by one-half in the DKOs. Second, we compared the kinetic properties of the IRP by using single depolarization pulses of different duration (Fig. 5 C). Two rapid components of release could be distinguished as characterized before (Horrigan and Bookman, 1994; Gillis et al., 1996; Sedej et al., 2005). The fastest component (≤ 40 ms) was best fit by the following: y(t) = y 0(1 –exp(–t/τ)3), with τ = 4.1 ms, and represents the fusion of IRP of vesicles. Measurements of the fastest component revealed membrane capacitance changes of ∼ 13 fF in control (n = 10) and ∼7 fF in DKO cells (n = 20), corresponding to the release of ∼13 (control) and 7 (DKO) vesicles, respectively (conversion factor of 1 fF per vesicle) (Thomas et al., 1993b), indicating that during short depolarizations the mutant cells secrete only approximately one-half the number of immediately releasable vesicles. The actual size of vesicles in melanotrophs was measured previously by electron microscopy and compared with discrete steps in membrane capacitance (Zupancic et al., 1994). The slower component of secretory responses (depolarization pulses between 40 and 200 ms) was best fit by a linear function in control and mutant cells (Fig. 5 C, dotted lines). Their corresponding k values, which display the slope of the linear fit, also revealed a 50% reduction in α-neurexin double knock-out melanotrophs as compared with littermate control animals. Because the IRP granules probably make the major contribution to basal release under physiological stimulation conditions (Voets et al., 1999), a twofold reduction of this pool can lead to significant exocytotic defects and, thereby, hormonal deficits in the knock-out animals.

The impaired secretion from melanotrophs affects the release-ready pool of vesicles. A , Dual-pulse protocol applied to elicit depletion of the IRP of vesicles. Paired pulses of 40 ms duration to −10 and 0 mV were applied 60 ms apart, and the voltage of the pulses was adjusted to give an equal amount of Ca2+ influx during both pulses. B , Comparison of the IRP size among wild-type (WT) and α-neurexin single knock-out (SKO2) and double knock-out (DKO) mice by dual-pulse protocol as follows: S = ΔC m1 + ΔC m2. Level of statistical significance is indicated above the bars. C , Horrigan–Bookman plot identifies alterations in the IRP of vesicles. At 2 min after the beginning of whole-cell dialysis, single depolarization pulses of different duration (between 2 and 200 ms) from −80 to 0 mV were applied in random order. Then, 15 s was allowed for pool refilling after pulses shorter than 40 ms, and 30 s was allowed for longer pulses. Membrane capacitance changes were recorded from control (SKO2; green) and α-neurexin double knock-out (DKO; red) cells. Pulses <40 ms presumably evoke a release of vesicles from the IRP; this exponential phase reaches a plateau at ∼20 ms, indicating pool depletion. τ represents the time constant for the exponential fit of control data, although knock-out data could not be fit satisfactorily with an exponential equation. The slower component of release was fit with a straight line; k indicates the slope of the linear fit. Data are represented as the mean ± SEM.
Voltage-dependent Ca2+ currents in α-neurexin-deficient melanotrophs
We suggested earlier that the reduced neurotransmission at central synapses of newborn α-neurexin-deficient mice involves an impaired function of high VDCCs (Missler et al., 2003). We therefore examined whole-cell Ca2+ currents in melanotrophs of adult and newborn control and α-neurexin-deficient mice (Fig. 6 A), using 300 ms voltage ramps to elicit currents as described previously (Sedej et al., 2004). We first investigated peak Ca2+ currents but failed to detect changes in current density when adult or newborn mutant mice were compared with their corresponding controls (Fig. 6 B). To test that Ca2+ channel densities do not decline at different rates during whole-cell dialysis, we monitored the peak Ca2+ currents over 10 min, but they showed only little rundown in adult control and double knock-out cells (Fig. 6 C). We next determined the contribution of different subtypes of VDCCs to the peak amplitude in mutant and control cells by applying specific N-type (1 μm ω-conotoxin GVIA), P/Q-type (100 nm of ω-agatoxin TK plus 100 nm ω-conotoxin MVIIC), and L-type blockers (10 μm nifedipine) in sequential order. No difference in Ca2+ current density was observed for any of the VDCCs (Fig. 6 D), suggesting that, in contrast to brainstem neurons (Missler et al., 2003), no functional compensation among VDCCs takes place in DKO melanotrophs. We used the peak amplitude of inward Ca2+-activated Cl− currents as an additional estimate of the amount of Ca2+ entering the cytosol via VDCCs (Turner et al., 2005) and observed similar Cl− current densities in melanotrophs of both genotypes (Fig. 6 E). We additionally compared Ca2+ current–voltage relationships by using the voltage ramp protocol that allows for the separation of low voltage-activated and high voltage-activated Ca2+ currents (Kocmur and Zorec, 1993). A difference was found in the I–V relation that corresponds to the activation of N and P/Q channels (Fig. 6 F) (averaged from n = 3 sweeps; black trace was derived by subtracting SKO2−DKO), seen as a rightward shift in the peak voltage dependence from −10 mV (control; n = 21) to −4 mV (DKO; n = 38). These data suggest that a difference in VDCC function exists but is not large enough to explain the much lower release from melanotrophs on the basis of altered Ca2+ channel properties.

Whole-cell Ca2+currents are not reduced in α-neurexin-deficient melanotrophs but show a small kinetic difference. A , Representative Ca2+ current recordings evoked by 300 ms voltage ramps from −80 to +60 mV in melanotrophs of α-neurexin DKO (red), and littermate control (SKO2; green) mice. B , Comparison of high voltage-activated peak Ca2+ current densities in melanotrophs of adult and newborn control (WT and SKO2) and α-neurexin DKO and TKO mice. C , Rundown of normalized Ca2+ currents is similar among genotypes. D , Ca2+ channel subtype contributions to Ca2+ currents were measured in 10 mm [Ca2+]e by sequentially adding 1 μm ω-conotoxin GVIA, 100 nm of ω-agatoxin TK plus 100 nm ω-conotoxin MVIIC, and 10 μm nifedipine. E , The densities of Ca2+-activated Cl− currents (Turner et al., 2005) are comparable between the genotypes. F , Voltage dependence of the averaged Ca2+ current densities shows a shift in α-neurexin double knock-out cells (arrows; ΔV peak). All data in bar histograms are represented as the mean ± SEM; n.s., not significant.
Expression of VDCCs is high in early postnatal melanotrophs and subsequently becomes downregulated by the gradual onset of their dopaminergic and GABAergic synaptic input (Gomora et al., 1996; Fass et al., 1999). Therefore, we also explored the innervation from hypothalamic neurons by recording spontaneous postsynaptic currents (SPCs) in melanotrophs of adult control and double knock-out mice (Fig. 7). Consistent with earlier data on miniature postsynaptic currents in α-neurexin-deficient neurons (Missler et al., 2003), the SPC frequency was ∼65% lower in DKO cells (0.07 ± 0.02 Hz; n = 15) when compared with controls (0.2 ± 0.04 Hz; n = 22) (Fig. 7 A,B). The addition of 60 pm α-latrotoxin into the external bath solution even aggravated this difference (control, 3.56 ± 0.63 Hz and n = 17; DKO, 0.07 ± 0.03 Hz and n = 4) (Fig. 7 A,B), confirming and extending previous observations that α-neurexins act as a prominent receptor for this neurotoxin (Geppert et al., 1998; Sugita et al., 1999) and also play an important role at presynaptic terminals in the hypothalamo–hypophysial axis. To test whether the hypothalamic terminals in α-neurexin mutants are at all functional, we probed the Ca2+-independent component of release with hypertonic solution (but see Basarsky et al., 1994). Although lower sucrose concentrations (100 and 200 mm) (data not shown) appeared to be ineffective on the postsynaptic response of melanotrophs independent of their genotype, the addition of 500 mm sucrose evoked a significant increase in the presynaptic activity of both control (0 mm sucrose, 0.12 ± 0.02 Hz and n = 3; 500 mm sucrose, 4.14 ± 1.34 Hz and n = 3) and mutant cells (0 mm sucrose, 0.04 ± 0.02 Hz and n = 6; 500 mm sucrose, 2.56 ± 0.58 Hz and n = 6) (Fig. 7 C,D). The slightly lower level of SPCs recorded from mutant cells after sucrose application (Fig. 7 D) is consistent with our previous observations in neocortical neurons (Missler et al., 2003) and may indicate a reduction in the number of inhibitory synapses also seen before (Missler et al., 2003). To confirm whether this is also the case in the hypothalamo–hypophysial axis, we used immunofluorescence of synaptic markers to probe for the presence of GABAergic terminals in the vicinity of melanotrophs in control and mutant mice. Our data suggest that these terminals are present in the intermediate lobe but appear to be much sparser in mutant mice (supplemental Fig. 5, available at www.jneurosci.org as supplemental material). In contrast to the experiments on pituitary glands of adult mice, no postsynaptic activity was detected in melanotrophs from newborn mice of any genotype before or after the addition of latrotoxin or hypertonic sucrose solution (data not shown), reflecting the absence of hypothalamic innervation at this age (Gomora et al., 1996; Makarenko et al., 2005). Because the secretory phenotype is manifested fully in newborn mutant melanotrophs that lack hypothalamic regulation, the defect in secretory activity is attributable to the absence of α-neurexins in the pituitary gland and does not represent an indirect consequence of a completely dysfunctional release from hypothalamic terminals.

Melanotrophs in α-neurexin-deficient mice receive reduced synaptic inputs from hypothalamic neurons. A , Representative current traces show GABA-mediated SPCs before and after the addition of 60 μm α-latrotoxin recorded under voltage clamp from adult melanotrophs of control and double knock-out mice (DKO). B , Quantification of the SPC frequency demonstrates that synaptic release from hypothalamic neurons is reduced in mutant mice and cannot be stimulated by the neurotoxin as in controls. C , Similar recording as in A before (0 mm sucrose) and after the addition of hypertonic solution (500 mm sucrose). D , Quantification of the SPC frequency shows that the hypothalamic terminals on both control and mutant melanotrophs respond to sucrose stimulation. Data are represented as the mean ± SEM. Level of statistical significance is indicated above the bars; n.s., not significant.
Effect of α-neurexins on Ca2+ channels
Two possible mechanisms can be proposed to explain the effect of α-neurexins on Ca2+-dependent release: modulating the biophysical properties of Ca2+ channels or determining their localization at release sites. We took two independent approaches to distinguish between these possibilities: (1) VDCCs were coexpressed with α-neurexins in heterologous cells to study direct effects of α-neurexins on Ca2+ currents in this simple system, and (2) the interaction of a G-protein-coupled GABAB receptor with VDCCs was explored in α-neurexin triple knock-outs to reveal defects in anchoring or positioning of Ca2+ channels.
First, to test whether α-neurexins can regulate biophysical parameters of VDCCs directly, we generated a HEK293 cell line that stably expressed the α1B, β3, and α2δ1 subunits, conferring a recombinant CaV2.2 (N-type) calcium channel on a nonexcitable cell type that contains few endogenous high VDCCs (for a more detailed characterization of the stable cell line, see supplemental Fig. 6, available at www.jneurosci.org as supplemental material). The depolarization of HEK293_CaV2.2 cells with a voltage step protocol that used 10 mm Ba2+ as a charge carrier elicited inward VDCC-mediated currents of ∼200–400 pA peak amplitude (average peak amplitude, −337.17 ± 33.62 pA; n = 25) (Fig. 8 A). The currents could be blocked completely by adding the N-type Ca2+ channel inhibitor ω-conotoxin GVIA (1 μm) to the external solution, characterizing the currents as specific N-type Ca2+ currents (Fig. 8 B). We then searched for alterations in these currents when full-length Nrxn1α was coexpressed in HEK293_CaV2.2 cells along with an EGFP reporter gene to select cells for patch-clamp experiments (Fig. 8 C, top panel). Untransfected HEK293_CaV2.2 cells on the same coverslips were used as controls. Although Nrxn1α was expressed and targeted to the plasma membrane as predicted (Fig. 8 C, bottom panel), no changes of current–voltage (I–V) relationship were observed in the presence of α-neurexin (Fig. 8 D, red trace) when compared with control HEK293_CaV2.2 cells (Fig. 8 D, black). VDCC current density in controls (V t = 10 mV; I Ca density = 24.8 ± 2.2 pA/pF) was not significantly different from that in HEK293_CaV2.2 cells expressing Nrxn1α cDNA (V t = 10 mV; I Ca density = 28.8 ± 2.6 pA/pF), suggesting that α-neurexin is not able to modulate directly the current density of VDCCs. Because the modular adaptor proteins CASK (Butz et al., 1998; Maximov et al., 1999; Maximov and Bezprozvanny, 2002) and Mint1 (Maximov et al., 1999; Biederer and Sudhof, 2000) are able to interact with both α-neurexins and CaV2.2 channels at least biochemically, we reasoned that their additional presence was necessary to reconstitute the functional link in vitro. However, no alterations in I–V relation or VDCC current density (V t = 10 mV; I Ca = 29.7 ± 3.8 pA/pF) were detected in HEK293_CaV2.2 cells coexpressing full-length Nrxn1α together with CASK and Mint1 (Fig. 8 D, blue trace). To investigate whether α-neurexin alone or in concert with the adaptor proteins affects the inactivation of VDCCs, we used a prepulse protocol to compare averaged steady-state inactivation curves, but no differences were observed between control and cotransfected cells (Fig. 8 E). Table 3 summarizes all activation and inactivation parameters of Ca2+ currents recorded from control HEK293_CaV2.2, HEK293_CaV2.2 cotransfected with Nrxn1α alone, and with Nrxn1α plus CASK and Mint1. Data were derived from I–V traces fit with a modified Boltzmann equation as described in Materials and Methods and did not reveal any differences among the groups.

Neurexin 1α has no direct effect on biophysical parameters of recombinant N-type (CaV2.2) calcium channels. A , Representative Ca2+ channel currents recorded from HEK293 cells stably expressing the α1B, β3, and α2δ subunits of high voltage-activated Ca2+ channels (HEK293_CaV2.2). Currents were induced by 150 ms pulses from −40 to +50 mV in 10 mV increments. B , Ca2+ channel currents recorded from the stably transfected HEK293 cells can be blocked completely by 1 μm ω-conotoxin GVIA (ω-Ctx), suggesting that they are mediated specifically by the recombinant N-type (CaV2.2) channels. Time course was obtained by applying 50 ms voltage pulses to 0 mV every 10 s. The inset shows sample traces before (black) and 5 min after (red) the addition of ω-Ctx. C , Cotransfection experiments of HEK293_CaV2.2 cells with Nrxn1α cDNA or Nrxn1α plus CASK and Mint1 cDNAs. The diagram depicts the expression vector for Nrxn1α that coexpresses a reporter gene, GFP. A representative cell shows neurexin at the plasma membrane (red), and cytosolic GFP (green). D , E , Whole-cell voltage-clamp recordings reveal no differences in averaged current density–voltage relationships ( D ) and in averaged steady-state inactivation curves ( E ) in HEK293_CaV2.2 cells coexpressing Nrxn 1α, Nrxn 1α together with CASK and Mint1, or untransfected HEK293_CaV2.2 cells. Curves were generated from voltage-step protocols as indicated in the diagrams. The numbers of cells from more than three independent transfections are as indicated. Data are represented as the mean ± SEM.
Analysis of the effect of α -neurexins on CaV2.2 calcium channels in heterologous cells: stable HEK293_CaV 2.2 cell line
In the recordings from stable cell lines Ba2+ had to be used as a charge carrier to produce quantifiable currents, raising the problem that certain aspects of Ca2+ channel function such as Ca2+-dependent inactivation (Budde et al., 2002) could not be evaluated. To address these concerns, we repeated the experiments described above for HEK293_CaV2.2 cells but now compared responses with 10 mm Ca2+ and 20 mm Ba2+ as charge carriers by using transient transfections of tsA201 cells, a standard model to study the regulation of VDCCs in vitro (Zamponi and Snutch, 1998). Cells were transiently transfected with the α1B, β1b, and α2δ1 subunits of CaV2.2 with and without (control) the addition of Nrxn1α, as described in more detail in Materials and Methods. Independent of the charge carrier used, no major alterations of I–V relations, VDCC current densities, or inactivation profiles were detected (supplemental Fig. 7, available at www.jneurosci.org as supplemental material), with the notable exception of a statistically significant 2.5 mV leftward shift in half-activation potential when Ca2+ was used (Table 4). This leftward shift with the addition of α-neurexin in tsA201 cells is in agreement with the rightward shift in half-activation potential observed in melanotrophs with the deletion of α-neurexins (Fig. 6 F). However, because the peak current density measured in 10 mm [Ca2+]e in control cells (V t = 30 mV; I Ca density = 14.6 ± 2.8 pA/pF) was not different from cells coexpressing Nrxn1α (V t = 30 mV; I Ca density = 13.6 ± 2.9 pA/pF), it is unlikely that the small changes in voltage dependence of activation sufficiently explain the mostly reduced release at synapses or in endocrine cells. Table 4 summarizes all activation and inactivation parameters of Ca2+ channel currents recorded from transfected tsA201 cells, indicating that Nrxn1α is not able to modulate the biophysical properties of VDCCs considerably.
Analysis of the effect of α -neurexins on CaV2.2 calcium channels in heterologous cells: tsA201 cells transiently transfected with CaV2.2 subunits and Nrxn1α or control
An alternative explanation of how α-neurexins affect Ca2+ channels could be that neurexins determine the correct spatial alignment between VDCCs and releasable vesicles, for example by anchoring VDCCs at their preferred slots within the active zone (Cao et al., 2004; Cao and Tsien, 2005). The microdomain hypothesis of Ca2+-dependent exocytosis proposes the importance of the “subsynaptic” spatial arrangement of fusion-competent vesicles and the fusion machinery (Matthews, 1996; Klingauf and Neher, 1997; Neher, 1998). Because of the high [Ca2+] cooperativity of release (Bollmann et al., 2000; Schneggenburger and Neher, 2000) already small shifts (< 100 nm) in microdomains can have a large impact on the probability of release at synapses as well as in neuroendocrine cells (Becherer et al., 2003). Because usual strategies to test such a possibility, for example by ultrastructural immunogold labeling of endogenous or tagged channel subtypes in α-neurexin mutants versus control mice, currently are limited for technical reasons, we adopted a more indirect approach to address the issue.
We asked whether the link of an unrelated receptor molecule to VDCCs also might be impaired in α-neurexin knock-out mice, assuming that the absence of α-neurexins not only may weaken the link to docked vesicles but also weaken the link to other transmembrane proteins. The activation of G-protein-coupled GABAB receptors causes a reduction of release and VDCC-mediated Ca2+ current amplitudes (Pfrieger et al., 1994). GABAB receptors are expressed in brainstem neurons (Zhang et al., 1999) where our initial analysis of Ca2+ currents was performed (Missler et al., 2003), as well as in rodent melanotrophs (Purisai et al., 2005). We examined the regulation of Ca2+ channels by G-protein-coupled GABAB receptors in brainstem neurons of α-neurexin knock-outs. Ca2+ currents were evoked by 200 ms steps from a holding potential of –70 to +40 mV in 10 mV increments. Representative traces of Ca2+ currents from α-neurexin triple knock-out mice and control animals are shown in Figure 9, A1 and 9B1 . I–V relations show maxima at 0 mV (Fig. 9 A2 ,9B2 ), and averaged peak current densities were 18.6 ± 0.7 pA/pF in control (Fig. 9 A3 ) as compared with 6.3 ± 0.2 pA/pF in knock-out mice (Fig. 9 B3 ), validating with an independent set of experiments our previous finding of decreased VDCC-mediated Ca2+ currents in α-neurexin mutant mice (Missler et al., 2003; Zhang et al., 2005). Activation of the GABAB receptor by its specific agonist baclofen reduced the amplitude of Ca2+ currents in all neurons (Fig. 9 A,B). However, although the averaged current density in control neurons was reduced by almost 60%, from 18.9 ± 0.7 to 8.0 ± 0.3 pA/pF with the application of baclofen (Fig. 9 A3 ), in α-neurexin mutant neurons the current density was diminished by only 30%, from 6.1 ± 0.2 to 4.8 ± 0.2 pA/pF (Fig. 9 B3 ). To exclude that the sensitivity of GABAB receptors for agonist-binding was changed in knock-out neurons, we plotted the effect of the bath application of baclofen against time (Fig. 9 C). Ca2+ currents were evoked by a depolarizing step from –70 to 0 mV every 5 s. Baclofen developed its maximal effect within 1 min in both control and mutant neurons (Fig. 9 C) (n = 5 mice for each genotype), and longer incubation with baclofen for up to 20 min did not enhance the effect in α-neurexin-deficient cells (n = 3 mice) (data not shown), revealing that the time course was similar in all of the genotypes that were tested. In addition, increasing baclofen concentration from 1 to 30 μm produced a similar dose–response relationship in both control (n = 5) and knock-out mice (n = 5) (Fig. 9 D). The IC50 was determined as 2.4 μm in control and 4.2 μm in mutant neurons by fitting the data with the Hill equation, and baclofen concentrations higher than 30 μm did not cause any additional inhibition of Ca2+ currents (Fig. 9 D). To test whether the difference in response to baclofen is attributable to changed expression of GABAB receptors in mutant brains, we used quantitative immunoblotting of GABAB receptor 1a and 1b subunits (Santa Cruz Biotechnology, Santa Cruz, CA) with 125I-labeled secondary antibodies and PhosphoImager detection essentially as described (Kattenstroth et al., 2004). No differences were observed in brain and slice culture homogenates of control and triple knock-out mice (data not shown). Our results demonstrate that the deletion of α-neurexin genes abolishes GABAB receptor-mediated modulation of Ca2+ currents and may indicate an involvement of α-neurexin in anchoring and/or positioning of VDCCs close to receptor molecules such as GABAB receptors and fusion-ready vesicles.

GABAB receptor modulation of Ca2+currents is impaired in α-neurexin mutant mice. A , B , Ca2+ currents were recorded before and after the addition of 30 μm baclofen from brainstem neurons of newborn control ( A ; WT) and α-neurexin triple knock-out mice ( B ; TKO). Representative current traces ( A 1 , B 1 ), current–voltage relationships ( A 2 , B 2 ), and quantitated peak current densities ( A 3 , B 3 ) show a decrease of Ca2+ currents in the presence of baclofen in control neurons, but not in mutant neurons. C , Peak amplitude of high voltage-activated Ca2+ currents in response to 30 μm baclofen plotted against time in control (WT) and α-neurexin knock-out mice (TKO), demonstrating similar onset within <30 s. D , Dose–response curve showing the concentration-dependent effect of baclofen in control (WT; IC50 = 2.4 μm; n = 5 mice) and α-neurexin knock-outs (TKO; IC50 = 4.2 μm; n = 5). Data are represented as the mean ± SEM. Level of statistical significance is indicated above the bars; n.s., not significant.
Discussion
We show here that α-neurexins play an important role in Ca2+-dependent release from endocrine cells. Furthermore, our data indicate that α-neurexins may function by coupling Ca2+ channels to components of the release machinery rather than by regulating Ca2+ channel activity directly.
α-Neurexins are general players in Ca2+-triggered release
Neurexins were identified as a family of neuronal transmembrane proteins (Ushkaryov et al., 1992, 1994). Because of their polymorphic structure and presumably synaptic localization, neurexins were proposed as synaptic cell adhesion molecules (Missler and Sudhof, 1998). Therefore, the discovery of an essential role for α-neurexins in synapse function rather than synapse formation came as a surprise (Missler et al., 2003). To reconcile their molecular composition with the finding of impaired synaptic transmission in knock-outs, we suggested that α-neurexins link synaptic cell adhesion to the organization of the release machinery (Missler et al., 2003).
We now studied endocrine release in α-neurexin knock-outs, using recordings from melanotrophs in an acute slice preparation of the pituitary gland, because melanotrophs provide a homogenous population of cells and release from these cells is coupled tightly to several Ca2+ channel subtypes (Mansvelder and Kits, 2000; Sedej et al., 2004), resembling many central synapses. The recordings from an acute slice are advantageous, because the slice shows a stronger stimulus–release coupling than cultured melanotrophs (Thomas et al., 1993a; Parsons et al., 1995; Mansvelder and Kits, 2000; Sedej et al., 2004, 2005). In addition to the physiological activation by VDCCs, the acute slice allows us to investigate perinatal tissue (Sedej et al., 2004) (Fig. 4) and to assess simultaneously both endocrine secretion (Figs. 3–6) and synaptic release function (Fig. 7).
Although many components of the synaptic release machinery perform similar functions in (neuro)endocrine cells, only a few molecules reveal dramatic effects on both types of exocytosis when deleted. The vesicle protein synaptotagmin 1 is essential as the Ca2+ sensor of fast release, as demonstrated in hippocampal neurons (Geppert et al., 1994; Fernandez-Chacon et al., 2001) and endocrine cells (Voets et al., 2001b; Kreft et al., 2003). In the fusion complex the essential contribution of the soluble N-ethylmaleimide-sensitive factor attachment protein (SNAP) receptor (SNARE) proteins syntaxin, SNAP25, and synaptobrevin has been demonstrated in neurons by cleavage studies (Sakaba et al., 2005) and also in endocrine cells (Rupnik et al., 2000; Sorensen et al., 2003). Deletion of Munc18 protein silenced neurotransmission (Verhage et al., 2000) and reduced large dense-core vesicle release (Voets et al., 2001a). We now show a contribution of α-neurexins to release from melanotrophs, adding them to the proteins that significantly affect Ca2+-triggered exocytosis of both synaptic vesicles and secretory granules.
Our data on impaired exocytosis from mutant melanotrophs indicate that α-neurexins, putative synaptic cell adhesion molecules, influence secretion in cells that have no precisely organized active zones and no postsynaptic partners. Deletion of another adhesion molecule, neural cell adhesion molecule (NCAM), causes a secretory deficit in chromaffin cells (Chan et al., 2005) in addition to alterations of transmitter release (Rafuse et al., 2000; Polo-Parada et al., 2001, 2004) and impaired synaptic plasticity (Muller et al., 1996; Cremer et al., 1998). Both NCAM and N-cadherin were shown to affect secretion of growth hormone, because homophilic adhesion stimulated hormone release in cultured pituitary cells (Rubinek et al., 2003).
The relation between α-neurexins and Ca2+ channels
VDCCs mediate the presynaptic influx of Ca2+, which triggers release, and may be connected physically to adaptor proteins (Maximov et al., 1999; Atlas, 2001; Coppola et al., 2001; Hibino et al., 2002) or components of the fusion complex (Bezprozvanny et al., 1995; Rettig et al., 1996; Zhong et al., 1999). VDCCs involved in presynaptic Ca2+ entry are usually of the N- and P/Q-type (Dunlap et al., 1995; Wu et al., 1999), but R- and L-type channels may be involved at synapses (Jensen and Mody, 2001; Dietrich et al., 2003) and in endocrine cells (Elhamdani et al., 1998; Mansvelder and Kits, 2000; Brandt, et al., 2003; Sedej et al., 2004). Because of the high Ca2+ cooperativity and Ca2+ sensitivity of release (Bollmann et al., 2000; Schneggenburger and Neher, 2000; Becherer et al., 2003) the regulation of VDCCs could have a great impact on synaptic strength, because little changes in Ca2+ influx lead to substantial effects on release.
Several lines of evidence indicate that the effect of α-neurexins on release of neurotransmitters involves the regulation of VDCCs: (1) the addition of Ca2+ channel inhibitors such as ω-conotoxin and agatoxin did not block synaptic transmission prominently in neocortical and brainstem knock-out neurons (Missler et al., 2003), (2) smaller whole-cell Ca2+ current peak amplitudes were observed in mutant brainstem neurons (Missler et al., 2003), (3) the effect of α-neurexins on neurotransmission specifically involved N-type (CaV2.2) and P/Q-type (CaV2.1) Ca2+ channels (Zhang et al., 2005), and (4) the synaptic homeostasis at neuromuscular junctions that is believed to require VDCCs was defective in the absence of α-neurexins (Sons et al., 2006). Our current study on endocrine release yielded additional support for an involvement of VDCCs because (5) a small shift in the voltage dependence of Ca2+ currents was present in mutant melanotrophs (Fig. 6 F), (6) a corresponding shift in the half-activation potential was found in heterologous cells coexpressing VDCCs and α-neurexin (Table 4), and (7) GABAB receptor G-protein-mediated regulation of Ca2+ channels was impaired in α-neurexin knock-outs (Fig. 9). These findings raise the question of what property of VDCC function is regulated by α-neurexins?
First, we addressed the possibility that α-neurexins directly affect the biophysical properties of VDCCs such as activation or inactivation parameters. Several factors facilitate or inhibit VDCC-mediated currents, such as the [Ca2+]i concentration itself (Budde et al., 2002), several EF-hand proteins (Weiss and Burgoyne, 2002), G-protein-coupled receptors (Herlitze et al., 1996; Zamponi and Snutch, 1998), components of the exocytotic machinery (Catterall, 1999; Atlas, 2001), or even lipid bilayer components (Wu et al., 2002). Unlike these regulations that could be demonstrated reliably in heterologous cell systems similar to the one used here (Fig. 8) (also, supplemental Figs. 6, 7, available at www.jneurosci.org as supplemental material), α-neurexin expressed in HEK293 cells alone or in combination with CASK and Mint1 did not affect the Ca2+ current parameters prominently when coexpressed with VDCCs (Table 3). Because the effect on the half-activation potential appears to be too small to explain the mostly reduced release and because the knock-out phenotype for α-neurexin is much stronger than those for many of the established VDCC regulators discussed above, it is unlikely that α-neurexins function by modulating VDCC-mediated currents directly. This conclusion is consistent with the finding that transgenic α-neurexin could rescue the phenotype when expressed in knock-out animals but did not enhance Ca2+ current density in wild-type neurons (Zhang et al., 2005). Although we did not observe prominent changes in whole-cell Ca2+ currents in melanotrophs, the reduction of whole-cell Ca2+ current amplitudes in mutant brainstem neurons is not an artifact, because the changes are robust and were validated in three independent sets of experiments (Missler et al., 2003; Zhang et al., 2005) (Fig. 7). According to our present data these lower somatodendritic Ca2+ currents represent a consequence of homeostatic reactions in α-neurexin knock-out mice. It is otherwise difficult to conceive how presynaptic α-neurexins could influence whole-cell Ca2+ current density, which is contributed mainly by somatodendritic Ca2+ channels.
The second possible explanation for an involvement of VDCCs is that the deletion of α-neurexins leads to an uncoupling between Ca2+ channels and components of the release machinery. α-Neurexins may be responsible, for example, for anchoring Ca2+ channels within the active zone close to releasable vesicles. Such a proximity is important, because the increase in [Ca2+]i after action potentials is brief and spatially restricted (Meinrenken et al., 2002); consequently, the delay between Ca2+ influx and vesicle fusion is very short (Simon and Llinas, 1985; Borst and Sakmann, 1996). According to this concept of Ca2+ microdomains, any alterations in the positioning and/or coupling of VDCCs to vesicles would produce great effects on exocytosis. In our analyses of α-neurexin knock-out mice the reduced sensitivity of release to specific Ca2+ channel blockers, the predominantly affected N-type (CaV2.2) and P/Q-type (CaV2.1) Ca2+ channels, the inefficient Ca2+-dependent upregulation of release at neuromuscular junctions with the blockage of postsynaptic receptors, and the impaired regulation by GABAB receptors all could be explained by such a mechanism. VDCCs could be targeted or anchored by α-neurexins via binding partners such CASK and Mints that associate with both α- and β-neurexins (Hata et al., 1996; Butz et al., 1998; Biederer and Sudhof, 2000). Because CASK and Mint also bind to intracellular sequences of recombinant N-type Ca2+ channel subunit α1B (Maximov et al., 1999; Maximov and Bezprozvanny, 2002), this complex represents a candidate to anchor VDCCs and neurexins at the active zone. Future studies will have to explore the molecular interactions that actually link α-neurexins to VDCCs and will have to address directly the targeting of different VDCCs at normal and α-neurexin mutant synapses.
Footnotes
-
This work was supported by German Research Foundation (DFG) Grants Mi479/3-1 and SFB 406 (to M.M. and W.Z.) and by the DFG-Research Center for Molecular Physiology of the Brain (to D.S.). The European Neuroscience Institute Göttingen is funded jointly by the University of Göttingen Medical School, the Max Planck Society, and Schering AG (to M.R.). I.D. and M.A. were recipients of a Georg Christoph Lichtenberg Stipend (Ministry for Science and Culture of Lower Saxony, Germany). We thank Gerald W. Zamponi (University of Calgary, Alberta, Canada) for generous support in establishing Ca2+ current measurements from heterologous cells; T. Snutch (University of British Columbia, British Columbia, Canada) for rat cDNA clones of α1B, β1b, and α2δ; Dr. Parlow (National Hormone and Peptide Program, National Institute of Diabetes and Digestive and Kidney Diseases, Bethesda, MD) for providing antibodies against pituitary hormones; and S. Gerke for excellent technical assistance.
- Correspondence should be addressed to Dr. Markus Missler, Institute of Anatomy, Department of Anatomy and Molecular Neuroscience, Westfälische Wilhelms-University, Vesaliusweg 2-4, Münster D-48149, Germany. mmissle1{at}gwdg.de


