

Abstract
Rod and cone photoreceptors use specialized biochemistry to generate light responses that differ in their sensitivity and kinetics. However, it is unclear whether there are also synaptic differences that affect the transmission of visual information. Here, we report that in the dark, rods tonically release synaptic vesicles at a much slower rate than cones, as measured by the release of the fluorescent vesicle indicator FM1-43. To determine whether slower release results from a lower Ca2+ sensitivity or a lower dark concentration of Ca2+, we imaged fluorescent indicators of synaptic vesicle cycling and intraterminal Ca2+. We report that the Ca2+ sensitivity of release is indistinguishable in rods and cones, consistent with their possessing similar release machinery. However, the dark intraterminal Ca2+ concentration is lower in rods than in cones, as determined by two-photon Ca2+ imaging. The lower level of dark Ca2+ ensures that rods encode intensity with a slower vesicle release rate that is better matched to the lower information content of dim light.
Introduction
Retinal rods and cones are specialized for transducing and transmitting information about different ranges of light intensity. Rods respond to dim light, generating a slow, prolonged signal, whereas cones require brighter light, generating a rapid, more transient signal (Dowling, 1987). The distinct electrophysiological responses of rods and cones are attributable to differences in the biochemical machinery of phototransduction in outer segments (Tachibanaki et al., 2001; Kefalov et al., 2003, 2005; Rebrik and Korenbrot, 2004). However, it is unclear whether there are also intrinsic differences in rod and cone synapses that contribute to the distinct messages transmitted by the two cell types.
Rods and cones are depolarized in the dark, resulting in maintained activation of voltage-gated Ca2+ channels, continual Ca2+ influx, and tonic neurotransmitter release. Increasing light intensity induces a graded hyperpolarization that turns off these events and suppresses neurotransmitter release. Because neurotransmitter is packaged in synaptic vesicles that are released in a quantal manner, the precision of synaptic encoding is constrained by the ambient rate of release, which is maximal in the dark. The greater the release rate in the dark, the more accurately increments of light intensity can be represented by decrements in the release rate. Rods respond to dimmer light which, because of its quantal nature, includes fewer gradations of intensity. Hence, the signal-to-noise ratio of rods is lower than cones. Therefore, the rod light response conveys less information leading to the prediction that fewer vesicles are necessary for it to be encoded synaptically.
We previously measured dark release from photoreceptors in the cone-only retina of anole lizards (Choi et al., 2005a). We imaged the loss of the fluorescent synaptic vesicle dye FM1-43 and used electron microscopy (EM) to count synaptic vesicles in the terminals to estimate the vesicle release rate. Here, we measure release from rods, using fluorescence imaging and EM on the rod-only retina of geckos. We also estimate release rates from rods and cones of tiger salamanders. For both interspecies and intraspecies comparisons, we find that release in darkness is much slower in rods than cones, in accord with phasic release studies (Rabl et al., 2005), and consistent with the prediction that rods transmit information at a slower rate.
Because vesicle release is Ca2+ dependent, slower release must result from a lower intraterminal Ca2+ and/or a less Ca2+-sensitive release process. The Ca2+ dependence of phasic release from photoreceptors was evaluated by measuring over the first few seconds the change in membrane capacitance that occurs after elevating cytoplasmic Ca2+ (Rieke and Schwartz, 1994, 1996; Kreft et al., 2003; Thoreson et al., 2004). However, capacitance measurements are not ideal for studying tonic release because at longer times the capacitance increase from exocytosis is confounded by a decrease caused by endocytosis. Thus, the Ca2+ dependence of tonic release is still unknown. Moreover, the dark Ca2+ concentration is unknown in rod or cone terminals. Here, we show that the Ca2+ dependence of tonic release is similar in rods and cones, but in darkness, rods have a lower resting Ca2+ underlying their slower tonic release.
Materials and Methods
Retinal preparation
Procedures for the care and use of tokay gecko lizards (Gekko gecko), anole lizards (Anolis segrei), and larval tiger salamanders (Ambystoma tigrinum) were approved by the University of California Berkeley Animal Care and Use Committee. Animals were maintained on a 12 h light/dark cycle. All procedures were performed in darkness using infrared illumination and night-vision goggles. To obtain retinas, animals were dark-adapted overnight (1 h for anoles) and quickly killed by decapitation. After enucleation, eyes were hemisected and the retinas were removed. Retinas were bathed in normal saline for gecko [containing (in mm) 160 NaCl, 3.3 KCl, 1.5 CaCl2, 1.5 MgCl2, 10 HEPES, 10 glucose, pH 7.4], anole [containing (in mm) 149 NaCl, 4 KCl, 1.5 CaCl2, 1.5 MgCl2, 10 HEPES, 10 glucose, pH 7.4], or salamander [containing (in mm) 110 NaCl, 2 KCl, 2 CaCl2, 1 MgCl2, 10 HEPES, 10 glucose, pH 7.4). All dye solutions were made in normal saline unless otherwise stated. Ca2+-free saline replaced CaCl2 with 1 mm EGTA. High-K+ saline contained 50 mm KCl, iso-osmotically replacing NaCl.
FM1-43 dye loading and unloading
Measuring the FM1-43 unloading rate from gecko rod.
Procedures for FM1-43 loading and unloading were modified from those described previously (Choi et al., 2005a). The retina was mounted onto filter paper and loaded with 30 μm FM1-43 (Invitrogen, Eugene, OR) for 2 h and washed with 1 mm Advasep-7 (CyDex, Lenexa, KS) for 10 min. FM1-43 unloading was followed by imaging the outer plexiform layer (OPL) every 4 min in darkness, bright light (107 photons/μm2/s), or high-K+ saline. Fluorescence of FM1-43 was counted from the stack images through the OPL and normalized to the value t = 0. At the end of experiments of unloading in darkness or under bright light, high-K+ saline was added to release all releasable vesicles, and remaining background fluorescence was subtracted. Variability among data are expressed as mean ± SEM.
To test whether the two-photon scans altered the unloading rate of gecko rods, the FM1-43-loaded gecko retina was cut into a few pieces and placed in complete darkness. One piece of retina was taken out at t = 0 min, t = 10 min, and t = 20 min and transferred to Ca2+-free saline to stop unloading, and then imaged. For each piece of retina, FM1-43 fluorescence was averaged over five areas and normalized to the value t = 0.
Measuring FM1-43 loading rate from salamander photoreceptors.
The retina was bathed in 30 μm FM1-43 for 0–15 min, transferred to Ca2+-free saline, and dissociated as described previously (Rea et al., 2004). A suspension of dissociated retinal cells was then transferred onto a coverslip for imaging. Total fluorescence from photoreceptor terminals was measured and normalized to the value from cone terminals at t = 15 min. Forty optical sections (focused 0.5 μm apart) were obtained for each cell and total FM1-43 fluorescence from each terminal was calculated. Variability among data are expressed as mean ± SEM.
Fluorescence recovery after photobleaching.
FM1-43-loaded retinal slices were prepared as described previously (Rea et al., 2004). A 4 μm2 region of the photoreceptor terminal was photobleached by continually scanning three times at high laser power. Images were acquired every 3 s before and after photobleaching with a spatial resolution of 34 pixels per micrometer. Variability among data is expressed as mean ± SEM.
Calcium imaging with fura-2
Measuring Ca2+ dependence of release.
Retinas from gecko and anole were loaded with FM1-43 in darkness in normal saline. FM1-43 loaded retinas were sliced in Ca2+-free saline and transferred to Ca2+-free saline containing 5 μm fura-2 AM (Invitrogen) for 30 min. The double-labeled retinal slices were imaged using an upright Nikon (Tokyo, Japan) microscope. Fluorescence was detected with an Imago Sensicam (TILL Photonics, Planegg, Germany) via a 40 × 0.7 numerical aperture water-immersion objective (Olympus, Tokyo, Japan). The wavelength of excitation light was controlled with a Lambda 10–2 filter wheel (Sutter Instruments, Novato, CA). FM1-43 was excited with 490 nm light. Fura-2 was excited with 350 and 380 nm light for ratiometric measurement. A 510 ± 10 nm emission filter was used for both dyes. Images were acquired and analyzed with Imaging Workbench software (Indec BioSystems, Santa Clara, CA). Images of fura-2 and FM1-43 were acquired every 10 s and binned 4 × 4. The in vitro fura-2 calibration of the photometric system was performed with a fura-2 calcium imaging calibration kit (Invitrogen). Variability among data is expressed as mean ± SEM.
Measuring intraterminal Ca2+ concentration in darkness.
The retina was bathed in 125 μm fura-2 AM in darkness for 60 min. The retina was then washed and mounted on filter paper for imaging. The fura-2 ratio was obtained using two-photon excitation wavelengths of 700 and 760 nm and a 500–550 bandpass (BP) emission filter. To locate the photoreceptor terminals accurately, anole and salamander retina were preloaded with FM4-64 in darkness before fura-2 loading. OPL was first identified with FM4-64 fluorescence using a two-photon excitation wavelength of 880 nm and 575–640 BP emission filter. The in vitro fura-2 calibration of the two-photon imaging system was performed with a fura-2 calcium imaging calibration kit (Invitrogen).
Electron microscopy
Gecko and salamander retinas were prepared and fixed for EM as described previously (Rea et al., 2004; Choi et al., 2005a). Vesicle density in photoreceptor terminals was calculated from ultrathin EM sections (70 nm). The average terminal volume of gecko rods was calculated from three-dimensional (3D) reconstructions of EM sections using Reconstruct software (Synapse Web, http://synapse.bu.edu; Boston University, Boston, MA). The average terminal volume of salamander rods and cones was calculated from 3D reconstructions of fluorescence images of FM1-43-loaded terminals (Imaris software; Bitplane, Saint Paul, MN).
Results
Release of FM1-43 in the dark is slow in rods
We measured synaptic release from the rod-only gecko retina by analyzing the loss of FM1-43. We then compared this data with previous measurements of dye release from anole cones (Choi et al., 2005a). Gecko retina is advantageous because the rod terminals are large (5–10 μm diameter), facilitating optical measurements from an individual cell, and they are also homogenous, allowing simultaneous fluorescent measurement from an array of terminals in the OPL. Because the tokay gecko is nocturnal, its visual system is normally operating only in the scotopic range of light intensity. Gecko rods are thought to be transmuted from an ancestral cone photoreceptor and they still have some cone-like properties, including cone-like photopigments and a large pedicle-shaped terminal with multiple synaptic ribbons (Kojima et al., 1992; Röll, 2000). However, the intensity–response relationship and kinetics of the gecko rod light response are very similar to those of rods from other species (Kleinschmidt and Dowling, 1975; Rispoli et al., 1993), strongly suggesting that the gecko rod synapse encodes light information in a manner that is similar to rod synapses in other species.
Intact retinas were first loaded with FM1-43 in the dark, which, in the OPL, results in selective labeling of photoreceptor terminals (Choi et al., 2005b). To monitor dye release in the dark, we used two-photon microscopy, which uses infrared light to excite fluorescence while minimizing retinal phototransduction. Because infrared light penetrates deeply into tissue, two-photon imaging enables visualization of photoreceptor terminals through the thickness of a flat-mount retina (∼200 μm). Retinas were imaged every 2–4 min in the dark. We found that FM1-43 was released much more slowly from rods than cones (Fig. 1 A). Dye loss from both could be fit with a single exponential function, but with very different time constants (∼69 min for rods and 10 min for cones) (Fig. 1 B).
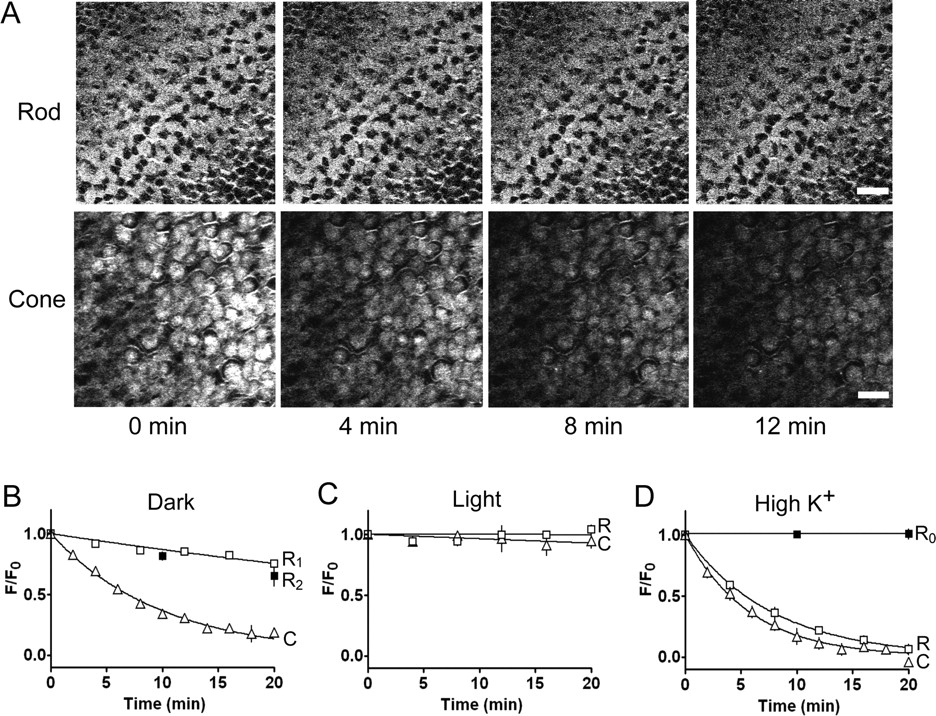
Gecko rods release FM1-43 slower than anole cones in darkness. A , Fluorescence images showing the gradual unloading of FM1-43 in darkness from synaptic terminals of gecko rods (top) and anole cones (bottom). Images were obtained by two-photon scans at 4 min intervals of a z section through the OPL in each retinal flat mount. Scale bars: top, 20 μm; bottom, 10 μm. B , Time course of unloading from rod (R) and cone (C) terminals in darkness, measured by repeated two-photon scans. Fluorescence was measured from the stack images through the OPL. Data for cones (triangles) in B–D were reported previously (Choi et al., 2005a). Continuous lines show fits to single exponential functions with release time constants of 69 and 10 min for rods (n = 8) and cones (n = 9), respectively. R1 (open squares) is for the rod unloading procedure with repeated two-photon scans; R2 (closed squares) is for unloading without scans (n = 3). At the end of experiments, high-K+ saline was added to release all releasable vesicles and remaining background fluorescence (∼6%) was subtracted ( D ). C , Time course of unloading from rod and cone terminals with the retina exposed to bright light between repeated scans. D , Time course of unloading in high-K+ saline from rods and cones. Remaining background fluorescence after unloading was not subtracted. Data was fit with single exponential function with release time constant of 7.7 and 5.9 min in rods (n = 4) and cones (n = 5), respectively. R0 (closed squares) is for gecko rod unloading in high K+, Ca2+-free saline (n = 3).
The different rates of release suggest that rods and cones have intrinsic differences in synaptic function. However, it is also possible that the infrared laser inadvertently excited photopigments in the outer segments of rods and cones and triggered phototransduction, which would inhibit vesicle release. We had established previously that FM1-43 release from cones is unaffected by altering the duration of infrared illumination (Choi et al., 2005a). However, rods are 50–100 times more sensitive to light than cones (Dowling, 1974), perhaps accentuating the problem of stimulating them inadvertently. To test for this, we measured FM1-43 release from preloaded pieces of gecko retina that were allowed to unload the dye in complete darkness for various times. To terminate unloading, the tissue was placed in Ca2+-free saline, and only then was the tissue visualized with two-photon microscopy. Dye loss measured with this protocol (Fig. 1 B, R2) involved no exposure to infrared light, yet the rate of dye loss was the same as that measured with repeated two-photon scanning (Fig. 1 B, R1) (p < 0.001, Student's t test). Hence, under these experimental conditions, two-photon scanning does not perturb the dark rate of FM1-43 release from rods.
FM1-43 release from gecko rods was completely suppressed by exposure to bright light (Fig. 1 C), similar to results obtained from anole cones (Choi et al., 2005a). Depolarizing rods with high-K+ saline (Fig. 1 D) triggered a rapid rate of release (τ = 7.7 min; n = 4 retinas) that was similar to that observed in cones (5.9 min; n = 5 retinas) (Choi et al., 2005a). Approximately 94% of the dye in rods was released after 20 min in high K+, suggesting that labeling of unreleasable (i.e., reserve) vesicles and/or other internal membranes accounts for at most 6% of the fluorescence. Release from both rods (Fig. 1 D) and cones (Choi et al., 2005a) was blocked by removing extracellular Ca2+, consistent with Ca2+-dependent exocytosis. Hence, given sufficient depolarization, both rods and cones are capable of faster release, indicating that in the dark their release machinery is not operating at full speed. For rods, the release rate in high K+ is approximately ninefold higher than the dark rate, and for cones it is 1.6-fold higher.
Quantifying synaptic vesicle release rates from gecko rods and anole cones
To quantify the rate of synaptic vesicle release, we needed the rate of FM1-43 release and the number of vesicles in the releasable (active) vesicle pool. This pool size equals the fraction of synaptic vesicles that is actively participating in release times the total number of vesicles in the terminal (which we determine by EM). In a phasic synapse, only a small fraction of synaptic vesicles can move to the active zone and be released (15–25% in hippocampal synapses) (Pyle et al., 2000; Richards et al., 2003); the rest are considered “reserve vesicles.” However, in a cone photoreceptor, most of the vesicles are releasable and there is little or no reserve. We knew that ∼86% of vesicles in a cone terminal accumulate FM1-43 within 10 min of loading (Choi et al. 2005a), closely matching the percentage of vesicles that remain mobile in the cytoplasm (87%), as determined by fluorescence recovery after photobleaching (FRAP) measurements (Rea et al., 2004).
To estimate the fraction of mobile vesicles in the gecko rod terminal, we again used FRAP. After applying high-K+ saline to saturate the loading of FM1-43 in gecko rods and then applying Ca2+-free saline to prevent release, retinal slices were imaged to find individual labeled rod terminals. A small area (4 μm2) in the center of a terminal was scanned with the two-photon laser at high power for 1 s (Fig. 2 A). This bleached the FM1-43 such that vesicles within this region were no longer fluorescent. Subsequent low-intensity scans showed that the fluorescence within the bleached region rapidly recovered and that the fluorescence in the remainder of the terminal decreased as vesicles redistributed. To assess the fraction of vesicles that are mobile, we measured the recovery of fluorescence in the bleached region compared with the average fluorescence in the remainder of the terminal (FRAP index) (Fig. 2 B). At steady state (21–30 s after the bleach) the FRAP index was 90%. This indicates that 90% of those vesicles that had accumulated dye during endocytosis remain mobile in the cytoplasm, similar to the releaseable fraction of vesicles in anole cones (86%). This similarity also suggests that few, if any, vesicles failed to accumulate dye during the initial loading of gecko rods. Indeed, neither rods nor cones contain synapsin (Mandell et al., 1990), the key protein that immobilizes vesicles and therefore holds them in reserve at conventional synapses (Huttner et al., 1983; Bähler and Greengard, 1987; Benfenati et al., 1989), suggesting the lack of a reserve pool in photoreceptors.

FRAP experiments show that most of the vesicles in the gecko rod terminal are mobile. A , Series of images taken from a single rod terminal in a slice preloaded with FM1-43, showing fluorescence before and after photobleaching of a 4 μm2 region (white square). Scale bar, 2 μm. B , Time course of FRAP in Ca2+-free saline. Photobleaching was triggered at time 0 and recovery was measured at various times thereafter. The FRAP index is the ratio of the fluorescence within the bleached region and the average fluorescence of the entire terminal, normalized to the prebleach ratio. The continuous line shows fit to a double-exponential function with time constants of 1.1 and 18 s. n = 3 terminals.
We used EM to visualize and quantify synaptic ribbons and synaptic vesicles in the gecko rod terminal. Photoconversion of a fixable FM1-43 analog shows that the dye is localized to synaptic vesicles in gecko rod terminals (data not shown), as demonstrated previously in anole cone terminals (Choi et al., 2005a). We calculated the total number of vesicles in gecko rods (156,000) by measuring the average number of vesicles per unit volume (1525 ± 69 per μm3; n = 5) and the average volume of terminals (102 ± 15 μm3; n = 5). Taking into account the percent that are mobile, gecko rod terminals contain ∼140,000 releasable vesicles (Table 1), similar to the 146,000 measured previously in anole cones (Choi et al., 2005a). By multiplying these values by the release rate determined from the initial FM1-43 unloading rate, we estimate that, in darkness, gecko rods release ∼35 vesicles/s, sevenfold fewer than we reported for anole cones (246 vesicles/s). Gecko rods have fewer ribbons than anole cones (14 vs 25), so the release rates per ribbon (2.5/s for rods and 10/s for cones) differ by approximately fourfold. Nevertheless, in darkness, the rods clearly release much more slowly than cones.
Synaptic vesicle release rates in rods and cones
However, in high K+, the situation is different; both rods and cones release at similar rates (∼300–400 vesicles/s). The release rate per ribbon was also similar in rods and cones (15–21 vesicles/s). Apparently, both rods and cones are capable of rapid tonic release, but in darkness, rods use this capability to a much smaller extent.
Quantifying synaptic vesicle release rates from salamander rods and cones
To confirm the difference between rod and cone release rates in the same species, we turned to the duplex retina of the tiger salamander. The terminals of salamander rods and cones are interspersed in the OPL and adhere to one another, making it difficult to separately measure FM1-43 fluorescence in the two cell types. We tried to avoid this problem by isolating rods and cones with intact terminals by enzymatic dissociation (Townes-Anderson et al., 1985), but their dye release in darkness was very slow or absent (our unpublished observations), suggesting disruption of physiological function. Therefore, we chose an alternate approach, measuring the rate of endocytosis (by FM1-43 loading), which at steady-state should equal the rate of exocytosis. The advantage was that loading could be performed on the intact retina and measurements of dye accumulation could be done after retinal dissociation.
To determine the rate of dye loading, salamander retina was incubated in FM1-43 for 0–15 min in the dark. The tissue was then washed in Ca2+-free saline to prevent additional loading or unloading. After enzymatic dissociation (Rea et al., 2004), individual large-type rods and large-type single cones were identified by morphological criteria (Sherry et al., 1998). In rods, the terminal is connected to the inner segment by a long thin axon, whereas in cones, the terminal emanates directly from the inner segment (Fig. 3 A). Fluorescence images show that FM1-43 accumulates in the rod and cone terminals. The dye subsequently could be released after depolarization with high-K+ saline (Fig. 3 B), confirming that, in the terminals, the dye had specifically accumulated in releaseable synaptic vesicles.

Dark loading of FM1-43 in salamander retina is slower in rods than in cones. A , Dissociated rod and cone obtained from a salamander retina preloaded with FM1-43 for 30 min. Bright field (left), FM1-43 fluorescence (center), and merged images (right) are shown. Note the FM1-43 accumulation in the bipartite rod spherule (arrowheads) and cone pedicle at the base of the cell body (arrow). Scale bar, 2 μm. B , FM1-43 fluorescence images of salamander retina slices. Transmitted light (red) and FM1-43 fluorescence (green) images are overlaid. Retina was preloaded with FM1-43 in the dark for 30 min. Before slicing, the retina was incubated in Ca2+-free saline (left) or high-K+ saline for 20 min. The positions of OPL are indicated with arrows. C , Time course of FM1-43 fluorescence uptake for rods (R) and cones (C) in darkness. Farb. is the measured fluorescence taken up during FM1-43 preloading of various durations, normalized to the fluorescence of saturation-loaded cone terminals (15 min FM1-43 loading in high-K+ saline). Loading time constant is 10 min for rods, 6 min for cones. n = 6–12 terminals for each data point. Open symbols represent the fluorescence of saturation-loaded rod (n = 11) and cone terminals (n = 12) (15 min FM1-43 loading in high-K+ saline).
Dye accumulated more rapidly in cone than in rod terminals (Fig. 3 C). Over the initial 1 min of loading, cones incorporated dye approximately fourfold faster. Even after dye loading had reached steady state in cones (5–7 min), it continued to accumulate in rods (>10 min). Assuming that each endocytosed synaptic vesicle captures the same amount of fluorescent dye, rods must endocytose synaptic vesicles more slowly than cones.
To estimate dye uptake in terms of vesicle endocytosis rate, we first assumed that prolonged incubation of retina in high-K+ saline resulted in the loading of all active vesicles in rods and cones with FM1-43, providing a measure of the maximal fluorescence in the terminals. The maximal dye uptake in cones is ∼2.5-fold that observed in rods, consistent with their having ∼2.4-fold more vesicles (Table 1), supporting the notion that all of the internalized dye remained localized to the terminals and was restricted to synaptic vesicles. Over a brief initial time period (1 min), the fractional accumulation of fluorescence represents the percentage of vesicles that were endocytosed during this time. Thus, each minute in darkness, cone and rod terminals endocytose 15.5 and 9.5% of their active vesicle pools.
The total number of vesicles was determined by measuring the terminal volume of rods (32.82 ± 6 μm3; n = 6) and cones (82.07 ± 12 μm3; n = 6) from z-stacks of dye-loaded terminals, and the average density of vesicles within rods (2714 ± 300 vesicles/μm3; n = 5) and cones (2628 ± 271 vesicles/μm3; n = 5), determined from EM analysis. These calculations indicate that rods and cones have, respectively, 89,100 and 215,600 vesicles. This is consistent with the smaller volume of the rod terminal. Assuming that the fraction of mobile vesicles is similar to that in gecko rods and anole cones (90%), the size of the cycling synaptic vesicle pool in salamander rods and cones is 80,200 and 194,000, respectively (Table 1).
Multiplying the cycling pool by the rate of endocytosis, we estimate that, in darkness, the synaptic vesicle uptake rate is 30,070 vesicles/min (501 vesicles/s) in cones and 7619 vesicles/min (127 vesicles/s) in rods, only 25% of the cone release rate. Our estimation of rod release rate is lower than previous estimates [∼400 vesicles/s (Rieke and Schwartz, 1996)], but these relied on capacitance measurements that report transient rather than tonic release. Hence, within a species as well as across species, rods exhibit slower tonic release than cones.
The Ca2+ dependence of release is similar in rods and cones
To understand what mechanisms cause rods to release vesicles more slowly than cones, we considered the role of Ca2+. The release rate in darkness depends both on the relationship between Ca2+ and release and the dark concentration of intracellular Ca2+.
To determine which of these parameters differ between rods and cones, we returned to the gecko and anole retinas to measure the Ca2+ dependence of release. This required simultaneous measurement of intracellular Ca2+ (with the fluorescent indicator fura-2) and vesicle release (with FM1-43). Our strategy was to monitor vesicle release while “clamping” intracellular Ca2+ at different levels by applying the Ca2+ ionophore ionomycin with different extracellular Ca2+ concentrations.
Gecko or anole retinas were loaded with FM1-43 and then placed in Ca2+-free saline to prevent unloading. They were then sliced and bathed in fura-2 AM, which entered cells, where it was converted into fura-2. To separately monitor Ca2+ and vesicle release, we used excitation wavelengths selective for fura-2 (350 and 380 nm) and FM1-43 (490 nm). In Ca2+-free saline, the fura-2 ratio was low in both gecko rod and anole cones, indicating low intraterminal Ca2+, but the FM1-43 signal was high, indicating many labeled vesicles (Fig. 4 A). We then treated the slices with ionomycin and added extracellular Ca2+. This increased intracellular Ca2+ throughout the tissue samples (Fig. 4 A). The rise in Ca2+ triggered a decrease in FM1-43 fluorescence, but this was selective for the OPL, where the photoreceptor terminals reside. Hence, ionomycin-facilitated Ca2+ entry caused synaptic vesicle release from both rod and cone terminals.

Simultaneous FM1-43 and fura-2 imaging shows that the Ca2+ dependence of release is similar in gecko rods and anole cones. A , Pseudocolor images of gecko and anole retinal slices preloaded with FM1-43 to measure vesicle release, and fura-2 to measure intracellular Ca2+. The fura-2 ratio and the intensity of FM1-43 fluorescence and are color-coded as shown below. The circled areas indicate the photoreceptor terminals. In Ca2+-free saline, the fura-2 ratio is low and FM1-43 fluorescence is high. After treatment with ionomycin plus extracellular Ca2+, the fura-2 ratio rises and FM1-43 fluorescence decreases. B , Time course of changes in Ca2+ and vesicle release triggered by adding extracellular Ca2+ to ionomycin-treated gecko retinal slices. Slices are first incubated in Ca2+-free saline and extracellular Ca2+ is added at time 0 (indicated with dash line). Before time 0, there is little FM1-43 unloading and FM1-43 fluorescence is normalized to the average FM1-43 fluorescence (t ≤ 0; F initial = F average). When Ca2+ rise reaches steady state after adding extracellular Ca2+ (∼3 min), FM1-43 fluorescence is normalized to the first point over the measurement time period (t ≥ 200 s; F initial = Ft200s ). The average fura-2 ratios and the FM1-43 unloading rates from OPL are then measured. C , Group data from gecko rods and anole cones showing similar relationship between Ca2+ and release. Intraterminal Ca2+ concentration and FM1-43 release rates were obtained as in B . FM1-43 release rates at similar intraterminal Ca2+ levels are binned together and then plotted. Continuous lines show least square fits to rod (black) and cones (gray) data.
Figure 4 B shows recordings of Ca2+ and release, using the gecko rods as an example. Each measurement was from a different retinal slice that was preincubated with the same concentration of ionomycin in Ca2+-free saline, and then exposed to saline with different concentration of extracellular Ca2+. The fura-2 ratio and the FM1-43 unloading rates were measured after internal Ca2+ had reached steady state (∼3 min after perfusion). A higher fura-2 ratio was always correlated with faster FM1-43 unloading.
By plotting data from many such experiments we could observe the relationship between the fura-2 ratio and the FM1-43 release rate (Fig. 4 C). For both rods and cones, the release rate accelerated with increasing intracellular Ca2+. Least-squares fits to the data show that the slopes of the Ca2+ versus release plots are nearly the same in rods and cones, consistent with the two cell types having similar release machinery. Hence, the difference in the dark release rate of rods and cones is not caused by a difference in the Ca2+ dependence of exocytosis.
Rods have a lower intraterminal Ca2+ concentration than cones
We next compared the dark concentration of Ca2+ in rod and cone terminals. To avoid triggering phototransduction, we began by using a nonratiometric Ca2+ dye that can be excited with two-photon infrared illumination (Oregon-green BAPTA, which is excited by 800 nm light). However, the amount of dye loading varied greatly among terminals in the intact retina, leading to variability in fluorescence. To circumvent this, we returned to fura-2, which can be imaged ratiometrically, thereby correcting for differences in dye loading. We used two-photon excitation of fura-2 at 700 and 760 nm instead of the usual excitation wavelengths (e.g., 350 and 380 nm). This confined excitation to a narrow focal plane within the OPL and minimized two-photon excitation of photopigment in outer segments, which are ∼50 μm deeper into the flat-mount retina.
Treatment of gecko retina with fura-2 AM led to greater dye accumulation in rod terminals than in surrounding structures, allowing clear identification of the terminals in the intact retina (Fig. 5 A). The ratio image showed that rod terminals have slightly lower Ca2+ than the surrounding tissue. In contrast, anole cones accumulate much less dye than the neighboring Müller glia cells (Fig. 5 B), which appear bright when illuminated with a single wavelength (700 or 760 nm). This made it difficult to identify cone terminals to selectively measure their fluorescence. To visualize cone terminals selectively, we preloaded the retina with FM4-64, a synaptic vesicle dye whose peak excitation and emission wavelengths do not overlap with those of fura-2. The ratio image shows that the cone terminals identified by FM4-64 have a higher 700/760 ratio and, therefore, a higher Ca2+ concentration than the surrounding tissue. Analysis of 41 gecko rods and 24 anole cones showed that rod terminals have significantly lower Ca2+ by 50% than cone terminals (157 ± 5 nm in rods, 317 ± 13 nm in cones; p < 0.05, Student's t test). In fact, there is almost no overlap in the ranges of Ca2+ concentrations observed in the two cell types.

The dark Ca2+ concentration is lower in terminals of gecko rods than anole cones. A , Gecko retina loaded with fura-2. The OPL was imaged by two-photon excitation of fura-2 with 700 and 760 nm light. Rod terminals preferentially accumulate the dye (e.g., boxed areas). Ratio image shows slightly lower Ca2+ in the terminals than in surrounding tissue. B , Anole retina coloaded with fura-2 and FM4-64. Fura-2 fluorescence excited by single wavelengths (700 or 760 nm) is bright in Müller cells (M) and dim in cone terminals (C), indicating relatively little dye accumulation. However, the 700/760 fura-2 excitation ratio is higher in cone terminals than Müller cells, indicating higher Ca2+. Cone terminals were unambiguously identified by their loading with FM4-64, imaged with 880 nm light. Merged imaged shows overlap between FM4-64 and fura-2 ratio images. C , Box plot of intraterminal Ca2+ concentration in gecko rod (n = 41 terminals) and anole cone terminals (n = 24 terminals). The centerline is the median value, the edges of the boxes are the 25th and 75th percentiles, and the extremes are the range of the data. D , Time course of changes in the excitation ratio of fura-2-loaded rod terminals elicited by continuous two-photon line scans. Terminals were continuously scanned with 700 and 760 nm light for 2 s. The fura-2 ratio drops by ∼5% over 2 s. n = 6 terminals. Scale bars: A , 10 μm; B , 5 μm.
We were again concerned that the light used for ratio imaging might have triggered phototransduction and therefore lowered intraterminal Ca2+, especially in rods. Our standard ratio image was obtained by scanning a two-dimensional area (0.01 mm2) of the OPL for a total of 970 ms with each excitation wavelength. To estimate the upper limit of Ca2+ perturbation that this illumination might cause, we repeatedly line-scanned an individual rod terminal with 700 or 760 nm light for 2 s. We found that the 700/760 ratio decreased by <3% over the first second of scanning and ∼5% over 2 s. During a line-scan, the light is concentrated on a single terminal, whereas during a two-dimensional scan, the light is spread over >100 terminals, with each receiving a small fraction of the total photon flux. Even disregarding this point, the decrease in the 700/760 ratio is much too small to account for the 50% difference of intraterminal Ca2+ that we observed between gecko rods and anole cones.
To test whether unhydrolyzed fura-2 AM was sequestered in organelles, which could distort cytoplasmic Ca2+ measurements, we substituted Ca2+ with Mn2+ (1.5 mm), a quencher of fura-2 fluorescence. We applied high-K+ saline to stimulate Mn2+ influx into terminals. We found that fura-2 fluorescence was reduced by up to 95% in both gecko rods and anole cones, confirming nearly complete hydrolysis and consistent with results from salamander (Szikra and Krizaj, 2006).
Finally, we compared the dark level of Ca2+ in salamander rods and cones. We used FM4-64 to identify photoreceptor terminals in the OPL and fura-2 to indicate intraterminal Ca2+. Rod terminals are spherical or ovoid and smaller than the adjacent cone terminals (Fig. 6 A, top). The 700/760 fura-2 ratio was consistently lower in rod terminals, which appear as relatively dark spots in pseudocolored ratio images (Fig. 6 A, bottom). Analysis of 36 rods and 19 cones showed that the intraterminal Ca2+ concentration is significantly lower by ∼29% in rods than in cones (236 ± 10 nm in rods, 332 ± 13 nm in cones; p < 0.05, Student's t test) in the dark. We tested the extent of inadvertent phototransduction by continuously line scanning individual terminals with 700 or 760 nm light for 2 s (Fig. 6 C). For rods, the 700/760 ratio decreased by ∼8% over the first second of scanning and <10% over 2 s, but the ratio decreased by the same extent in cones. Hence, inadvertent phototransduction decreased Ca2+ to the same extent in rods and cones and, therefore, cannot account for the difference of dark intraterminal Ca2+ in the two cell types.

The dark Ca2+ concentration is lower in terminals of salamander rods than in terminals of salamander cones. A , Salamander retinas were coloaded with FM4-64 (880 nm excitation) and fura-2 AM (700 and 760 nm excitation). Rod and cone terminals can be identified from their FM4-64 loading pattern. A pseudocolor image of the fura-2 ratio shows that rod terminals have lower Ca2+ than cone terminals. Fura-2 ratio is color-coded as shown below. White boxed regions (left) and magnified red boxed regions (right) show rod terminals (R) brightly labeled with FM4-64, but with lower fura-2 ratios than adjacent cone terminals (C). Scale bar, 5 μm. B , Box plot of intraterminal calcium concentration in salamander rod (n = 36 terminals) and cone terminals (n = 19 terminals). The centerline is the median value, the edges of the boxes are the 25th and 75th percentiles, and the extremes are the range of the data. C , Time course of changes in the excitation ratio of fura-2-loaded rod and cone terminals elicited by continuous two-photon line scans. Terminals were continuously scanned with 700 and 760 nm light for 2 s without any additional illumination. The fura-2 ratio drops by ∼9% over 2 s in both rods (n = 9 terminals) and cones (n = 5 terminals). The similar effects of scanning may be explained by the preferential sensitivity to long-wavelength light of L-type salamander cones over rods, offsetting their higher quantum efficiency (Cornwall et al., 1984; Perry and McNaughton, 1991; Stella and Thoreson, 2000).
Discussion
Functional imaging of photoreceptor terminals
Fluorescent indicator dyes enable the functional imaging of visual system activity in vitro (MacLean et al., 2006) and in situ (Ohki et al., 2005). However, optical imaging of the retina presents a problem: light used to excite fluorescent indicators and the resulting emitted light can inadvertently activate phototransduction in rod and cone outer segments, altering activity in their synapses and in downstream neurons. Two-photon microscopy helps alleviate this problem. First, it uses infrared light, which is relatively ineffective in triggering phototransduction. Second, two-photon excitation is confined to a narrow focal plane (<1 μm thick), minimizing photopigment activation in off-target focal planes.
Despite these advantages, two-photon scanning can trigger inadvertent phototransduction, as reported in previous studies monitoring fast Ca2+ transients in response to light stimuli in ganglion (Denk and Detwiler, 1999) and amacrine cells (Euler et al., 2002). Therefore, it was important to gauge how much inadvertent phototransduction might confound our measurements. Eliminating exposure to two-photon illumination in rods (Fig. 1 B) or changing its duration in cones (Choi et al., 2005a) had no effect on vesicle release rate, measured with FM1-43. However, continuous line scans of rod or cone terminals did trigger phototransduction, leading to a 5–10% drop in the fura-2 ratio over 2 s (Figs. 5 D, 6C). If we had wanted to monitor Ca2+ continuously, for example, to track transients in response to light flashes, this would have been a problem. However, because we were monitoring only steady-state Ca2+ and tonic vesicle release, the scan could be applied infrequently, or even only once. By sacrificing temporal resolution, we obtained reasonably accurate measurements with little interference from inadvertent phototransduction.
To quantify Ca2+ in photoreceptor terminals without triggering phototransduction in outer segments, we used the novel approach of two-photon ratiometric fura-2 imaging. Our results provide information about average levels of Ca2+ in the terminals. However, because the Ca2+ channels are localized near the synaptic ribbons (Nachman-Clewner et al., 1999; Morgans et al., 2005), a gradient of Ca2+ is likely in darkness. Observing this gradient and accurately measuring submembrane Ca2+ at the release sites are technical challenges, but such measurements could help elucidate the mechanisms underlying dark release.
Our studies involve an interspecies comparison between gecko rods and anole cones and an intraspecies comparison between rods and cones of tiger salamander. Presumably, two-photon FM1-43 and Ca2+ imaging can also be applied to mammalian photoreceptors, but the small size of rod terminals (∼1 μm diameter) makes them difficult to unambiguously distinguish from surrounding tissue. Moreover, we found that isolated mouse and rat retinas begin to deteriorate during the long time course required for dark loading of FM1-43 into rods, such that subsequent release is impaired, even in high K+. Genetically expressed indicators of vesicle fusion (e.g., synaptopHluorin) (Miesenböck et al., 1998; Bozza et al., 2004; Li et al., 2005) may provide a more effective way to study release from mammalian rod and cone terminals.
Mechanisms underlying slower dark release from rods
The synaptic vesicle release rate from photoreceptor terminals is determined by the nature of the Ca2+-dependent release machinery and the dark concentration of Ca2+. Rods and cones have the same subtypes of exocytotic and endocytotic proteins, although there are differences in their relative abundance (Sherry and Heidelberger, 2005). Also, synaptic vesicle protein 2B is found in rods and not cones (Wang et al., 2003), but its function is unclear. Despite these differences, we find the same Ca2+ dependence of release from rods and cones.
In contrast, we show direct evidence for lower dark intraterminal Ca2+ in rods. This could reflect differences in Ca2+ entry or removal from the cytoplasm. Although rods and cones exhibit some differences in L-type Ca2+-channel subtypes (Morgans et al., 2005), the voltage dependence of activation is similar in dissociated rods and cones (Corey et al., 1984; Maricq and Korenbrot, 1988; Barnes and Hille, 1989; Rieke and Schwartz, 1994; Wilkinson and Barnes, 1996; Savchenko et al., 1997; Hosoi et al., 2005). However, the Ca2+ current in cone, but not rod terminals is modulated by horizontal cell feedback (Verweij et al., 1996; Cadetti and Thoreson, 2006), so in the intact retina, the voltage-dependent activation of rod and cone Ca2+ current may differ substantially. Moreover, group III metabotropic glutamate receptors and exocytosed protons can modulate the Ca2+ current of cones, but not rods (Hosoi et al., 2005). L-type Ca2+ channels are the sole pathway for extracellular Ca2+ entry in rods, but cyclic nucleotide-gated channels also contribute to Ca2+ influx in cones (Rieke and Schwartz, 1994; Savchenko et al., 1997). Also, Ca2+-induced Ca2+ release from intracellular stores is more pronounced and contributes to tonic release in rods, but not cones (Krizaj et al., 2003; Suryanarayanan and Slaughter, 2006). Thus, there are several differences in the Ca2+ entry pathways and in the modulation of voltage-gated Ca2+ channels that could contribute to the lower dark level of Ca2+ in rods.
The main route of Ca2+ extrusion from photoreceptor terminals is through the plasma membrane Ca2+-ATPase (PMCA) (Krizaj and Copenhagen, 1998). The most abundant isoform, PMCA1, is found in both rods and cones (Krizaj et al., 2002). However, the PMCA2 isoform, which has a higher Ca2+ affinity, is expressed only in rods (Duncan et al., 2006). This could contribute to rods having a lower intraterminal Ca2+ concentration than cones and, therefore, a slower release rate in the dark. Indeed, knock-out mice lacking PMCA2 exhibit impaired rod synaptic transmission and reduced visual sensitivity to scotopic light (Duncan et al., 2006), suggesting that low Ca2+ in rod terminals is essential for normal visual function.
Synaptic encoding of light intensity in rods and cones
Rods respond to dim light, which, because of photon fluctuations, has a lower signal-to-noise ratio than bright light (Rose, 1973). We have shown that rods release synaptic vesicles more slowly than cones by fourfold to sevenfold. Release of vesicles from rods may occur at regular intervals (Schein and Ahmad, 2005), or by a stochastic process that follows Poisson statistics (van Rossum and Smith, 1998; Berntson et al., 2004). In either case, slower release would make the rod synapse less precise in encoding increments of light intensity than the cone synapse. We reported previously that the dark release rate from anole cones allows reliable distinction of 10 steps of light intensity, assuming Poisson release (Choi et al., 2005a). Applying the same statistical analysis, the dark release rate from gecko rods would allow distinction of only four steps. Thus, the slow release from rods has evolved to match the precision of signal output to the information content of light input, which optimizes use of the limited resource of continuously cycling vesicles (Laughlin, 1994; Sterling, 2004). For the same reason, one might expect chromatic cones types with higher absolute light sensitivity and, therefore, less precise encoding of light information, to have a lower tonic vesicle release rate. Selective genetic expression of a fluorescent indicator of vesicle release (i.e., synaptopHluorin) could confirm whether the correlation between high sensitivity and low release rate is a general phenomenon.
Our estimate of the dark release rate from gecko rods (35 vesicles/s) is surprisingly slow, even when compared with salamander rods (127 vesicles/s). Our only assumption in these estimations was that ∼90% of vesicles are available for release. Both the lack of synapsin (Mandell et al., 1990) and our FRAP results suggest that few vesicles are held immobilized in a reserve pool. The presence of any vesicles that are unavailable for release would result in an overestimate of the release rate; thus, 35 vesicles/s is actually an upper limit of the dark release rate from gecko rods. If transmission from gecko rods were similar to that from mouse rods (Field and Rieke, 2002; Sampath and Rieke, 2004), this slow rate of release would be sufficient to saturate glutamate receptors on On-bipolar cells. Perhaps the particularly slow release from gecko rods is coupled with particularly slow glutamate reuptake to ensure saturation of metabotropic glutamate receptors.
Although rods conserve energy by releasing slowly in the dark, they are capable of tonic release at an approximately ninefold higher rate, given sufficient depolarization with high K+. Cones have an excess release capability of ∼1.6-fold higher than the dark rate, which may be important for horizontal cell feedback to expand the temporal and spatial contrast sensitivity of synaptic transmission (Choi et al., 2005a). The role of the enormous excess release capability of rods is unknown, but it coincides with other aspects of rod physiology. A large excess of the phototransduction machinery, including the number of rhodopsin molecules and cyclic nucleotide gated channels, is important for maximizing light sensitivity (Yau and Baylor, 1989). Likewise, the excess magnitude of the Ca2+ conductance, synaptic vesicle number, and synaptic vesicle release rate may be crucial for maximizing the speed and reliability of signal transfer at the rod synapse.
Footnotes
-
This work was supported by National Eye Institute Grant EY15514. We thank Skyler Jackman for helpful comments on this manuscript.
- Correspondence should be addressed to Dr. Richard H. Kramer, Department of Molecular and Cell Biology, 121 Life Sciences Addition, University of California, Berkeley, CA 94720-3200. rhkramer{at}berkeley.edu


