

Abstract
Tumor overexpressed gene (TOG) protein, encoded by cytoskeleton-associated protein CKAP5, is a microtubule-associated protein that binds to heterogeneous nuclear ribonucleoprotein (hnRNP) A2. hnRNP A2 is an RNA trafficking factor that associates with myelin basic protein (MBP) mRNA. In oligodendrocytes, TOG, hnRNP A2, and MBP mRNA colocalize in granules that assemble in the perikaryon and are transported to the peripheral network of processes that extends from it. MBP accumulates preferentially in the membrane of the medial and distal portions of these cellular processes. MBP expression was reduced when TOG level was lowered by short-hairpin (sh) RNA. The reduction in TOG did not affect overall cell morphology or the assembly, transport, localization, or number of MBP mRNA-containing granules. Reduced levels of TOG did not affect another oligodendrocyte-specific component, myelin oligodendrocyte glycoprotein, which is expressed at the same time as MBP but translated from mRNA localized in the cell body. Expression in a neural cell line of a green fluorescent protein (GFP)–MBP fusion protein derived from a construct containing GFP and the full-length cDNA for the rat 14 kDa MBP was reduced when TOG level was lowered by shRNA treatment. Expression of GFP, derived from GFP mRNA containing the hnRNP A2 binding element of MBP mRNA, was similarly reduced in cells with low TOG levels. These data indicate that TOG is necessary for efficient translation of MBP mRNA and suggest that this role is mediated by its interaction with hnRNP A2.
- cell culture
- differentiation
- PCR-based short-hairpin RNA interference
- RNA trafficking
- translation
- fluorescence microscopy
Introduction
Oligodendrocytes are the myelin-forming cells in the CNS. In culture, they extend long, branched, and interconnected processes that terminate in a myelin-like membrane. A major protein of this membrane is myelin basic protein (MBP). MBP mRNA is enriched in myelin and processes of oligodendrocytes, in which MBP is preferentially located, suggesting that these are the sites of translation (Colman et al., 1982; Campagnoni et al., 1991; Amur-Umarjee et al., 1997; Barbarese et al., 1999). MBP mRNA starts to accumulate in oligodendrocytes 3–4 d after their isolation from mixed cultures, and the protein can be detected 1–2 d later (Zeller et al., 1985) (our results). Other myelin-specific proteins, such as proteolipid protein (PLP) and myelin-oligodendrocytic glycoprotein (MOG), follow the same developmental pattern of expression, but, in contrast to MBP, they are synthesized in the oligodendrocyte cell body (Sorg et al., 1986; Holz et al., 1996).
MBP mRNA contains two tandem cis-acting heterogeneous nuclear ribonucleoprotein (hnRNP) A2 response elements (A2REs) within its 3′ untranslated region (UTR) that bind hnRNP A2 (Ainger et al., 1997; Hoek et al., 1998). At least one A2RE is necessary for transport of MBP mRNA to the cell periphery. The trafficking complexes termed RNA granules move along microtubules and contain among other components, hnRNP A2 and the microtubule-associated protein tumor overexpressed gene (TOG) (Carson et al., 1997). hnRNP A2 and TOG interact in vitro and in vivo (Carson and Barbarese, 2005; Kosturko et al., 2005).
MBP mRNA also contains within its 3′ UTR a cytoplasmic polyadenylation element (CPE) that binds the cytoplasmic polyadenylation element binding protein (CPEB). This complex includes maskin and inhibits translation by sequestering the eukaryotic initiation factor 4E (Mendez and Richter, 2001; Du and Richter, 2005; Richter and Sonenberg, 2005). Maskin is the Xenopus ortholog of the human transforming acidic coiled coil (TACC) protein. TACC1 has been identified as a TOG binding partner in a yeast two-hybrid screen (Lauffart et al., 2002). However, there is no reported interaction between TACC1 and CPEB, and TOG has not been implicated previously in translational regulation (Conte et al., 2003; O'Brien et al., 2005).
TOG has been best characterized as a microtubule-associated protein. In dividing cells, it interacts with TACC, localizes with the centrosome and spindle microtubules, and may be necessary for microtubule rearrangement and spindle assembly (Charrasse et al., 1998; Lee et al., 2001). TOG may also be necessary for the proper interaction of microtubules with the cell cortex for directional cell movement (Hestermann and Graf, 2004).
To delineate the role of TOG in the MBP mRNA trafficking pathway, we knocked down its expression in postmitotic, myelinating oligodendrocytes and in a neural cell line and measured the effects on MBP expression. Because TOG is a microtubule-binding protein that associates with mRNA-containing granules transported on microtubules, we hypothesized that TOG knockdown would impair granule formation and/or transport of MBP mRNA. Our results disprove this hypothesis and suggest that TOG plays a role in translation of MBP mRNA.
Materials and Methods
Cell culture.
Primary glial cultures were prepared from the brains of rats at postnatal days 1–3. Oligodendrocytes were isolated from these cultures by the method of McCarthy and de Vellis (1980). The B104 rat neuroblastoma cell line (Schubert et al., 1974) was grown in DMEM/F-12 containing 5% fetal calf serum. Procedures for animal use were approved by the Animal Care Committee of the University of Connecticut Health Center and followed federal guidelines for research with animals.
Immunofluorescence.
Cells were fixed for 20 min at room temperature (RT) with 3.7% formaldehyde, permeabilized with 0.1% NP-40 for 1 min at RT, incubated with a blocking solution and successively with primary and secondary antibodies, and finally covered with Prolong Gold anti-fade reagent (Invitrogen, Carlsbad, CA). Mouse monoclonal antibody to hnRNP A2 (1:400 dilution) was obtained from Dr. William Rigby (Dartmouth Medical School, Lebanon, NH) (Nichols et al., 2000). Affinity-purified chicken anti-TOG (1:50 dilution) was produced by Aves Labs (Tigard, OR) under contract by using the peptide encompassing residues 529–545 from human TOG. Rat TOG differs from human TOG at positions 535 and 537 but is recognized equally well by the antibody in Western blot analysis (data not shown). Antibody to tubulin (1:100) was obtained commercially (Sigma, St. Louis, MO). Chicken anti-MBP (1:50) was produced in our laboratory. Mouse monoclonal antibody MOG 8-18C5 was used at 1:50 dilution (Dr. C. Linington, Max Planck Institute for Neurobiology, Martinsried, Germany). Rat monoclonal antibody to PLP was a generous gift from Dr. A. Gard (University of South Alabama, Mobile, AL) (Gard and Dutton, 1987). Secondary conjugated antibodies were purchased from Jackson ImmunoResearch (West Grove, PA). Images were collected using a Zeiss (Thornwood, NY) LSM 510 confocal laser scanning microscope with a 63×, 1.4 numerical aperture oil immersion objective by simultaneous recording in the 488λ, 568λ, and/or 647λ channels when appropriate.
To compare the level of expression of TOG and PLP in control and treated oligodendrocytes, the fluorescence intensity of the antigen–antibodies complexes was measured from images collected by confocal fluorescence microscopy. A mask of individual oligodendrocytes was created using the red channel (dextran-filled cell) and the fluorescence intensity over the mask integrated in the green channel (TOG or PLP) using Adobe Photoshop software (Adobe Systems, San Jose, CA).
The fluorescence intensity of granules was obtained using a specialized macro for the NIH Image 1.6 program, and single granule ratiometric analysis was performed (Mouland et al., 2001).
Western blot.
Proteins from cultured oligodendrocytes solubilized in M-Per mammalian protein extraction reagent (Pierce, Rockford, IL) were run on 4–12% polyacrylamide/Bis-Tris gels and transferred electrophoretically onto Immobilon-P membranes (Millipore, Bedford, MA). Immunodetection was done using chicken anti-MBP (1:1000), mouse anti-MOG (1:3000), mouse anti-β-actin (1:5000) (Sigma), and appropriate secondary antibodies conjugated to peroxidase. Chemiluminescent substrate (Pierce) was used to detect positive reactions, and the membranes were exposed to x-ray films.
Preparation of PCR products containing U6 promoter and short hairpin RNA.
We used a modified version of the protocol of Gou et al. (2003). Using BamHI-digested plasmid pSilencer2.0-U6 (Ambion, Austin, TX) as a template, human U6 promoter followed by a rat 29 nt sense strand of small interfering RNA (siRNA), a 9 nt loop (5′-TTCAAGAGA-3′), a 29 nt antisense siRNA, and a stretch of six deoxythymidines [poly(T)6] were amplified by two-step PCR. The forward primer, 5′ PU6F (5′-TGAATTCCCCAGTGGAAAGACG-3′), is complementary to the 22 nt at the 5′ end of the U6 promoter and was used for all PCR steps. In the first round of PCR, the reverse primer, 3′ primer 1, consisted of (5′) the 9 nt loop, a 29 nt antisense sequence, and GATCCCG from the U6 promoter (3′) (5′-TCTCTTGAACCTCCTCCTCCACAGCTAACATCGATGACGATCCCG - 3′). The reaction conditions were as follows: 94°C, 3 min; 94°C for 30 s, 17°C for 40 s, 72°C for 40 s, 5 cycles; 94°C for 30 s, 60°C for 40 s, 72°C for 40 s, 35 cycles; and 72°C, 10 min. Half microliter of this first PCR mixture was reamplified in the second round of PCR using the same forward primer 5′ PU6F and a new designed reverse primer, 3′ primer 2 (5′-AAAAAAGTCATCGATGTTAGCTGTGGAGGAGGAGGTCTCTTGAAC - 3′), which contains (5′) poly(A)6, a 29 nt sense strand of siRNA, and a complementary sequence to the 9 nt loop (3′). The PCR products were purified using QIA-quick PCR purification kit (Qiagen, Hilden, Germany). Although the final product was specifically designed to knock down TOG in Rattus norvegicus cells, sequence similarity could allow TOG knockdown in Homo sapiens and Mus musculus cells.
Control short hairpin RNA (shRNA) was generated following the same protocol as TOG shRNA but using alternative reverse primers that introduced five nucleotide substitutions. The reverse primers used were as follows: primer 1, 5′-TCTCTTGAACCTCCTCTTCTACAGCTCACTTCGTTGACGATCCCG-3′; and primer 2, 5′-AAAAAAGTCA-ACGAAGTGAGCTGTAGAAGAGGAGGTCTCTTGAAC-3.
Green fluorescent protein–MBP and green fluorescent protein-A2RE.
An enhanced green fluorescent protein (EGFP)–MBP construct was generated by PCR amplification of the full-length 14 kDa MBP DNA using two primers (5′-GCGAGATCTATGGCATCACAGAAGAGACCCTC-3′ and 5′-CGCCCCGGGCAAGTTTATTATTTTATTTC-3′) located at the start codon and 20 nt preceding the poly(A) tail. The product, containing the 14 kDa MBP coding region, the full-length 3′ UTR, and BlgII and SmaI restriction sites, was inserted into the pEGFP–C1 vector (Clontech, Mountain View, CA), and the sequence was confirmed.
Capped and polyadenylated RNA encoding GFP was prepared from template DNA (RTS11) with the A2RE sequence inserted into the 3′ UTR (Kwon et al., 1999). In vitro transcription and capping were performed according to the instructions of the manufacturer (Ambion). Transcripts were run on gels to evaluate size and concentration before their use.
Transfection.
Oligodendrocytes were microinjected with ∼100 fl of a mixture of 1 μl of PCR product (40 ng/μl) (see above), 1.5 μl H2O, and 0.5 μl of fluorescent dextran and incubated 24–60 h at 37°C and 6% CO2. B104 cells were similarly injected or injected with plasmid DNA from a vector containing an shRNA construct to mouse TOG (TOG shRNAmir, clone V2MM_105161) obtained from Open Biosystems (Huntsville, AL). The corresponding rat sequence is predicted to be identical. Cells were examined live and/or fixed and immunostained with the appropriate antibodies.
Microinjection of cells plated on glass bottom dishes (MatTek, Ashland, MA) was performed using an electronic microinjection system (Eppendorf, Hamburg, Germany). The volume injected represents <10% of the cell volume. The injection volume is an estimate based on the instrument specifications. The cell volume is estimated from three-dimensional reconstruction of dextran-filled cells and comparison with values reported for other cell types. Live oligodendrocytes were identified by their morphology for microinjection. After fixation, the identity of the injected cells was confirmed when possible by immunostaining for 2′:3′-cyclic nucleotide 3′-phosphohydrolase (CNP); >99% of the injected cells were CNP positive.
The membrane potential of control and injected oligodendrocytes was determined as described by Farkas et al. (1989).
In vivo translation assay.
B104 cells were plated in gridded, glass-bottom dishes (MatTek) and microinjected with PCR products to generate TOG shRNA (Fig. 1A, bottom) or control shRNA or with plasmid DNA from an shRNA construct to TOG, TOG shRNAmir (clone V2MM_105161; Open Biosystems) (Fig. 1A, top), and incubated for 24 h. Microinjected B104 cells were localized in the gridded dishes and microinjected a second time with GFP–MBP cDNA and Alexa Fluor 546-conjugated dextran. The latter identifies injected cells, and its intensity is a measure of the amount of DNA injected. The fluorescence intensity of GFP–MBP synthesized over a 24 h period, immunodetected TOG, and dextran were monitored by confocal microscopy and quantified using MetaMorph imaging system (Universal Imaging, Downingtown, PA). shRNA-treated B104 cells were also injected with capped and polyadenylated GFP–A2RE or GFP–A8G RNA and Alexa Fluor 546-conjugated dextran, and the fluorescence intensity of GFP was similarly measured. GFP–A2RE RNA and GFP–A8G RNA concentrations in the injection mix were ∼100 ng/μl.

TOG expression is reduced by shRNA treatment. A, Sequence, target localization, and putative folding of the short hairpin RNAs (Open Biosystems, top; produced in our laboratory, bottom) used to target TOG RNA. B–E, Four-day-old oligodendrocytes were microinjected with a mixture of TOG shRNA and Alexa Fluor 546-conjugated dextran (B, C) or control shRNA and Alexa Fluor 546-conjugated dextran (D, E) (microinjected and Alexa Fluor 546-conjugated dextran-positive cells are indicated by arrows). Cells were fixed after 24 h and immunostained for TOG (B, D). Arrowheads indicate non-microinjected cells. B and C are the same field. D and E are the same field. Scale bar, 20 μm.
In both protocols, fluorescence intensities of dextran and of GFP synthesized over a 6 h time period after injection of the RNA were monitored by dual-channel confocal microscopy and quantified using Adobe Photoshop. For quantification of fluorescence intensities, a square frame of fixed dimensions was positioned over the area of the cell body, exclusive of the nucleus, to obtain two independent, nonoverlapping samples of fluorescence intensity for each cell. The mean intensity of pixels within the frame was calculated for each channel. Similarly, the frame was positioned over nonoverlapping areas outside the cell to obtain two independent measurements of background fluorescence intensity for each cell. The average value of background intensity was subtracted from the average value of cytoplasmic intensity for the green channel. The amount of GFP accumulated in each cell, expressed as 488λ fluorescence intensity units, was plotted as a function of the amount of dextran (as a measure of injected volume of RNA) into that cell, expressed in 546λ fluorescence intensity units.
Fluorescence in situ hybridization.
The open reading frame (ORF) sequence (158 nt) common to all rat MBP mRNAs was amplified from a plasmid containing the MBP 14 kDa using the flanking primers ACACACAAGAACTACCCACTACGG and AGCTAAATCTGCTGAGGGACAG. The reaction conditions were as follows: 94°C, 3 min; 94°C for 30 s, 56.6°C for 40 s, 72°C for 40 s, 35 cycles; and 72°C, 10 min. An aliquot of this PCR product (0.5 μg) was used as template for PCR digoxigenin (DIG) labeling using a DNA DIG labeling mix (Roche, Mannheim, Germany). PCR conditions were as follows: 94°C, 3 min; 94°C for 30 s, 56°C for 40 s, 72°C for 40 s, 35 cycles; and 72°C, 10 min. DNA products were purified after each PCR to avoid primer, protein, or dNTP contaminants. Confirmation of probe labeling was shown by its slower migration than the original template in a 1.4% agarose gel attributable to the incorporation of digoxigenin-labeled nucleotides and further by dot blot. For the latter, 1 μl of probe and 1 μl of a 1:10 dilution were applied to a Biodyne nylon membrane (Pall, Glen Cove, NY), dried, and incubated 2 h at 80°C. Immunodetection of the probe was performed using mouse anti-digoxin (Sigma) and alkaline phosphatase-labeled goat anti-mouse (Sigma).
Primary cell cultures grown on glass coverslips were fixed with 3.7% formaldehyde in PBS for 20 min and then washed twice with 1× PBS. Cells were permeabilized with 70% ethanol overnight at 4°C. Cells were treated 15 min with 0.2 m HCl at RT and washed 5 min with 2× SSC and 5 min with washing buffer (2× SSC plus 50% formamide). Cells were prehybridized with hybridization buffer (50% formamide, 2× SSC, 1 mg/ml Escherichia coli tRNA, 10% dextran sulfate, 2 mm vanadyl-ribonucleoside complex, and 0.02% RNase-free BSA) for 10 min at RT. DIG-labeled DNA probes were heat-denatured 5 min, chilled, and mixed with hybridization buffer. Cells were hybridized with DNA probes (5 ng/ml) overnight at 37°C in a humidified chamber. They were washed twice for 30 min with washing buffer at 37°C in a humidified chamber and once with 1× SSC for 30 min at RT. They were then blocked with blocking buffer (0.2% BSA in 1× PBS) for 10 min, incubated with mouse anti-digoxin (1:100; Sigma), washed three times for 5 min, incubated with fluorescein-conjugated donkey anti-mouse (1:200; Jackson ImmunoResearch), washed three times for 5 min, and covered with Prolong Gold anti-fade reagent. B104 neuroblastoma cells were used as negative control to confirm the specificity of the synthesized probe.
Results
TOG shRNA reduces TOG level in oligodendrocytes and impairs MBP expression
The expression of TOG was reduced (knockdown) using a PCR construct that expresses shRNA under the control of U6 promoter (see Materials and Methods). The target sequence for the active shRNA is located at the 3′ end of the ORF of TOG (Fig. 1A). TOG shRNA PCR product (Fig. 1B,C) or control shRNA PCR product (Fig. 1D,E) was mixed with Alexa Fluor 546-conjugated dextran and microinjected in oligodendrocytes grown in monolayer culture. Cells were cultured for an additional 24 h, fixed, and immunostained with anti-TOG antibodies and a fluorescein-conjugated secondary antibody (Fig. 1B,D). Microinjected oligodendrocytes were identified by the presence of dextran and are marked by arrows (Fig. 1C,E). Control (not injected) cells in the same fields are marked by arrowheads. Ninety percent (± 7%) of TOG shRNA-treated oligodendrocytes showed a reduction of TOG immunostaining intensity (Fig. 1B, arrows) when compared with control shRNA-treated oligodendrocytes (Fig. 1D, arrow). The latter were indistinguishable from untreated cells (Fig. 1D, arrowheads). TOG fluorescence intensity of TOG shRNA-treated cells was reduced 64 ± 14% compared with control shRNA-treated cells. This is similar to the overall reduction in TOG protein observed in HeLa cells treated with TOG siRNA (Gergely et al., 2003; Holmfeldt et al., 2004). Cell morphology and gross microtubule organization were not affected by either TOG or control shRNA treatment as visualized by immunostaining with antibodies to α-tubulin (Fig. 2). These results are also in agreement with the report of Gergely et al. (2003) on microtubule organization in interphase cells. The resting membrane potential of noninjected cells and of cells injected with control or TOG shRNA was determined by the method of Farkas et al. (1989) using tetramethyl rhodamine ethyl ester to monitor cell physiology. There was no significant difference associated with treatment, and the value (−67 mV) was comparable with that reported by Sontheimer et al. (1989).

Cell morphology and microtubule organization are unchanged in TOG shRNA-treated oligodendrocytes. Oligodendrocytes were microinjected with a mixture of control shRNA and Alexa Fluor 546-conjugated dextran (A) or with TOG shRNA and Alexa Fluor 546-conjugated dextran (B), grown, fixed 48 h later, and immunostained with anti-TOG (C, D) and anti-tubulin (E, F). A, C, and E are the same cell; B, D, and F are the same cell.
MBP mRNA transport into the oligodendrocyte processes network is a microtubule-dependent process (Carson et al., 1997). Because TOG is associated with MBP mRNA transport granules (Kosturko et al., 2005), the effect of TOG knockdown on the MBP mRNA trafficking pathway was analyzed. MBP expression is developmentally regulated in cultured oligodendrocytes. MBP transcripts are few at 4 d in culture, become abundant at 5 d, and remain high at 7 d (Fig. 3A–D). The accumulation of MBP visualized by immunofluorescence (Fig. 3E–H) or analyzed by Western blot (Fig. 3I) follows the same pattern. TOG knockdown was therefore initiated at 4 d, before the peak of MBP transcription. TOG or control shRNA was injected in oligodendrocytes, and the cells were returned to the culture incubator for an additional period of time. MBP was not immunodetected in any oligodendrocytes treated for 24 h (data not shown) and 48 h with TOG shRNA PCR product. A typical oligodendrocyte treated for 48 h is shown in Figure 4B (arrow). The cell, which has been injected with TOG shRNA PCR product as seen by the presence of dextran (red), shows no detectable MBP (green). However, control shRNA-injected (Fig. 4A, arrow) and noninjected oligodendrocytes (Fig. 4A,B, top right corner) show high levels of MBP mainly in the peripheral membranous compartment.

Developmental appearance of MBP and MOG in cultured oligodendrocytes. Oligodendrocytes isolated from mixed cultures of rat brain cells were grown and analyzed for the presence of MBP transcripts by FISH (anti-digoxin) (A–D) and immunostained for MBP (anti-MBP) (E–H) at 4, 5, 6, and 7 d in culture (DIC). Homogenates of the same cultures were processed for Western blot to detect the presence of MBP, MOG, and actin (I).

MBP expression is reduced in TOG shRNA-treated oligodendrocytes. Oligodendrocytes were microinjected (cells marked by arrows) with a mixture of control shRNA and Alexa Fluor 546-conjugated dextran (red) (A, C, E) or with TOG shRNA and Alexa Fluor 546-conjugated dextran (red) (B, D, F), grown, and fixed according to the schedule depicted on the left. Open arrows mark the initiation of treatment; filled arrows mark the end of treatment (formaldehyde fixation). A, B, Immunostaining with anti-MBP (green); C, D, immunostaining with anti-MOG (green); E, F, immunostaining with anti-PLP (green). Scale bar, 30 μm.
To verify that TOG shRNA treatment was not generally blocking the differentiation of oligodendrocytes, the expression of MOG, which parallels that of MBP (Fig. 3I), was examined. MOG (green) showed the same distribution and the same fluorescence intensity in both TOG shRNA and control shRNA-treated cells (63 and 58 ± 21 intensity unit per cell, respectively) (Fig. 4C,D, identified by the presence of red dextran and marked by arrows).
In homozygous shiverer mice that are MBP-null mutants (Sorg et al., 1986), PLP expression is reduced. To further characterize the TOG knockdown phenotype, PLP levels were analyzed in 6-d-old oligodendrocytes treated at 4 d with TOG shRNA. TOG knockdown oligodendrocytes (Fig. 4F, marked by arrow) showed a decrease in PLP expression (62 ± 30%) compared with control shRNA-treated cells (Fig. 4E). Furthermore, whereas 61 ± 10% of oligodendrocytes microinjected with control shRNA immunostained for PLP, only 18 ± 5% of oligodendrocytes treated with TOG shRNA immunostained for PLP.
TOG knockdown does not inhibit hnRNP A2–MBP mRNA granule formation or transport to the oligodendrocyte processes
To delineate the step(s) in the RNA trafficking pathway in which TOG is required for MBP expression, immunostaining and in situ hybridization techniques were used to detect the presence of RNA granules and MBP transcripts. TOG shRNA was injected into 4-d-old oligodendrocytes, a developmental stage at which few MBP transcripts are detectable (Zeller et al., 1985) (Fig. 3A). After 24 h, when MBP transcripts normally start to accumulate in cultured oligodendrocytes, cells were fixed and immunostained with anti-hnRNP A2 antibodies, a component of the RNA transport granules. TOG shRNA-treated cells (Fig. 5B) contained a number of hnRNP A2-positive granules similar to untreated cells (Fig. 5A) (268 ± 77 vs 270 ± 67 granules per cell), and their distribution in the cellular processes was comparable. These results indicate that early and intermediate steps in RNA trafficking, namely granule assembly and transport, proceeded normally in oligodendrocytes containing little or no TOG.

Distribution of cytoplasmic hnRNP A2 and MBP transcripts is unaffected in TOG shRNA-treated oligodendrocytes. A, B, Immunodetection of hnRNP A2 in 6-d-old control (A) and 6-d-old TOG shRNA-treated (B) oligodendrocytes. C–F, Detection of MBP transcripts by FISH in 4- and 6-d-old control oligodendrocytes (C, D, respectively) and in 6-d-old oligodendrocytes that were TOG shRNA treated at 4 d in culture (F, arrows), and indicated by the presence of Alexa Fluor 546-conjugated dextran (E, arrows). Noninjected cells are marked by arrowheads in F. Scale bar, 30 μm.
Despite the presence of granules that contain hnRNP A2 in TOG knockdown oligodendrocytes, the lack of MBP could be the result of decreased transcription of MBP or the failure of MBP transcripts to assemble in hnRNP A2 transport granules. To approach this question, fluorescence in situ hybridization (FISH) was performed to detect the presence and distribution of MBP transcripts. Four-day-old oligodendrocytes were injected with TOG shRNA and cultured for an additional 2 d, during which the peak of MBP transcription normally occurs. On the sixth day in culture, the cells were fixed and processed for FISH. Four- and 6-d-old untreated oligodendrocytes from the same culture sets were processed in parallel to TOG shRNA-treated cells to examine the level and distribution of MBP mRNA at the initiation and end of treatment.
Four-day-old untreated oligodendrocytes (Fig. 5C) had little to no MBP mRNA as shown previously. Six-day-old TOG shRNA-treated oligodendrocytes (Fig. 5E,F) had a number of MBP mRNA containing granules similar to 6-d-old untreated oligodendrocytes (Fig. 5D), and the average fluorescence intensity of granules was also similar (73 ± 16 vs 83 ± 7 intensity unit per granule). These parameters were not significantly different from those of untreated oligodendrocytes neighboring TOG shRNA-treated cells on the same coverslip (Fig. 5F, arrowheads). Furthermore, in TOG shRNA-treated oligodendrocytes (Fig. 5E,F, marked by arrows), MBP mRNA had been transported down the processes to an extent comparable with that of control. These data suggested that failure to accumulate MBP was attributable to impairment in a late step in RNA trafficking, possibly translation, and not a result of improper granule formation or transport.
TOG knockdown reduces the expression of chimeric GFP–MBP
The role of TOG in the translation of MBP mRNA was assayed by monitoring the expression of a GFP–MBP construct in control shRNA- and TOG shRNA-treated cells. The construct contains GFP ORF in frame with MBP ORF and full-length 3′ UTR under the control of the cytomegalovirus promoter. These experiments were performed in rat B104 neuroblastoma cells, a nervous system-derived cell line in which transport and translation of MBP mRNA would not be saturated because it does not express endogenous MBP.
B104 neuroblastoma cells were microinjected with control shRNA (Fig. 6A,C,E) or TOG shRNA (Fig. 6B,D,F). The position of the injected cells on the gridded coverslip was recorded. Twenty-four hours later, the same cells were microinjected with the GFP–MBP construct mixed with Alexa Fluor 546-conjugated dextran. The latter is an indicator of the microinjected volume and, by extension, of the amount of DNA injected. Cells were incubated for 24 h to permit transcription and translation of the GFP–MBP construct, fixed, and immunostained with TOG antibodies to determine the level of TOG protein. Cells were examined by fluorescence microscopy, and representatives of both treatments are shown in Figure 6. Cells treated with control shRNA expressed TOG (Fig. 6C). The same cells injected with GFP–MBP cDNA and identified by the presence of dextran (Fig. 6A, arrows) accumulated GFP–MBP (Fig. 6E). Cells treated with TOG shRNA showed a reduced amount of TOG (Fig. 6D, arrows). The same cells injected with GFP–MBP cDNA and identified by the presence of dextran (Fig. 6B, arrows) did not accumulate detectable amounts of GFP–MBP (Fig. 6F). Using the microscopic images, the efficiency of transcription and translation was assessed by comparing the fluorescence intensity of GFP with that of dextran, which reflects the amount of DNA injected. Quantitative analysis of fluorescence intensity yielded a ratio of GFP–MBP to dextran–DNA of 0.25, indicating that, in the absence of TOG, GFP–MBP was not expressed or expressed at very low levels. In contrast, GFP–MBP was well expressed in control shRNA-injected cells. These cells showed a ratio of GFP–MBP to dextran–DNA of 1.3, which was significantly different from TOG shRNA-injected cells (p = 0.05).

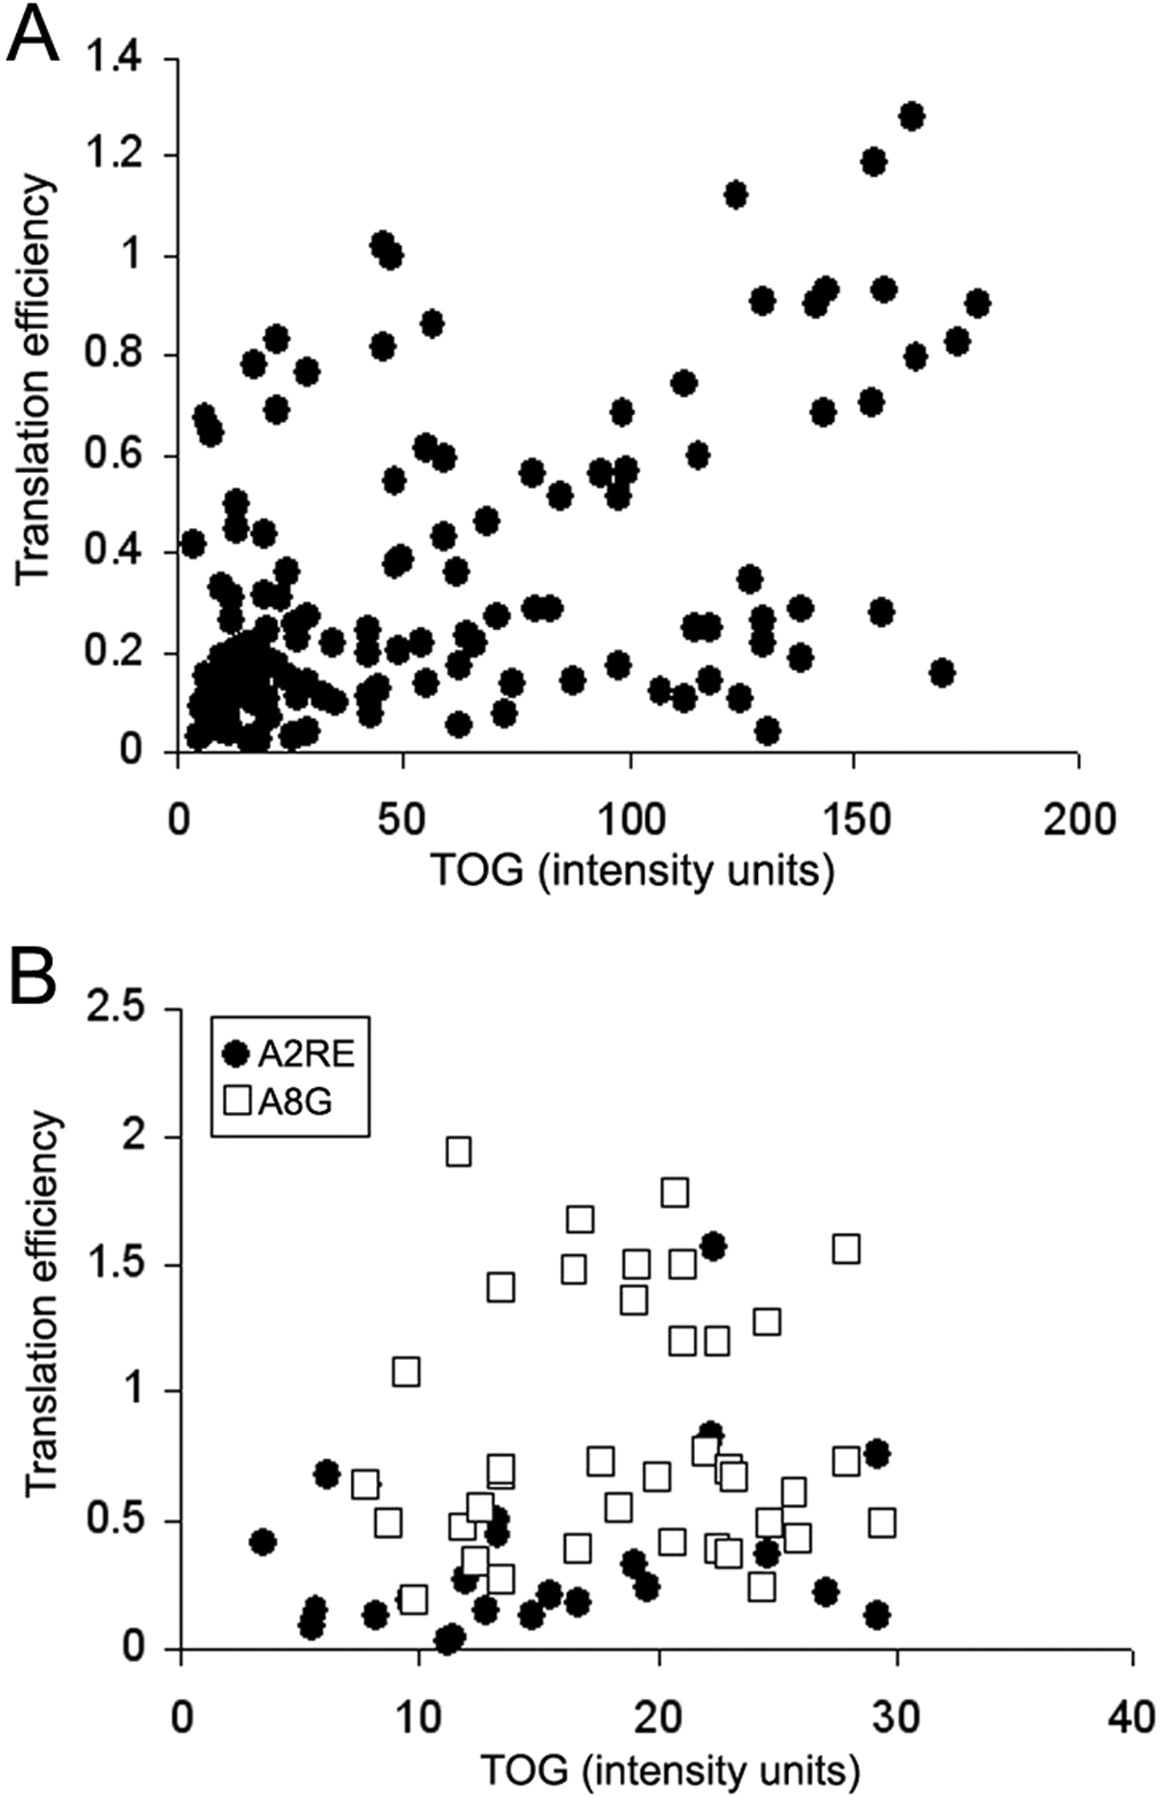
Translation of exogenous GFP–MBP is reduced in TOG shRNA-treated B104 neuroblastoma cells. B104 neuroblastoma cells were injected first with control shRNA (A, C, E) or TOG shRNA (B, D, F) and, 24 h later, with GFP–MBP cDNA mixed with Alexa Fluor 546-conjugated dextran (A, B). Twenty-four hours after the second injection, cells were fixed and immunostained for TOG (C, D). GFP–MBP protein (E, F). A, C, and E are the same field; B, D, and F are the same field. Cells injected with control shRNA and GFP–MBP cDNA mixed with dextran or TOG shRNA and GFP–MBP cDNA mixed with dextran are marked by an arrow in A, B, C and in B, D, F, respectively. The ratio of the fluorescence intensity of GFP–MBP to dextran (translational efficiency) for individual cell is plotted as a function of TOG fluorescence intensity in the same cell (G). Each symbol represents one cell. Cells treated with TOG shRNA, TOG shRNAmir, control shRNA, and no shRNA are represented by filled squares, filled circles, open squares, and open circles, respectively.
To confirm that the effect was attributable to the absence/reduction of TOG and not to that of other possibly sequence-related mRNAs and their cognate proteins, the same experiments were conducted using shRNA to a different sequence in TOG (Fig. 1A, top) (TOG shRNAmir; Open Biosystems) with similar results. One set of each type of experiments using TOG shRNA designed in our laboratory (filled squares) or TOG shRNAmir obtained commercially (filled circles) is illustrated in Figure 6G. The translation efficiency, the amount of GFP produced per amount of DNA injected (GFP fluorescence intensity over dextran fluorescence intensity) in individual cells, is plotted as a function of the corresponding amount of TOG (immunofluorescence intensity). Each point represents the values of one cell. Cells treated with TOG shRNA and TOG shRNAmir are shown as filled squares and circles, respectively; cells treated with control shRNA are shown as open squares or, if treated with the same mix lacking shRNA, as open circles. Most cells treated with TOG shRNA (filled squares and circles) show low amounts of TOG, whereas most control treated cells (open squares) or untreated cells (open circles) show higher amounts of TOG, and translation efficiency generally increases with the amount of TOG present. These data suggest that translation of MBP mRNA is dependent on the presence of TOG.
TOG knockdown reduces translation of GFP–A2RE mRNA but not that of GFP mRNA containing a mutated A2RE sequence
Because low levels of GFP–MBP may have been attributable to decreased transcription in TOG shRNA-treated cells, translation efficiency was addressed more directly by injecting mRNA in control and TOG shRNA-treated cells. B104 neuroblastoma cells were microinjected with control shRNA or TOG shRNA, and their position on the gridded coverslip was recorded. Twenty-four hours later, the same cells were microinjected with GFP–A2RE mRNA mixed with Alexa Fluor 546-conjugated dextran. GFP–A2RE mRNA contains the ORF of GFP and the A2RE sequence of MBP mRNA (Ainger et al., 1997) in its 3′ UTR. Cells were incubated for 24 h to allow translation of the microinjected mRNA, fixed, and immunostained with TOG antibodies. The relative amounts of GFP produced and mRNA injected were assessed by measuring cytoplasmic GFP and dextran fluorescence intensity, respectively. The ratio of these two values represents translation efficiency. A typical experiment in which 125 cells were analyzed is shown in Figure 7A. Translation efficiency of GFP–A2RE mRNA decreased with decreasing amounts of TOG. Of the 59 cells that had <40 TOG fluorescence intensity units, 42 had a translation efficiency coefficient of <0.25. Data obtained from five experiments in which >300 cells were analyzed showed that translation efficiency in cells that contained low levels of TOG (between 0 and 40 intensity units) was half that of cells that contained higher levels of TOG (between 41 and 200 intensity units), a significant difference (p = 0.001). In contrast, the translation efficiency of GFP–A8G mRNA that has a sequence identical to GFP–A2RE except for the point mutation A to G at position 8 of the A2RE element was similar at high and low levels of TOG (85 cells analyzed in four experiments; p = 0.001). The A to G mutation has been shown to abolish binding of hnRNP A2 (Munro et al., 1999). A representative experiment focusing on the translation efficiency of GFP–A2RE and GFP–A8G mRNAs in cells with low levels of TOG (<30 intensity units) is shown in Figure 7B. Each symbol represents the values of one cell. Translation efficiency of GFP–A2RE mRNA (filled circles) was half that of GFP–A8G mRNA (open squares), indicating that TOG modulates translation. The result also suggests that the effect of TOG on translation involves the formation of a complex with hnRNP A2 in association with mRNA.

Translation of a mutated A2RE-containing mRNA is not affected by TOG shRNA. A, B104 cells were injected first with control shRNA or with TOG shRNA to knock down TOG expression and, 24 h later, with MBP mRNA mixed with Alexa Fluor 546-conjugated dextran. Twenty-four hours after the second injection, cells were fixed and immunostained for TOG. Images were collected simultaneously in three channels and the fluorescence intensity of dextran, GFP–MBP, and TOG measured in each cell. Translation efficiency, Ratio of GFP–MBP fluorescence intensity over that of dextran fluorescence intensity. Each filled circle represents the values of one cell. B, B104 cells were injected first with TOG shRNA to knockdown TOG expression and, 24 h later, with Alexa Fluor 546-conjugated dextran mixed with A2RE–GFP mRNA or A8G–MBP mRNA. Cells were then processed and analyzed as in A. Filled circles, A2RE–GFP mRNA-injected cells; open squares, A8G–GFP mRNA-injected cells.
Discussion
Trafficking mRNAs to specialized subcellular compartments for local translation involves the recognition of mRNAs by RNA binding proteins, their assembly into RNA–protein complexes (granules), and their transport to the target locale using cytoskeletal and motor proteins. Because MBP mRNA granule transport is microtubule dependent, we anticipated TOG, a microtubule-associated protein, to modulate this step in MBP gene expression. However, the key feature of TOG knockdown in oligodendrocytes, the drastic reduction in MBP immunostaining in the presence of properly localized MBP transcripts, suggests that TOG has a critical role in MBP mRNA translation.
TOG knockdown oligodendrocytes contained numerous MBP mRNA-positive granules distributed along the processes and to their ends, indicating that granule formation and transport proceeded normally. TOG knockdown did not affect the overall program of oligodendrocyte differentiation. Indeed, MOG, a protein expressed in the late stage of differentiation (Crang et al., 2004), was present at normal levels and correctly distributed in TOG knockdown cells. PLP, another differentiated oligodendrocyte product was reduced in TOG-depleted cells, but this effect could be secondary to the loss of MBP. Mice homozygous for the shiverer mutation are effectively MBP-null mutants and also show a severe reduction in PLP expression (Sorg et al., 1986).
The role of TOG as a translational regulator may depend on its ability to facilitate protein–protein interactions. MBP mRNA contains at least two sequences within its 3′ UTR, A2RE and CPE, which along with their binding proteins can regulate translation (Du and Richter, 2006). A2RE binds hnRNP A2, which in turn binds to TOG and to hnRNP E1, a known translation regulatory protein (Ostareck et al., 1997) that suppresses A2RE mRNA translation in neural cells (Kosturko et al., 2006). CPE binds CPEB. In Xenopus, CPEB binds maskin, which in turn binds XMAP215, the homolog of TOG; TACC, the maskin homolog, also binds TOG (Conte et al., 2003; O'Brien et al., 2005); it is not clear, however, that TACC is functionally similar to maskin with regard to translation. The CPEB–maskin complex is known to inhibit translation of CPE-containing mRNAs in neurons (Huang and Richter, 2004). It is therefore possible that TOG is necessary to derepress the translation of MBP mRNA by binding to hnRNP A2, to maskin/TACC, or to both.
The mechanism by which TOG performs this function is unknown. Plus-end microtubule-associated proteins, such as members of the TOG family, have been implicated in linking microtubule ends to various cellular structures (Akhmanova and Hoogenraad, 2005). CLIP-associated protein 2 that associates with the distal ends of microtubules contains a TOG domain that possesses actin-binding activity (Tsvetkov et al., 2007). The absence of TOG may result in the failure to anchor mRNA granules to microfilaments at translation competent sites. Specialized translation sites have been observed in neuronal dendrites (Smart et al., 2003) and could be present in oligodendrocytes, but the fact that translation of GFP–MBP mRNA is also affected in B104 cells under nondifferentiating conditions makes this possibility unlikely.
Another mechanism by which translation of specific messages is reduced is through the phosphorylation of the elongation factor eEF-2 (Duncan et al., 1987; Proud, 2000; Yan et al., 2003; Sans et al., 2004). In neurons, eEF-2 is regulated in an activity-dependent manner, which suggests that it can be regulated locally in dendrites (Marin et al., 1997; Scheetz et al., 2000). Translational differences between mRNAs after or accompanying eEF-2 phosphorylation have also been demonstrated in neurons (Scheetz et al., 2000). In oligodendrocytes, eEF-2 is present in the cellular processes, localized to and copurifying with CNS myelin (Taylor et al., 2004). eEF-2 is phosphorylated by a specific kinase, eEF2K, the activity of which has been shown to be modulated by a variety of protein kinases (Browne and Proud, 2002; Browne et al., 2004). eEF-2 can be dephosphorylated by the protein phosphatase 2A (PP2A) (Redpath and Proud, 1990). TOG could influence eEF-2 dephosphorylation through its interaction with hnRNP A2 because the latter is a PP2A inhibitor (Vera et al., 2006). In TOG knockdown, hnRNP A2, associated with MBP mRNA, may become available to bind PP2A and inhibit its activity, therefore keeping eEF-2 in its phosphorylated and translation-inactive form. This possible mechanism would account for our finding that translation of GFP–A8G mRNA, which does not bind hnRNP A2, is not affected by the level of TOG.
The level of TOG necessary to sustain MBP mRNA translation has not been determined. There is currently no TOG knock-out mouse reported in the literature, and a complete TOG knock-out would most likely be lethal because of the essential role of TOG in the organization of spindle pole (Gergely et al., 2003). A TOG conditional knock-out would be valuable in deciphering the role of TOG throughout the processes of oligodendrocyte differentiation and myelin formation. Knocking out TOG in oligodendrocyte progenitors might prevent cell migration and process elongation, whereas knocking out TOG after oligodendrocytes have developed multiple processes might lead to a shiverer phenotype. Granule transport that necessitates microtubules may be impaired because TOG affects microtubule dynamics, and accumulation of MBP transcripts in the cell body may be deleterious to the cell (Tournebize et al., 2000). Even if granule transport were not to be affected, MBP mRNA translation would be inhibited as described in this study.
In summary, our data indicate that TOG is necessary for the expression of MBP in oligodendrocytes and suggest that it does so by promoting MBP mRNA translation. This is accomplished by an unknown mechanism but one that likely depends on TOG having multiple protein–protein interactions, including its interaction with hnRNP A2. It is interesting to speculate that other neural mRNAs may be regulated in a manner similar to MBP mRNA. For example, calcium/calmodulin-dependent kinase II, which is necessary for long-term potentiation (Lisman et al., 2002) and whose translation is locally controlled in dendrites, contains both CPE and A2RE sequences. Because MBP is essential for myelin formation in the CNS, it is important to unravel the mechanisms regulating its expression during development to address myelin defects as early as possible and, also in adulthood, during aging and in pathological conditions to maintain myelin and/or to promote remyelination.
Footnotes
-
This work was supported in part by National Institutes of Health Grant NS29943 and National Multiple Sclerosis Society Grant RG2843 (E.B.). We thank Dr. C. B. Marta [Department Neuroscience, University of Connecticut Health Center (UCHC)] for reagents and helpful discussion, V. Tatavarty (Biomedical Sciences Graduate Program, UCHC) for technical assistance, and Dr. J. H. Carson (Department of Molecular, Microbial, and Structural Biology, UCHC) for discussion and comments on this manuscript.
- Correspondence should be addressed to Elisa Barbarese, Department of Neuroscience, University of Connecticut Health Center, 263 Farmington Avenue, Farmington, CT 06030-3401.barbarese{at}nso2.uchc.edu


