

Abstract
Visual grouping through the binding of multiple discrete elements is an important component of object perception, and neurological studies have shown that the posterior parietal cortex plays a vital role in that process. To study the neural mechanisms underlying visual grouping, we recorded neuronal activity from the lateral bank of the intraparietal sulcus (L-IPS) of monkeys while they performed a task that required them to discriminate among rapidly presented visual patterns composed of five black or white dots arranged in a cross. The monkeys had to detect the patterns in which dots with the same contrast were arranged either horizontally or vertically (target). Visual grouping was necessary for detection of the target, and we surmised that if L-IPS neurons are involved in visual grouping, they may selectively respond to the grouped objects. In addition, we manipulated the monkeys' attention to the grouping of the elements. We found that many L-IPS neurons showed selectivity for the orientation of the target stimuli, and that selectivity was enhanced by the top-down attention. Moreover, the selectivity correlated with behavioral performance. These results provide the first physiological evidence that L-IPS neurons make a crucial contribution to visual grouping by combining visual and attentional signals so as to bind discrete visual elements together.
Introduction
Visual grouping is an essential component of the visual perception of objects. It is the process by which multiple discrete elements are bound into a single object, and has been extensively studied by Gestalt psychologists. It is known, for example, that image elements are grouped together based on bottom-up factors such as similarity and continuity, but that visual grouping is also affected by top-down factors such as prior knowledge and past experience with the objects (Wertheimer, 1950; Palmer, 1999).
Neurological studies of human patients suggest that the posterior parietal cortex plays a key role in visual grouping. For instance, patients with Balint's syndrome, who have bilateral damage to the parietal cortex, cannot perceive a visual scene as a whole; instead, they see only one of the multiple objects in a visual scene at a time. It has therefore been suggested that the posterior parietal cortex is involved in the integration of multiple objects and features and in global gestalt perception. (Warrington and James, 1967; Coslett and Saffran, 1991; Friedman-Hill et al., 1995; Himmelbach et al., 2009). It has also been reported that patients with unilateral damage to the parietal cortex have an impaired ability to allocate attention to promote visual grouping (Robertson et al., 1988), which suggests that the parietal cortex is also involved in visual grouping controlled by top-down attention. Many studies have shown that neurons in the lateral bank of the intraparietal sulcus (L-IPS) are involved in spatial attention or selection and control of visually guided eye/hand movements (Gnadt and Andersen, 1988; Taira et al., 1990; Barash et al., 1991; Colby et al., 1996; Snyder et al., 2000; Shadlen and Newsome, 2001; Bisley and Goldberg, 2003, 2006). However, there have been no studies examining the involvement of parietal neurons in visual grouping.
To investigate the neuronal mechanisms underlying visual grouping, we designed a grouping detection task controlled by top-down attention, and then recorded neuronal activity from the L-IPS while the task was being performed by monkeys. The visual stimuli consisted of multiple discrete dots, and the monkeys were required to detect the target defined by specific arrangements of the dots. Visual grouping was necessary for detection of the target, and we surmised that if L-IPS neurons are involved in visual grouping, they may selectively respond to the grouped objects. In addition, we manipulated the monkeys' attention to the grouping of the elements, and examined the effect of attention on the neuronal responses. Our results provide the first physiological evidence that L-IPS neurons make an important contribution to visual grouping by combining visual and attentional signals to bind discrete visual elements.
Materials and Methods
Visual stimuli and behavioral task.
Two monkeys (Macaca fuscata, male, weighing 6.9–8.8 kg) were used for these experiments. During the experiments, the monkeys sat in a primate chair and faced the screen of a CRT monitor. To examine the neural mechanisms underlying visual grouping affected by top-down attention, we designed a grouping detection task. The visual stimuli are shown in Fig. 1A. They were composed of 5 square black or white dots (1.2° at the edge) arranged in a cross on a gray background. The spatial interval between the centers of neighboring dots was 2.4°, and the black and white dots (1.33 cd/m2 and 75 cd/m2 respectively, x = 0.313, y = 0.329) had the same luminance contrast against the gray background (10 cd/m2, x = 0.313, y = 0.329). Each visual stimulus contained either three white dots and two black dots or three black dots and two white dots. A total of 20 types of visual stimuli composed of different arrangements of dots were prepared and used in the behavioral task. In four of the 20 stimuli, three dots with the same contrast (either black or white) were aligned either horizontally or vertically and served as the target (Fig. 1A, top). The target stimuli were characterized by two visual features: the orientation of the three dots with the same contrast that was either horizontal or vertical (Fig. 1A, top, columns) and the contrast of three-aligned dots, which was either white or black (Fig. 1A, top, rows). In the following text, we will refer to each target according to the combination of these two features (e.g., white-horizontal for the left-top target in Fig. 1A). The remaining 16 stimuli, four of which are shown in Fig. 1A (bottom), were non-targets. The other 12 non-targets had the same pattern but different orientations separated by 90° each. The center position of the visual stimuli was 7.1° in eccentricity, and the polar angle was 22.5, 45.0, 157.5, 202.5, 225.0, 315.0, or 337.5° for monkey GG, or 337.5° for monkey FZ. In the early part of the experiment in GG, we also used three additional polar angles in a small number of neurons (328.3° in 7 neurons, 350.3° in 1 neuron, 9.7° in 1 neuron).

Visual stimuli and sequence of the grouping detection task. A, Twenty types of visual stimuli (four targets and 16 non-targets) were used. Each was composed of five square black or white dots arranged in a cross. Target stimuli were arranged so that dots with the same contrast were aligned horizontally or vertically (top panel), and were characterized by two features: orientation and contrast. Other arrangements were used as nontarget stimuli, four of which are shown in the bottom panel. Note that the contour line of the dot is for illustration purposes only and was not present in the actual stimulus in the experiment. B, Time course of a trial. During a trial, while the monkey maintained fixation, visual stimuli were presented serially up to 3 (or 4) times within the receptive field (RF). The monkey was required to quickly release the lever when the target was presented. FX is the fixation spot. C, Relationship matrix between the target orientation and the attended orientation. In the valid condition, the target orientation matched the attended orientation. In the invalid condition, the target orientation was orthogonal to the attended orientation.
Figure 1B shows the time course of the behavioral task. In a trial, visual stimuli were presented multiple times interleaved with interstimulus intervals (ISIs). The monkeys made behavioral response via a lever. A trial started when a monkey pressed the lever, and a white fixation spot appeared at the center of the display. During the trial, the monkey was required to fixate on the spot and to maintain its eye position within a square fixation window. The size of the fixation window was 1.3–2.0° (mainly 1.3°) at the edge for monkey GG and 1.6–2.0° (mainly 1.6°) for monkey FZ. After 800 ms from the beginning of fixation, a visual stimulus was presented for 300 ms and then disappeared. This was followed by an ISI and then presentation of another visual stimulus. The ISI was 300 ms for monkey GG and 340 ms for monkey FZ. Visual stimuli were presented up to 4 times in one trial for monkey GG and 3 times for monkey FZ. A target was presented within a trial in 80% of the trials for monkey GG and 75% of the trials for monkey FZ. In the remaining 20% (or 25%) of the trials, a target was not presented. The target appeared only once or did not appear at all within a trial. The probability that the target would appear in each step of the stimulus presentation was the same (0.2/step for monkey GG, 0.25/step for monkey FZ). The monkeys had to release the lever within 600 ms after the onset of the target to obtain a liquid reward. In a trial in which no target was presented, the monkeys had to keep pressing the lever until the fixation spot disappeared to obtain a reward. If a monkey broke fixation or if it released the lever even though a target did not appear, the fixation spot was turned off and an ITI began.
To detect the appearance of a target during a rapid sequence of stimuli, the monkeys were required to quickly discriminate the arrangement of dots. It is known that multiple elements of common contrast or multiple elements positioned in a row tend to be perceived as one object. Accordingly, the elements of a target are readily grouped in a bottom-up manner. On the other hand, it is also known that top-down attention affects visual grouping. In our task, if the monkeys knew the orientation (horizontal/vertical) or the contrast (white/black) of the forthcoming target in advance, we would expect that top-down attention would facilitate visual grouping of the dots. Therefore, to promote visual grouping by top-down attention in the present experiment, we included a predictable bias in the target orientation. Figure 1C shows a matrix indicating the relationship between the target orientation and the attended orientation. When the attended orientation is the same as the target orientation (valid condition), we would expect top-down attention to facilitate visual grouping. When the attended orientation differs from the target orientation (invalid condition), no such facilitation would be expected. It should be noted that monkeys can obtain a reward by detecting any target under either condition, regardless of whether the target has an attended or unattended orientation.
For monkey GG, attention was controlled by a visual cue: two short horizontal or vertical bars positioned symmetrically on opposite sides the fixation point. Horizontal cues were presented to the left and right of the fixation point, and vertical cues below and above the fixation point. Each bar was situated 1.0° at the near end from the fixation spot and had a length of 0.5° and a width of 0.1°. The orientation of the visual cue instructed the orientation to which attention should be directed. The proportion of trials in the valid condition was 80% for recordings from the left hemisphere and 90% for the right hemisphere. The remaining 20% or 10% of trials were in the invalid condition. The visual cue appeared 100 ms after the beginning of fixation and was presented throughout a trial. The orientation of the visual cue changed randomly from trial to trial. The presence of bars on opposite sides of the fixation point prevented the eye position from shifting toward a bar: deviation of the eye position during the trials were very small compared with the separation (1.0°) between the fixation spot and the end of the bar (mean ± SD: 0.02 ± 0.14° for the horizontal cue and 0.05 ± 0.12° for the vertical cue).
For monkey FZ, attention was controlled using a block design. Within a block of ∼100 trials, a target with a particular orientation (horizontal or vertical) was presented in 90% of the trials (valid condition), and a target with the orthogonal orientation was presented in the remaining 10% (invalid condition). The attended orientation alternated between horizontal and vertical in serial blocks. To signal the new orientation at the beginning of a new block, only trials in the valid condition were run for ∼20 trials. Because the monkey's attention was not stable during this period, the data obtained in these trials was excluded from the analysis.
Monkeys were also trained on a passive fixation task in which they only needed to maintain gaze on the fixation spot to get a reward.
Surgical procedures and recording.
An eye coil and a head holder were implanted under sodium pentobarbital anesthesia using standard sterile surgical procedures. After training on the behavioral task, a recording chamber was implanted on the skull. The recording chamber was placed at a position where we could horizontally insert electrodes into the L-IPS, the position of which was determined by magnetic resonance imaging (MRI) before the surgery. We targeted the L-IPS between the A3 and P3 stereotaxic coordinates. After surgery, antibiotics (Cefazolin, 0.06 g) were intramuscularly administered twice daily for 7 d to prevent infection. Monkeys were allowed to recover for >7 d after surgery; experiments were begun only after the monkeys have completely recovered. All procedures for animal care and experimentation were in accordance with the National Institutes of Health Guide for the Care and Use of Laboratory Animals (1996) and were approved by our institutional animal experimentation committee.
Custom-written software running on three PC computers were used to control the presentation of the stimuli and the task schedule, and to record neural signals and eye positions. Visual stimuli were presented on a CRT monitor (frame rate at 100 Hz, Totoku Electric) situated at a distance of 57 cm from the monkey. Eye position was monitored using the scleral search coil technique (Robinson, 1963; Judge et al., 1980). We used tungsten microelectrodes (200 μm in diameter, 1–2.5 MΩ at 1 kHz, Frederick Haer) that were inserted into the cortex using a hydraulic microdrive (MO-951, Narishige). Neural signals were amplified using a head amplifier and main amplifier (Nihon Kohden) and then sent to a PC. Neural signals and eye position were recorded on the PC's hard disk at sampling rates of 25 kHz and 1 kHz, respectively, for off-line analysis. The occurrence of spikes was monitored on-line and peristimulus time histograms (PSTHs) were generated during the recordings, which enabled us to evaluate the response properties of the recorded neuron. After recording, we confirmed the spike activity to be a single neuron using a template-matching method, and then conducted off-line analysis using MATLAB (The MathWorks).
We recorded 107 single neurons from L-IPS (GG 82, FZ 25). We approximately examined the receptive field in 72 of these neurons (GG 59, FZ 13) by presenting a square spot (1–2° in size) at various positions in the visual field during a passive fixation task. Monkey GG was trained the grouping detection task at seven different positions in the visual field, and we aimed to determine the position to present the stimuli in the grouping detection task based on this receptive field mapping. For the remaining neurons, we did not test the receptive field and determined the target position based on the records from the nearby sites. For monkey FZ that was trained to perform the grouping detection task only at one position, we confirmed that the receptive field overlapped with the target position (n = 13). For the remaining neurons, we confirmed that the visual response is evoked at the target position by presenting a visual stimulus (n = 9). We found that neurons recorded in more posterior part tended to have receptive fields in the upper visual field, which is consistent with an earlier report (Ben Hamed et al., 2001). However, in either monkey, we did not attempt to scrutinize the boundary of the receptive field.
Data analysis.
The minimum number of repetitions of each stimulus accepted for analysis was five. Typically, more than seven repetitions of each stimulus condition were carried out for each neuron. Firing rates were computed within the period between 50 and 250 ms after stimulus onset. This timing corresponded approximately to the minimum latency of the light-sensitive LIP neurons (Barash et al., 1991; Bisley et al., 2004) and the minimum reaction time, respectively. Monkeys released the lever earlier than the latter timing in only a very small number of trials (0.29% for monkey GG, 0.35% for monkey FZ). Only neurons that showed a significant increase in activity to at least one target stimulus (p < 0.05, t test) were used for analysis. Although a comparison between correct and error trials would be of interest, the number of error trials for each stimulus was too small to allow systematic analysis. Therefore, we analyzed only data obtained in correct trials.
The response selectivity of each neuron was evaluated statistically using three-factor ANOVA with target orientation (horizontal or vertical), target contrast (white or black) and attended orientation (horizontal or vertical) as the main factors. Before the ANOVA, we applied a square-root transformation to transform the distribution of firing rates into a normal distribution.
We performed a rank analysis to determine how the responses to targets differ from those to non-targets. There were 40 stimulus conditions (i.e., 20 types of stimulus presented in 2 attended orientations). These stimulus conditions were ranked according to the order of the response magnitudes. The stimulus condition ranked first was the stimulus condition in which the strongest response was evoked among the 40 stimulus conditions.
There were 4 targets made of a combination of two target orientations (horizontal or vertical) and two target contrasts (white or black). To determine whether these features were expressed in the neural activity, we quantified the magnitude of selectivity using the following equations. First, we computed the difference in responses between different target orientations (DBO) and the difference in responses between different target contrasts (DBC) as follows: DBO = | (WHt + BHt) − (WVt + BVt) |/2, DBC = | (WHt + WVt) − (BHt + BVt) |/2, where WHt, BHt, WVt, and BVt, respectively, represent the response to the target in which white dots are aligned horizontally, black dots are aligned horizontally, white dots are aligned vertically, and black dots are aligned vertically. DBO and DBC were calculated in each attention condition separately.
Next, we quantified the selectivity of each neuron for the target orientation and the target contrast by normalizing the response difference between relevant features to the sum of the responses to all features as follows: Orientation selectivity index = | (WHt + BHt) − (WVt + BVt) |/(WHt + BHt + WVt + BVt), Contrast selectivity index = | (WHt + WVt) − (BHt + BVt) |/(WHt + BHt + WVt + BVt). Each selectivity index takes a value between 0 and 1, and a larger value corresponds to stronger selectivity.
Finally, to determine whether the magnitude of selectivity was modulated by attention, we calculated a modulation index as follows:
 where DBOvalid and DBOinvalid indicate the value of DBO in the valid condition and that in the invalid condition, respectively. Modulation indexes ranged between −1 and 1, with a positive value indicating that the selectivity is stronger in the valid condition than in the invalid condition.
Histology.
In one monkey (GG), we confirmed the positions of the recordings histologically. After all the experiments were completed, the monkey was deeply anesthetized with pentobarbital sodium and then transcardially perfused with a 4% paraformaldehyde solution. Serial 50 μm sections were cut in the coronal plane using cryostat (CM3050, Leica, Germany), and every other section was stained with cresyl violet. The brain slices were then examined microscopically, and histologically identified electrode tracks were superimposed on the nearest representative slice at a 1 mm interval. A dense array of electrode tracks were found in the middle portion of the L-IPS (left hemisphere: A0-P4, right hemisphere: A1-P2, supplemental Fig. S1, available at www.jneurosci.org as supplemental material). The other monkey (FZ) is still alive. In this monkey, x-ray images and MRI were used to confirm that the recordings were made from the L-IPS between the A3 and P3 stereotaxic coordinates.
Results
Monkey behavior during a grouping detection task
We recorded 107 single neurons from the L-IPS of two monkeys (82 neurons from monkey GG, 25 neurons from monkey FZ). Figure 2 shows the distribution of reaction times in the valid (red) and invalid (blue) conditions during the period the neural activities were being recorded. Reaction time was defined as the interval between the onset of the target and the lever release. For both monkeys, the reaction time was, on average, significantly shorter in the valid condition than in the invalid condition (monkey GG: median = 328.6 ms vs 349.3 ms, valid vs invalid, n = 24,265 trials, p < 0.001, Mann–Whitney test; monkey FZ: 315.3 ms vs 342.5 ms, n = 8252 trials, p < 0.001). Similarly, the average detection rates across the recording sessions for each neuron were significantly higher in the valid condition than in the invalid condition (monkey GG: 96.9% vs 86.8%, valid vs invalid, n = 76 sessions, p < 0.001, paired t test; monkey FZ: 98.9% vs 91.6%, n = 24 sessions, p < 0.001). The number of sessions differs from the number of neurons because two individual neurons were recorded simultaneously in seven sessions (monkey GG: 6, monkey FZ: 1). Comparison of the reaction times and detection rates showed that behavioral performance was better in the valid condition than in the invalid condition, which confirms that in both monkeys attention was guided to the target orientation instructed by the experimenter.

Distribution of the reaction times in the valid (red) and invalid (blue) conditions. Left and right panels illustrate the results of monkeys GG and FZ, respectively. The triangles indicate the median reaction times.
Comparison of the responses of L-IPS neurons to target and nontarget stimuli
We found neurons in the L-IPS that selectively responded to the visual stimuli during the grouping detection task. Figure 3, A and B, show the responses of a representative neuron as spike density functions. This neuron responded strongly to some of the stimuli but not to others. Given that activity in the posterior parietal cortex is known to be closely related to spatial attention and behavioral selection, one possibility is that the selective responses discriminate between the target and nontarget stimuli. However, the recorded L-IPS neurons did not show selective responses distinguishing target from nontarget stimuli. The neuron whose behavior is summarized in Figure 3, A and B, responded strongly to some targets but not to others. In addition, this neuron showed strong responses to some of the non-targets as well, indicating that it did not discriminate between the target and the non-target.

Responses of an example L-IPS neuron to the target and nontarget stimuli. A, Responses to the target (top row) and nontarget (bottom row) stimuli when the monkey attended to the horizontal orientation. Responses are shown as spike density functions, which were obtained by convolving the spike train (resolution of 1 ms) with a Gaussian kernel (SD = 20 ms). Thick horizontal bars on the bottom indicate the stimulus presentation periods. In this and other panels, red (blue) represents the valid (invalid) condition. B, Responses to visual stimuli when the monkey attended to the vertical orientation. Other explanations are the same as in A. C, Responses to all stimuli in both attention conditions. Each stimulus in each attention condition corresponds to a horizontal bar, and the firing rate elicited by each stimulus is indicated by the height of the bar. In the leftmost column depicts responses to target stimuli in the valid condition (red), the middle column the invalid condition (blue). Dotted lines connect the responses to the same target stimulus. The rightmost column depicts responses to nontarget stimuli. A triangle and broken line represents the average of the responses to nontarget stimuli. D, Ranking of the responses to the target stimuli across the four targets among the 40 stimuli. Red and blue bars indicate the ranks of the responses to the targets illustrated below. Ranks of the responses to the same targets are connected by dashed lines. White bars represent the ranks of non-targets. The stimulus that induced the strongest response is ranked #1 and the weakest #40.
To illustrate this more clearly, the response profile for this neuron is shown in Figure 3C. The responses to all target stimuli in both the valid and invalid conditions, as well as the responses to all nontarget stimuli, are plotted. The mean of the response magnitudes for the four targets in the valid condition did not significantly differ from that for non-targets (mean ± SD: 32.0 ± 20.9 spk/s for targets, 32.2 ± 9.53 spk/s for the non-targets, p = 0.97, t test), which indicates that, on the whole, this neuron did not discriminate target from non-target. Instead, we found that there was an interesting difference between the distributions of the responses to targets and non-targets. The responses to targets in the valid condition were located at the two extremes of the response distribution. In other words, this neuron not only responded most strongly to some targets, it also responded most weakly to other targets. In the invalid condition, the responses to targets were distributed in a smaller range (mean ± SD: 31.8 ± 10.1 spk/s) than in the valid condition.
Figure 3D shows the results of a rank analysis in which all the stimulus conditions were sorted according to the magnitude of the response: rank #1 was the strongest response, while rank #40 was the weakest. The responses to the target stimuli in the valid condition (red bars) were ranked at #1, #4, #35, and #40, and were thus positioned at the two extremes. This tendency was generally observed across the recorded neurons. Figure 4 shows the distribution of ranks for all four target stimuli in the valid (red) and invalid (blue) condition for all 107 neurons recorded. The distribution was clearly skewed toward both the smallest (strongest response) and largest (weakest response) ranks, and significantly deviated from the uniform distribution (gray line). This bias toward the two extremes was apparent both in the valid condition and in the invalid condition.

Distribution of the ranks of the responses to the target stimuli for the population of L-IPS neurons in the valid (red) and invalid (blue) conditions. The rank of the response to each target stimulus was determined among the 40 responses of each neuron to the entire stimulus set. The histogram was then generated by counting the occurrences of each rank across the recorded L-IPS neurons. The height of the bars indicate the number of occurrences of each rank. The stimulus that induced the strongest response is ranked #1. Note that there were four different targets in each attention condition, so each neuron is counted four times to make the histogram. The gray line indicates the number of responses that would be expected if there is no bias in the distribution of the ranks.
The results summarized above suggest the possibility that L-IPS neurons are selective for some of the visual features included in the target stimuli, namely the target contrast or the target orientation (Fig. 1A). In addition, the difference between the valid and invalid conditions observed in Figure 3 suggests that attention to target orientation may affect the neural responses. The results of an ANOVA were consistent with this impression. Ninety-three of the 107 recorded neurons (68 of 82 neurons in monkey GG, 25 of 25 neurons in monkey FZ) showed a significant main effect (p < 0.05) of selectivity for either the target orientation or target contrast. Of those 93 neurons, 81 (87.1%; 58 of 68 neurons in monkey GG and 23 of 25 neurons in monkey FZ) showed a significant main effect of target orientation, 62 (66.7%; 46 of 68 neurons in monkey GG and 16 of 25 neurons in monkey FZ) showed a significant effect of target contrast, and 50 (53.8%; 36 of 68 neurons in monkey GG and 14 of 25 neurons in monkey FZ) showed a significant main effect of both target orientation and target contrast. In 31 neurons (33.3%; 23 of 68 neurons in monkey GG and 8 of 25 neurons in monkey FZ), the attended orientation was a significant main factor. To fully understand how L-IPS neurons responded to target stimuli and how attention affected the responses, we next examined in more detail the selectivity of the recorded L-IPS neurons for the target features and the effect of attention. In the following parts of this paper, we will focus on the population of 93 neurons showing statistically significant selectivity for target orientation or contrast in the aforementioned ANOVA.
Responses to the target stimuli: example neurons
Figure 5 shows the responses of two representative neurons to the target stimuli. In both neurons, target orientation was a significant main factor in the ANOVA. The neuron shown in Figure 5A–C was recorded in monkey GG (the responses of the same neuron are depicted in Fig. 3). As can be seen in Figure 5A, in both the valid (red) and invalid (blue) conditions, this neuron responded strongly to targets in which dots with the same contrast were aligned horizontally (horizontal targets), whereas it responded only weakly to targets in which dots with the same contrast were aligned vertically (vertical targets). This preference did not depend on the contrast, as similar responses were observed whether the aligned dots were black or white. Figure 5B shows the response magnitudes computed during the period from 50 to 250 ms after stimulus onset in each condition. To quantitatively evaluate this neuron's selectivity, we computed the difference in the responses to targets with different orientations (DBO, see Materials and Methods), as well as the difference in the responses to targets with different contrasts (DBC). The left panel in Figure 5C shows the computed DBOs depicted as vertical bars corresponding to the differences between the mean responses to the horizontal targets and those to the vertical targets. The red and blue bars depict the DBOs obtained in the valid and invalid conditions, respectively. The right panel in Figure 5C shows the computed DBCs corresponding to the differences between the mean responses to the white and black targets. The values of DBO and DBC were, respectively, 35.5 and 1.9 spk/s in the valid condition and 13.8 and 9.3 spk/s in the invalid condition. DBO was greater than DBC in both attention conditions, confirming the notion that this neuron was more selective for target orientation than target contrast.

Responses of two representative L-IPS neurons to the target stimuli in the valid (red) and invalid (blue) conditions. A–C show responses of one neuron recorded from monkey GG, and D–F show the responses of a neuron from monkey FZ. A, Spike density functions for the responses to the target stimulus illustrated in each panel. B, Mean firing rate (with SE of mean, SEM) of the response to each target stimulus. C, Selectivity for the target orientation (left) and contrast (right). Each plot illustrates the average responses to the two target stimuli indicated below. The vertical bar on the right of each panel represents the difference between the responses that is dependent on the target orientations (DBO, left panel) and the difference that is dependent on the target contrast (DBC, right panel). D–F, Shown using the same conventions as in A–C.
We next assessed the influence of top-down attention on the magnitude of the selectivity for target orientation and for target contrast. The responses to the horizontal targets were stronger in the valid condition than in the invalid condition and, conversely, the responses to the vertical target were stronger in the invalid condition than in the valid condition. As a result, DBO was greater in the valid condition than in the invalid condition (vertical bars on the left panel of Fig. 5C). This suggests that the selectivity for the target orientation was enhanced when the target orientation was the same as the attended orientation.
The neuron shown in Figure 5D–F was recorded from monkey FZ. This neuron responded more strongly to the vertical target than to the horizontal target in both attention conditions, and selective responses were not dependent on the target contrast (Fig. 5D,E). The values of DBO and DBC were, respectively, 14.3 and 2.2 spk/s in the valid condition and 6.1 and 0.6 spk/s in the invalid condition (Fig. 5F). Thus, DBO was greater than DBC in both attention conditions, which indicates this neuron was also more selective for target orientation than target contrast. In addition, DBO was greater in the valid condition than in the invalid condition, indicating that attention enhanced the orientation selectivity.
Thus the responses to the targets of the two example neurons depicted in Figure 5 had two characteristics in common, even though they preferred different orientations: (1) the selectivity for target orientation was greater than that for target contrast; and (2) the selectivity was enhanced when the target orientation matched the attended orientation (valid condition). These two characteristics were commonly observed across the recorded L-IPS neurons. In the following sections, we will first describe the feature selectivity and then describe the effect of attention on the population activity of L-IPS neurons.
Selective responses to target features: population analysis
To quantify the degree of selectivity for each visual feature, we calculated an orientation selectivity index and a contrast selectivity index for each neuron. Comparisons of the two selectivity indexes across the population of L-IPS neurons are shown in Figure 6. The results obtained from the two monkeys are shown separately in the left and right columns. In the valid condition (Fig. 6A), a majority of the data points (71.0%; 46 of 68 neurons in monkey GG, 20 of 25 neurons in monkey FZ) were located above the diagonal line, indicating that the orientation selectivity tended to be stronger than the contrast selectivity. In both monkeys, the mean orientation selectivity index (0.28 for monkey GG, 0.37 for monkey FZ) was significantly larger than the mean contrast selectivity index (0.14 for monkey GG, 0.14 for monkey FZ; p < 0.001 for both monkeys, Wilcoxon signed-rank test).

Comparison of the neuronal selectivities for target orientation and contrast across the population of recorded neurons. A, Responses in the valid condition. Each point represents a neuron and is plotted at a position corresponding to its contrast selectivity index (horizontal axis) and the orientation selectivity index (vertical axis). Left and right panels show the data from monkeys GG and FZ, respectively. The cross indicates the average of the selectivity index. Open circles represent the result obtained with the neuron depicted in Figure 5. B, Responses in the invalid condition. Other conventions are the same as in A.
The results obtained in the invalid condition (Fig. 6B) are essentially the same as in the valid condition. In more than half of the neurons (63.4%; 44 of 68 neurons in monkey GG, 15 of 25 neurons in monkey FZ), the data points were located above the diagonal line, and again the mean orientation selectivity index (0.23 for monkey GG, 0.29 for monkey FZ) was larger than the mean contrast selectivity index (0.16 for monkey GG, 0.16 for monkey FZ; p = 0.054 for monkey GG, p = 0.010 for monkey FZ, Wilcoxon signed-rank test). It should be noted that if a neuron responded to only one target stimulus, the orientation selectivity index would equal the contrast selectivity index, and the data point would fall on the diagonal line in the scatter plot. Therefore, these results confirm that this population of L-IPS neurons exhibit greater selectivity for a target's orientation than for its contrast in both attention conditions, and indicate that the biased distribution of target stimulus ranks shown in Figure 4 reflects this selectivity for target orientation. Some of these L-IPS neurons also exhibited orientation selectivity to the conventional bar stimuli although the responses tended to be weaker than those to the target stimuli in the grouping detection task (supplemental Results, available at www.jneurosci.org as supplemental material).
Effect of attention: population analysis
The example neurons depicted in Figure 5 showed greater orientation selectivity in the valid condition than in the invalid condition. To determine whether this is characteristic across the population of L-IPS neurons, we computed an attention modulation index for each neuron, the distribution of which is shown in Figure 7. For both monkeys, the mean attention modulation index (0.10 for monkey GG, 0.15 for monkey FZ) was significantly larger than zero (p = 0.044 for monkey GG, p = 0.014 for monkey FZ, t test), indicating that the selectivity for target orientation was greater in the valid condition than in the invalid condition. And if we consider only the cells that showed a significant main effect of target orientation in the ANOVA, the mean attention modulation index (0.18 for monkey GG, 0.19 for monkey FZ) was even larger (Fig. 7, dark gray bars). These results are consistent with the idea that selectivity for target orientation is enhanced in the valid condition. To examine whether attention to the target orientation modulates the selectivity for target contrast, we computed an attention modulation index for contrast by replacing DBO in Equation 1 with DBC. Unlike the index for target orientation, the attention modulation index for contrast selectivity was not significantly different from zero (−0.03, p = 0.72 t test in monkey GG; −0.05, p = 0.74 in monkey FZ). This means that whereas attention toward target orientation increases the selectivity for target orientation, it has no effect on selectivity for target contrast.

Distribution of the attention modulation index. Left and right panels are for neurons recorded from monkeys GG and FZ, respectively. Open triangles indicate the average modulation indexes for the entire population. Dark gray bars represent neurons showing significant selectivity for the target orientation in ANOVA; the average modulation index for these neurons is indicated by a filled triangle. A positive value of the index indicates that the neuron exhibited greater selectivity in the valid condition than in the invalid condition. The asterisks denote statistical significance (*p < 0.05, **p < 0.01, t test).
Attention to orientation was guided by a different paradigm with each monkey. A visual cue was used with monkey GG, which made it difficult to completely separate the effect of attention from the influence of the sensory input on neuronal activity. In the other monkey (FZ), however, attention was guided by a block design, and no visual cue was presented, which enabled us to rule out the possibility that the visual cue affected the observed neuronal activity. That we observed similar neural selectivity and attentional modulation in both monkeys means that it is very likely that differences in the response modulation between the valid and invalid conditions are due to the effect of attention, not the influence of visual sensory input.
Mechanism of the attentional modulation
The analysis described so far showed that the selectivity for target orientation was enhanced in the valid condition. To better understand the mechanism underlying that enhancement, we next analyzed the responses to the target stimuli to determine how they are affected by the attended orientation. Figure 8A shows the responses of the same neuron depicted in Figure 5A–C, but in this case the responses were sorted according to the attended orientation. The responses to the target stimuli were consistently stronger when the monkey directed its attention to the horizontal orientation (open circles) than when attention was directed to the vertical orientation (filled circles). Similar response modulation that was dependent on the attended orientation was also observed in responses to the nontarget stimuli (Fig. 8B). The average neuronal response elicited when the monkey directed its attention to the preferred orientation (open triangle, 38.8 ± 7.48 spk/s) was significantly greater than that elicited when attention was directed to the nonpreferred orientation (filled triangle, 25.6 ± 6.23 spk/s) (p < 0.01, t test). This suggests that attention toward a particular orientation biased the magnitude of this neuron's response. Considering that this example neuron preferred the horizontal target (Fig. 5A), we think that the response to the target was increased when the monkey directed its attention to the preferred orientation and reduced when attention was directed to the nonpreferred orientation. Such response modulation can naturally explain the enhancement of neural selectivity in the valid condition. Because the attended orientation and the stimulus orientation are the same in the valid condition, the responses to target stimuli with the preferred orientation will increase, whereas those to target stimuli with the nonpreferred orientation will decrease, which will enhance the selectivity for the target orientation.

Effect of the attended orientation on the responses of an example neuron. This is the same neuron depicted in Figure 5A. A, Responses to the target stimuli when the monkey directed its attention toward the preferred orientation (horizontal for this neuron, open circles) or toward the nonpreferred orientation (vertical, filled circles). B, Responses to the nontarget stimuli when attention was directed toward the preferred orientation (left) and toward the nonpreferred orientation (right). Short horizontal bars represent the responses to nontarget stimuli. A triangle represents the mean.
Response enhancement was generally observed in the recorded L-IPS neurons when attention was directed toward the preferred orientation. In Figure 9A, the results obtained from the two monkeys are shown separately in the left and right columns. The preferred orientation was defined as the orientation in which the average firing rate was higher in the valid condition, and the nonpreferred orientation was the orthogonal orientation. The average responses to the target when the monkeys directed their attention to the preferred orientation (open triangle, 24.3 spk/s in monkey GG, 22.1 spk/s in monkey FZ) were significantly higher than those when attention was directed to the nonpreferred orientation (filled triangle, 22.8 spk/s in monkey GG, 19.8 spk/s in monkey FZ; p < 0.001 in both monkeys, paired t test). In addition, the result obtained for the response to the non-target was similar to the response to the target (Fig. 9B). The average responses to the non-target obtained when the monkeys directed their attention to the preferred orientation (open triangle, 23.0 spk/s in monkey GG, 21.3 spk/s in monkey FZ) were significantly higher than those obtained when attention was directed to the nonpreferred orientation (filled triangle, 21.0 spk/s in monkey GG, 18.0 spk/s in monkey FZ; p < 0.001 in both monkeys, paired t test). Thus, the population of L-IPS neurons responded more strongly when the monkeys directed their attention to the preferred orientation than when their attention was directed to the nonpreferred orientation.

Effect of the attended orientation on the responses of the recorded neurons. A, Responses of each neuron to the target stimuli when attention was directed toward its preferred (open bar) or nonpreferred (filled bar) orientation. Triangles represent the mean responses in each condition. Left and right panels correspond to monkeys GG and FZ, respectively. B, Responses to the nontarget stimuli. Other conventions are the same as in A. Note that each neuron provides four responses to the target stimuli and 16 responses to the nontarget stimuli in each attention condition.
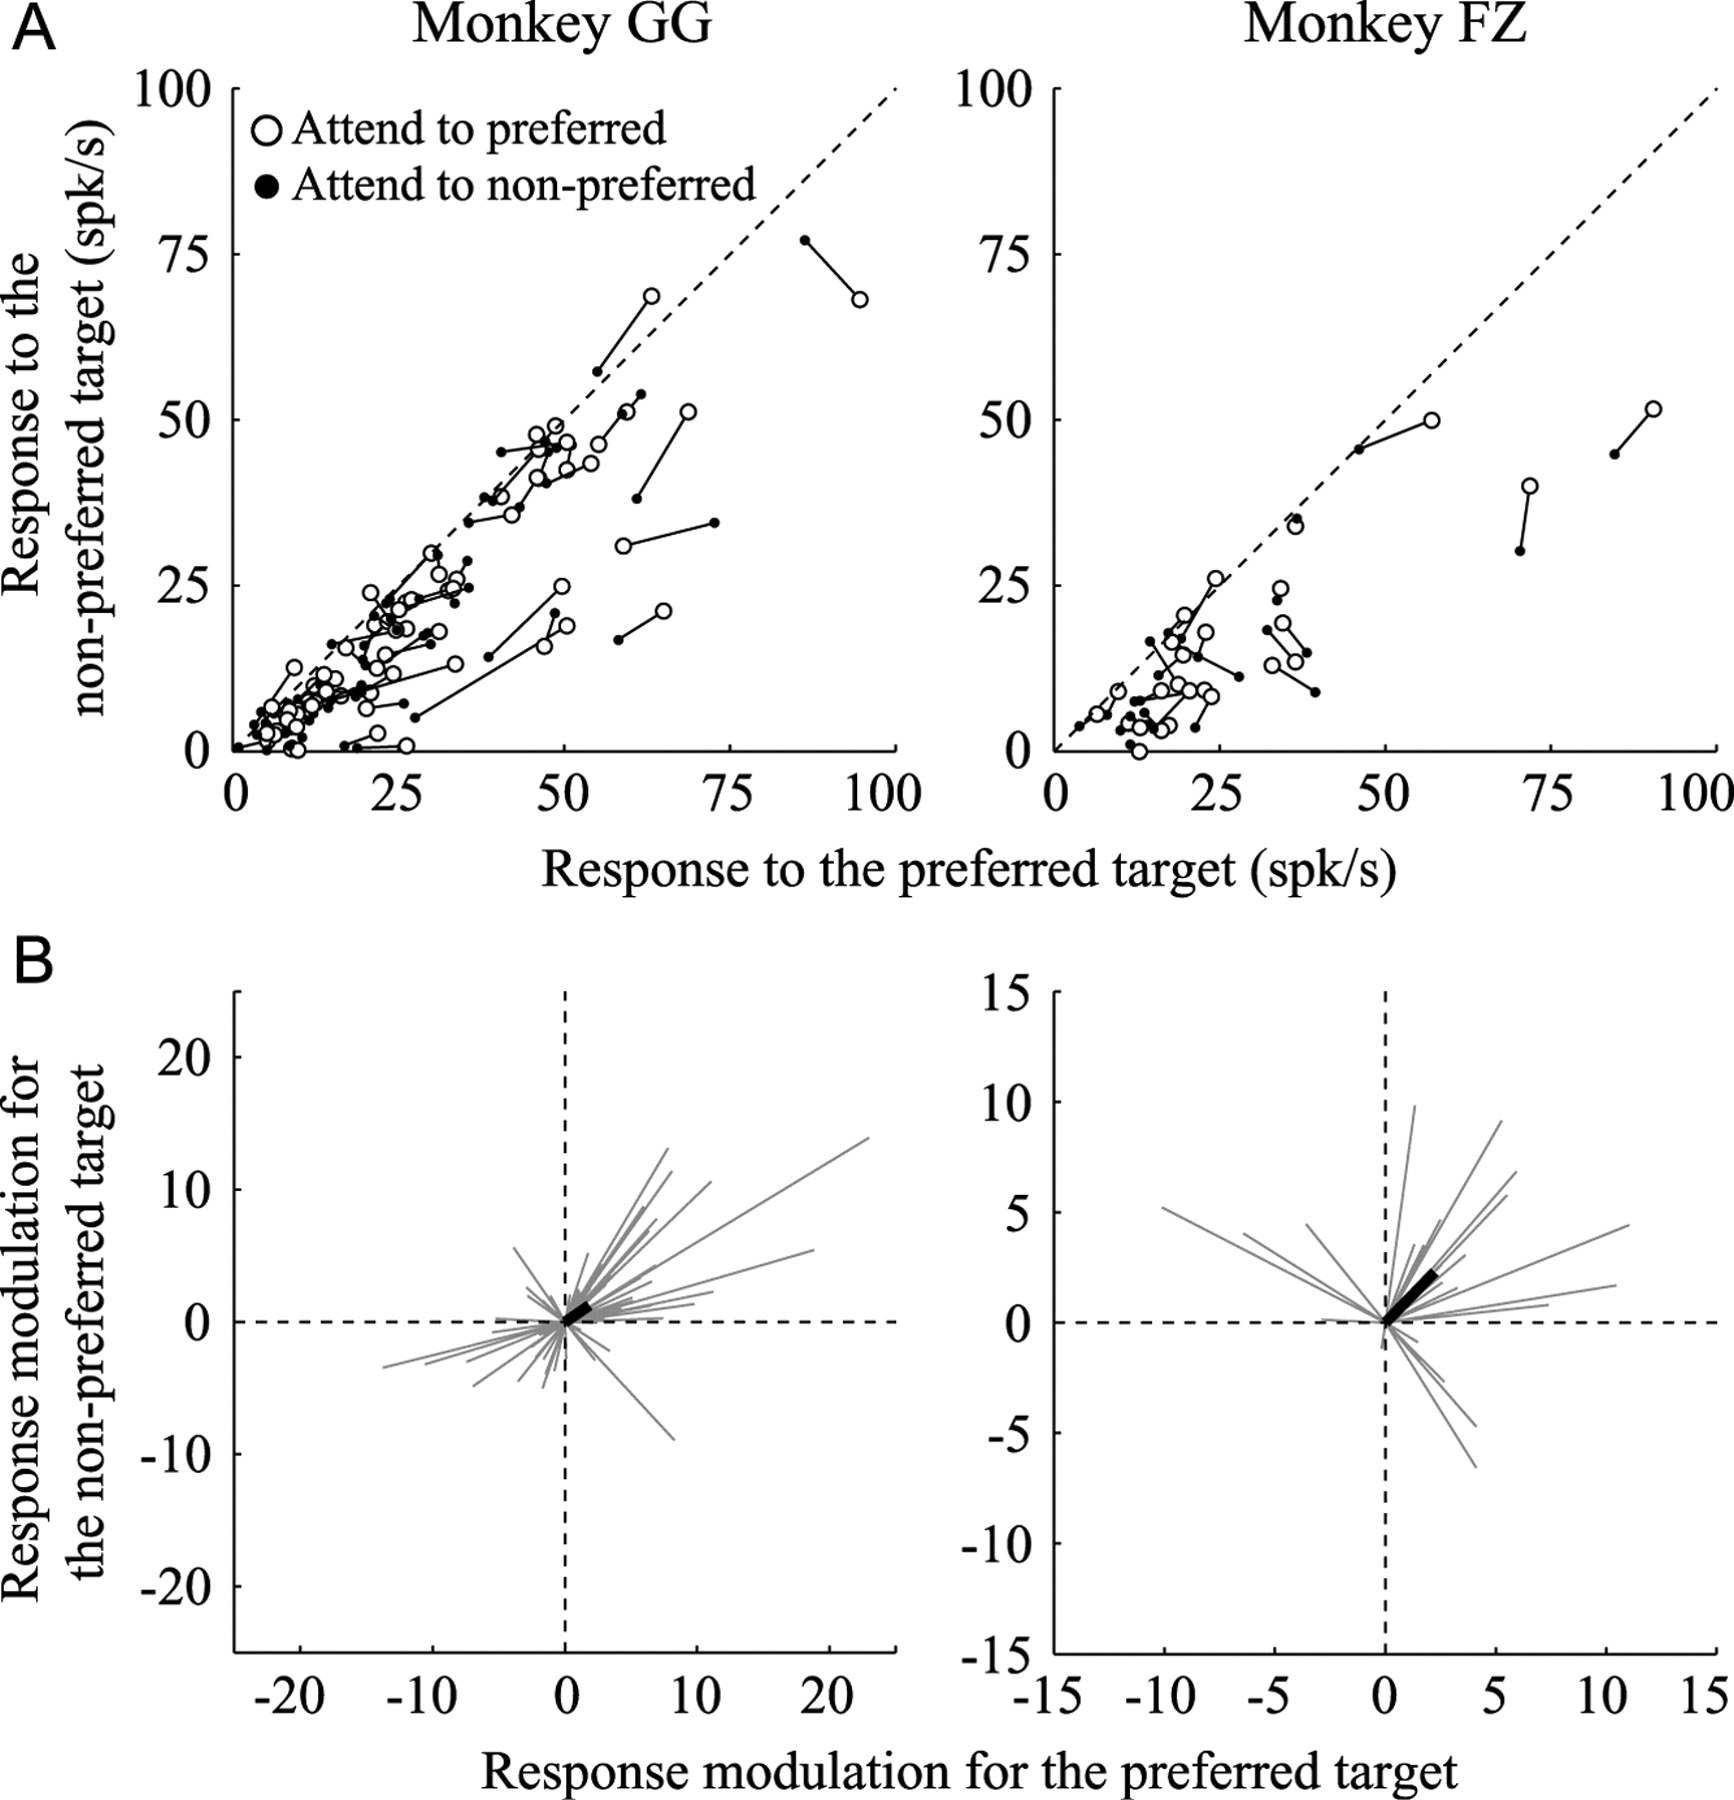
The responses of the neuron depicted in Figure 8 were enhanced when the monkey directed its attention to the preferred orientation, regardless of whether the target stimulus was preferred or non-preferred. To determine whether this pattern of response modulation is characteristic of L-IPS neurons, we compared responses to the same target in the preferred orientation (preferred target) or the nonpreferred orientation (nonpreferred target) while attention was being directed toward the preferred orientation for each neuron or toward the orthogonal orientation. Figure 10A shows the comparison of these responses for each neuron recorded from the two monkeys. Each circle represents the response to the preferred (horizontal axis) and nonpreferred (vertical axis) targets, with the open and solid circles representing attention to the preferred and nonpreferred orientations, respectively. The two data points (open and solid circles) obtained from the same neuron are connected by a line segment. In this diagram, if the response of a given neuron was stronger when attention was directed toward the preferred orientation than when it was directed toward the orthogonal orientation, the distance from the origin of the coordinates will be larger for the open circle than the solid circle. In addition, if the responses to the preferred and nonpreferred targets are similarly modulated by the change in the attention condition, the line connecting the open and solid circles will be parallel to the diagonal line. Although the effects of the attention condition varied from neuron to neuron, there was a general tendency for the response modulation to be similar between the preferred and nonpreferred targets. For each neuron, response modulation that was dependent on the attention condition can be represented as a vector corresponding to the positional difference between the open and solid circles: the horizontal component of the vector represents the magnitude of the response modulation of the preferred target, while the vertical component represents that for the nonpreferred target. Figure 10B shows vector representations of the response modulation of all the recorded L-IPS neurons. In both monkeys, the average of the modulation (thick-black line) pointed to the first quadrant—i.e., the average magnitude of the response modulation for the preferred target was significantly larger than zero (1.85, p = 0.01 t test in monkey GG; 2.24, p = 0.02 in monkey FZ); likewise, that to the nonpreferred target was also significantly larger than zero (1.26, p = 0.02 t test in monkey GG; 2.29, p < 0.01 in monkey FZ). This means that attention directed toward the preferred orientation for a given neuron tended to increase responses to both the preferred and nonpreferred targets. A large majority of neurons pointing to the first quadrant in Figure 10B (32 of 37 in monkey GG, 14 of 15 in monkey FZ) exhibited enhanced selectivity for the target orientation in the valid condition, during which the attention modulation index was larger than zero (Fig. 7), whereas few neurons pointing to other quadrants (6 of 31 in monkey GG, 2 of 10 in monkey FZ) exhibited such enhancement of selectivity. This suggests that the enhancement of the selectivity for the target orientation in the valid condition was mainly due to the greater magnitude of the responses to the target stimuli obtained when the monkeys directed their attention to the preferred orientation.

Comparison of the attentional modulation of responses to the target with the preferred orientation and to that with the nonpreferred orientation. A, Each data point represents the mean response of a single neuron to the target with the preferred orientation (horizontal axis) and to that with the nonpreferred orientation (vertical axis). Open circles represent the response when the monkeys directed their attention toward the preferred orientation, and the filled circle when they directed it toward the nonpreferred orientation. Data points obtained from the same neuron are connected by a line segment. Left and right panels correspond to monkeys GG and FZ, respectively. B, Vector representation of the effects of attended orientation on the responses to the target. A thin-gray line represents as a vector the positional difference between the open and filled circles for each neuron in A. The origin of the coordinates corresponds to the response when the monkey directed its attention toward the nonpreferred orientation and the end point of a vector corresponds to the response when it directed its attention toward the preferred orientation. A thick line indicates the average of the vectors.
Time course of the orientation selectivity and attentional modulation
Figure 11A illustrates the time course of the population activity for all the neurons (n = 93) in the different stimulus conditions. Red and blue lines represent the valid and invalid conditions, respectively, while the solid and broken lines represent the preferred and nonpreferred orientations. The order of the response amplitudes is consistent with the results described above. When the time courses of the responses were compared, the difference in the responses between the preferred (solid line) and nonpreferred (broken line) orientations occurred earlier in the valid condition (red) than in the invalid condition (blue). This can be seen more clearly in Figure 11B, which shows the differences between the responses to the preferred and nonpreferred orientations. In the valid condition (red), the response differences arose 50 ms after stimulus onset and reached a maximum at 170 ms. In the invalid condition (blue), in contrast, the differences arose 100 ms after stimulus onset and reached a maximum at ∼200 ms. We computed the time at which the response difference reached its half-maximum after stimulus onset. In 19 neurons this time was <30 ms in one or the other attention condition, as the maximum was positioned around the stimulus onset. These neurons were excluded from the following analysis because the latencies were unreliable. For the remaining neurons, the average time at which the response difference reached half maximum in the valid condition (mean ± SD: 115.6 ± 37.8 ms) was ∼40 ms shorter than that in the invalid condition (152.1 ± 44.8 ms, p < 0.0001 paired t test, n = 74), which means that orientation selectivity arose earlier in the valid condition than in the invalid condition.

Time course of the visual responses in different conditions. Averaged neuronal activities for the entire population (93 neurons) are shown for the valid (red) and invalid (blue) conditions. A, Average responses to the target with the preferred orientation (solid line), the target with the nonpreferred orientation (broken line), and nontarget stimuli (gray line). B, Average differences between the responses to the target with the preferred orientation and to that with the nonpreferred orientation across the population of recorded neurons. Shaded area represents ±SEM.
In summary, we found that the orientation selectivity of neurons was enhanced and arose earlier in the valid condition and, correspondingly, the monkeys exhibited better behavioral performance. Apparently, selective responses to the target orientation of L-IPS neurons correlate with the behavioral performance in the monkey.
Correlation between neural selectivity and behavioral performance
To determine whether there was a trial-by-trial relationship between L-IPS neuron activity and the behavioral performance, we computed the correlation between the neuronal firing rates and the monkeys' reaction times for each target stimulus condition in each trial. The number of spikes occurring within the period from 80 to 180 ms after stimulus onset, during which there was a large difference in neural selectivity for the target orientation between the valid and invalid conditions (e.g., Fig. 11B), were converted to firing rates. Figure 12 A shows the correlation between the trial-by-trial firing rate and the reaction time for the neuron depicted in Figure 5A–C. The preferred orientation of this neuron was horizontal. When the target stimulus had the preferred orientation (horizontal), the reaction time was negatively correlated with the firing rate (Fig. 12Aa,c), although the correlation was not significant for the black horizontal target (Fig. 12Ac). In contrast, when the target stimulus had the nonpreferred orientation (vertical), the reaction time was positively correlated with the firing rate (Fig. 12Ab,d). This indicates that the increase in the response to the preferred stimulus shortened the reaction time, while the increase in the response to the nonpreferred stimulus delayed the reaction time. This tendency was observed across the population of L-IPS neurons, and Figure 12B shows the distribution of the correlation coefficients computed for the responses to the preferred (Fig. 12Ba) and nonpreferred (Fig. 12Bb) orientations. The correlation coefficient was, on average, significantly less than zero for the preferred orientation (mean = −0.087, p < 0.00001, t test) and significantly larger than zero for the nonpreferred orientation (0.071, p < 0.00001, t test). The same results were obtained when the correlation coefficient was computed for responses in only the valid condition (preferred orientation; mean = −0.072, p < 0.00001, nonpreferred orientation; 0.052, p = 0.00003, t test). These results are consistent with the idea that the orientation-selective responses of L-IPS neurons closely correlate with the monkey's behavior.
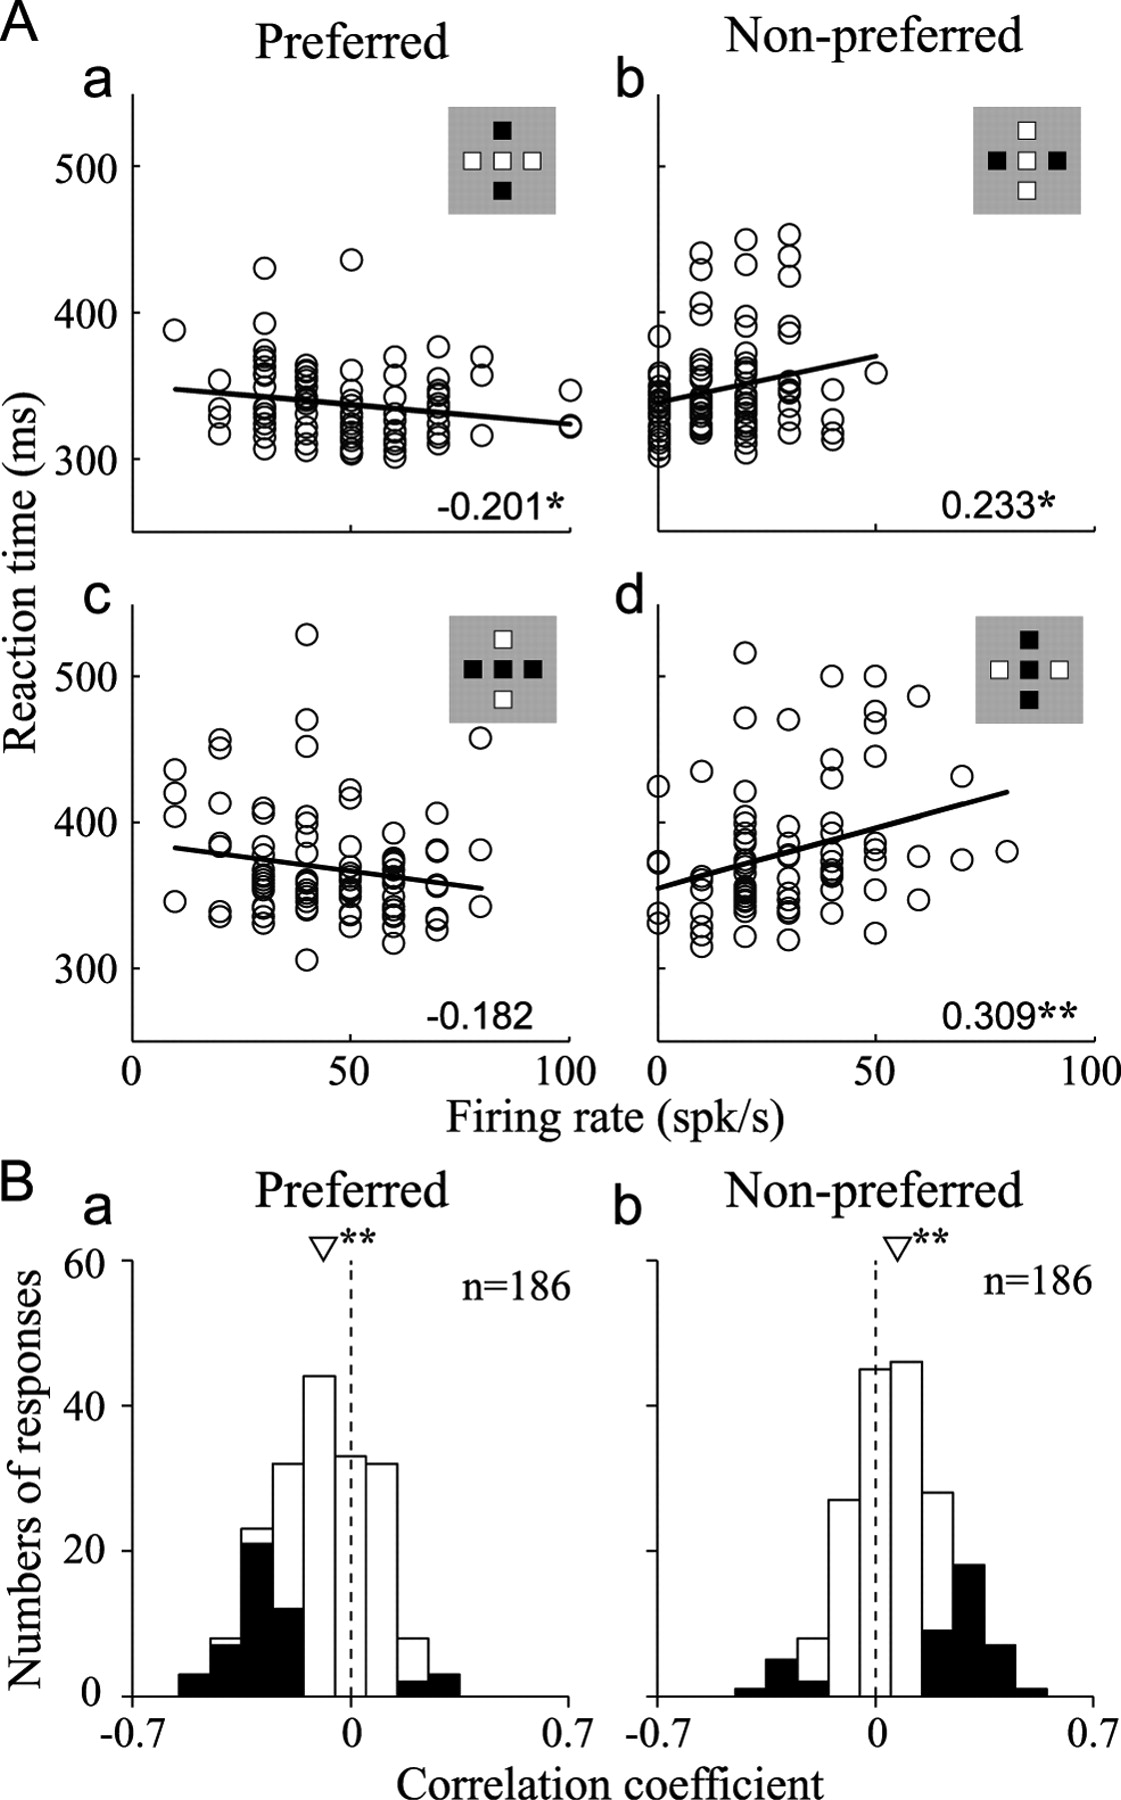
Correlation between neuronal activity and task performance. A, Correlations between the magnitudes of the visual responses and the reaction times for the neuron depicted in Figure 5A–C are shown. Each panel corresponds to the indicated target. For this neuron, horizontal is the preferred orientation (left column, a and c). In each panel, each data point reflects the mean firing rate computed in a trial (horizontal axis) and the reaction time in the same trial (vertical axis). The solid lines indicate the linear regression fits, and the numerical values indicate Pearson's correlation coefficient. The asterisks denote significance of the regression (*p < 0.05, **p < 0.01). B, Correlation between neuronal activity and task performance for the population of recorded neurons. Distributions of the correlation coefficients computed for the responses to the target in the preferred (a) and nonpreferred (b) orientations. The triangle indicates the average correlation coefficient. Note that the correlation was estimated for each target stimulus, so that each neuron provides two data points for each orientation. The asterisks denote significance of the regression (*p < 0.05, **p < 0.01, t test). Filled bars represent responses with significant correlation (p < 0.05).
Discussion
We recorded the activities of single neurons in the L-IPS while two monkeys performed a grouping detection task. We found that L-IPS neurons selectively responded to target orientation, that this selectivity was enhanced when the target orientation matched the attended orientation, and that the orientation-selective responses correlated with the monkeys' behavior. This suggests that L-IPS neurons play important roles in the grouping and detection of objects comprised of discrete elements.
Grouping of discrete elements in the L-IPS
Numerous studies have shown that the posterior parietal cortex participates in spatial attention and selection/intention of goal-directed movements (Barash et al., 1991; Colby et al., 1996; Snyder et al., 2000; Shadlen and Newsome, 2001; Bisley and Goldberg, 2003, 2006; Balan and Gottlieb, 2006). In our task, L-IPS neurons were expected to show stronger responses to target stimuli than to nontarget stimuli because the monkeys' spatial attention should shift toward the target location when they detected the target. This is not what we observed, however. Instead, the responses to the target were biased toward the highest and lowest levels among the responses to all stimuli, and selectively represented the target orientation, which was a feature formed by the grouping of discrete dots. The receptive fields of individual neurons in V1–V3 are too small to determine whether a stimulus is the target or the non-target (supplemental Discussion, available at www.jneurosci.org as supplemental material). The receptive fields of V4 neurons are large enough to represent the entire stimulus, but it is not known whether the activity of V4 neurons is related to the grouping of aligned dots. In contrast, we found the activity of neurons to be selective for the target orientation in the L-IPS.
It is reported that L-IPS neurons can acquire the selectivity for the visual features (e.g., color and motion direction) that are important for performance of a behavioral task (Toth and Assad, 2002; Freedman and Assad, 2006). In the present study, each stimulus contained two visual features, orientation and contrast. Of these, only orientation was diagnostic for detection of the target. Presumably, the selectivity of L-IPS neurons for the orientation of the aligned dots developed as a result of the learning, and was involved in the performance of the grouping detection task.
Attentional control of visual grouping
Visual grouping is facilitated by prior knowledge via top-down attentional control. In the present study, we found that the detection of a grouped target by L-IPS neurons is controlled by prior knowledge of the target orientation. We found that L-IPS neurons tended to respond more strongly when a monkey directed its attention to the preferred orientation of the neuron under study. Such response modulation enhanced the selectivity for the target orientation in the valid condition. These results suggest that the neural population preferring the horizontal orientation and that preferring the vertical orientation are selectively enhanced or suppressed by the top-down signal in a reciprocal manner. This pattern of attentional modulation agrees well with the biased-competition model of selective attention (Desimone and Duncan, 1995; Reynolds and Desimone, 2003). Notably, patients with damage to their parietal cortex show an impaired ability to employ prior knowledge for visual grouping (Robertson et al., 1988). The absence of the facilitated grouping of objects through attention to the relevant feature, like that observed in the present study, could underlie the deficits in these patients.
Perception of the global shape of hierarchically organized stimuli is known to require visual grouping (Navon, 1977), but the findings of imaging studies employing such stimuli with humans and monkeys have been inconsistent. Some studies have shown that directing attention to stimuli on either the global or local level activated the occipital prestriate cortex or the inferior temporal cortex (Heinze et al., 1998; Sasaki et al., 2001; Tanaka et al., 2001). In contrast, when attention was switched between the global and local levels, the parietal cortex was activated (Fink et al., 1996). It has been suggested that, in normal subjects, the global advantage automatically generates global gestalt perception, which will mask activity related to global perception if activities are simply contrasted between local and global attention conditions (Himmelbach et al., 2009). The present findings suggest that the parietal cortex plays an important role in the selection of global gestalt objects from among multiple candidates.
Relation to the functional organization of the IPS
The cortex in the L-IPS region is thought to be comprised of multiple areas having different functions (Lewis and Van Essen, 2000; Grefkes and Fink, 2005). Selectivity for object shape has been observed in both the AIP and LIP, which are adjacently situated within the L-IPS (Sereno and Maunsell, 1998; Murata et al., 2000). LIP has been usually identified based on the activities during a memory-guided saccade task. Because we did not employ this task, we do not know whether the recordings made in the present study were from within the AIP or LIP. Judging from the reported stereotaxic coordinate of these areas (Toth and Assad, 2002; Sereno and Amador, 2006; Borra et al., 2008; Janssen et al., 2008), our recording site (A3–P4) seems mainly situated in the anterior part of LIP and possibly includes a part of AIP. Important functional aspects of neurons within those two areas are activities related to saccadic eye movements or complex hand manipulation. However, neuronal responses in the present study have no relevance to either of these, as the monkeys maintained fixation and responded with a simple lever press/release. Thus, our findings reveal an important new aspect of the response properties of neurons in the L-IPS involved in visual grouping.
Shape selectivity in the ventral and dorsal streams
It was previously reported that neurons exhibiting selectivity for an object's shape are present in areas positioned within both the ventral stream (Desimone et al., 1984; Desimone and Schein, 1987; Tanaka et al., 1991; Pasupathy and Connor, 2002) and dorsal stream (Sereno and Maunsell, 1998; Murata et al., 2000; Durand et al., 2007; Janssen et al., 2008). Previous studies have shown that the way shape is encoded differs between the dorsal and ventral visual stream areas (Lehky and Sereno, 2007; Janssen et al., 2008). In one study, Janssen et al. (2008) showed that LIP neurons exhibit only minimal size and position invariance and concluded that shape selectivity in the LIP radically differs from that in the ventral visual areas. They suggested that LIP neurons do not provide an abstract representation of two-dimensional shapes; instead, the shape selectivity of these neurons may be related to accomplishing appropriate eye movements or grasping.
There may be an additional difference between the shape selectivities of neurons in the dorsal and ventral stream areas: our present results have shown that neurons in the L-IPS exhibit shape selectivity for objects formed by the visual grouping of isolated elements. On the other hand, recent studies have shown that the shape selectivity of neurons in areas within the ventral stream (e.g., V4 and the inferior temporal cortex) are based on the orientation and curvature of the object contour (Connor et al., 2007). This raises the interesting possibility that the encoding of shape in ventral stream areas is based on an analysis of the continuous contour, whereas in dorsal stream areas it is based more on the visual grouping of the discrete elements. Using normal human subjects, Xu and Chun (2007) recently showed that the grouping of discrete elements reduced activity in the inferior parietal cortex, while activity in the LOC, which is thought to belong to the ventral stream, was unchanged. This suggests that the inferior parietal cortex is involved in the encoding of visual grouping, but the LOC is not, which is consistent with the idea summarized above and emphasizes that the L-IPS is specifically involved in visual grouping. Interestingly, those authors suggested that the encoding of grouping within the L-IPS occurs automatically, without attention, as grouping was irrelevant to the main task performed by the subjects. Similarly, in our present experiment, selectivity for the target orientation was clearly observed in the invalid condition, during which the monkey's attention was directed to a different orientation. This suggests that the neural mechanism responsible for the development of the orientation selectivity of L-IPS neurons can be driven by bottom-up visual signals. Thus, the L-IPS may be regarded as the site where top-down signals facilitating the grouping of visual elements through attention or expectation meet the bottom-up visual signals consistent with the Gestalt principles of grouping.
L-IPS neurons encoding visual grouping may in turn facilitate neuronal activity related to visual grouping in the early visual areas. Neuronal activity in V1 is modulated by the presentation of visual stimuli in the receptive field surround, and it has been suggested that this contextual modulation is related to the visual grouping (Gilbert et al., 2000). In addition, this V1 activity can be modulated by attention. Presumably, L-IPS neurons provide feedback signals to the early visual areas and affect the contextual modulation there. A recurrent circuit between the L-IPS and early visual areas may be critical for visual grouping through the interchange of feedforward and feedback signals.
Footnotes
-
This work was supported by a “Biological Information Technology Grant for Top Priority Research and Development to Be Focused” from the Ministry of Public Management, Home Affairs, Posts, and Telecommunications and a Japanese Grant-in-Aid for Scientific Research on Priority Areas Grant 17022040 (“System study on higher-order brain functions”) from Ministry of Education, Culture, Sports, Science, and Technology of Japan. We thank T. Ogawa, M. Ito, and Y. Wang for helpful discussion during the course of this study; K. Koida for useful advice on data analysis; and M. Togawa and Y. Tanabe for technical assistance.
- Correspondence should be addressed to Dr. Hidehiko Komatsu, Division of Sensory and Cognitive Information, National Institute for Physiological Sciences, Myoudaiji, Okazaki, 444-8585, Aichi, Japan. E-mail: komatsu{at}nips.ac.jp


