

Abstract
Synaptic vesicles undergo sequential steps in preparation for neurotransmitter release. Individual SNARE proteins and the SNARE complex itself have been implicated in these processes. However, discrete effects of SNARE proteins on synaptic function have been difficult to assess using complete loss-of-function approaches. We therefore used a genetic titration technique in cultured mouse hippocampal neurons to evaluate the contribution of the neuronal SNARE protein Syntaxin1 (Stx1) in vesicle docking, priming, and release probability. We generated graded reductions of total Stx1 levels by combining two approaches, namely, endogenous hypomorphic expression of the isoform Stx1B and RNAi-mediated knockdown. Proximity of synaptic vesicles to the active zone was not strongly affected. However, overall release efficiency of affected neurons was severely impaired, as demonstrated by a smaller readily releasable pool size, slower refilling rate of primed vesicles, and lower release probability. Interestingly, dose–response fitting of Stx1 levels against readily releasable pool size and vesicular release probability showed similar Kd (dissociation constant) values at 18% and 19% of wild-type Stx1, with cooperativity estimates of 3.4 and 2.5, respectively. This strongly suggests that priming and vesicle fusion share the same molecular stoichiometry, and are governed by highly related mechanisms.
Introduction
Synaptic transmission requires the rapid, regulated exocytosis of neurotransmitter from vesicles at the presynapse. To ensure availability during activity, synaptic vesicles (SVs) undergo repeated rounds of exocytosis and endocytosis. Part of this trafficking cycle prepares vesicles for efficient merger with the plasma membrane. These steps include morphological vesicle docking to the active zone and priming, which is defined as the assembly of the molecular apparatus for action potential (AP)-evoked and spontaneous release before fusion (Südhof, 2004). Although key presynaptic proteins have been identified, the exact molecular interplay during docking, priming, and fusion are not fully understood.
The soluble N-ethylmaleimide-sensitive factor (NSF) attachment protein (SNAP) receptor (SNARE) complex is composed of the vesicle-anchored protein synaptobrevin2 (Syb2), and the plasma membrane-localized proteins syntaxin1 (Stx1) and SNAP25. Although SNARE proteins alone cannot mediate fusion in vivo without Sec1/Munc18-like protein as a partner (Südhof and Rothman, 2009), deletion of SNARE proteins in different species arrested neurotransmission. SNARE homologs are also essential for non-neuronal cellular trafficking processes (Jahn and Scheller, 2006), establishing them as highly conserved core components of the fusion machinery.
Deletion studies in mammalian systems suggest that neuronal SNARE proteins are fundamental not only for the fusion event, but also for canonical upstream steps in the exocytosis pathway. Removal of SNAP25 and Syb2 impaired evoked neurotransmitter release and severely reduced the readily releasable pool (RRP) of primed vesicles (Schoch et al., 2001; Washbourne et al., 2002; Delgado-Martínez et al., 2007). Knock-out mutants of the isoform Stx1A did not show significant differences in evoked neurotransmission (Fujiwara et al., 2006; Gerber et al., 2008), but there may be functional redundancy with another isoform, Stx1B (Bennett et al., 1992). Interestingly, endogenous expression of an “open form” mutant of Stx1B (Dulubova et al., 1999), in the absence of Stx1A, decreased RRP but increased vesicular release probability (Pvr; Gerber et al., 2008). Thus, aside from expression, SNARE conformation can also regulate priming and fusion efficiency.
Here we provide a comprehensive analysis of the possible roles of Stx1 in preparing vesicles for efficient release, aside from having a core function in membrane fusion. Invertebrate loss-of-function mutants of Stx1 have provided invaluable evidence for the role of SNARE proteins in fusion (Schulze et al., 1995; Ogawa et al., 1998; Saifee et al., 1998), but a complete lack of expression prohibited functional evaluation of other steps. The potentially severe effect of total Stx1 loss on neuronal development in mammals, as observed in Drosophila (Schulze et al., 1995), was another consideration. Furthermore, studies involving cleavage of Stx1 using botulinum toxins did not quantify the change in expression levels after treatment (Sakaba et al., 2005; de Wit et al., 2006). We therefore used a combination of genetic approaches in mammalian neurons, namely hypomorphic expression and RNAi-mediated knockdown (k.d.), to titrate down Stx1 to controlled amounts and study the consequences on neurotransmitter release. Using this approach, we quantified morphological and physiological correlates of docking, priming, and fusion in central synapses as a function of Stx1 expression levels.
Materials and Methods
Generation and maintenance of mouse lines.
Construction of the Stx1Byfp targeting vector, generation of the mouse line, and genotyping protocols are described in detail in the Supplemental Experimental Procedures section of the study by Gerber et al. (2008). Briefly, a rat Stx1B cDNA fragment encoding residues 178–290 was amplified by PCR, such that the stop codon was replaced by a 10 aa GS linker sequence. Enhanced yellow fluorescent protein (EYFP) was subcloned downstream of the linker sequence. The Stx1B–EYFP fusion construct was subsequently inserted in-frame into a PCR-amplified mouse Stx1B exon 7. This artificial exon 7, together with a FRT-flanked neomycin resistance gene (NEO) cassette, was inserted into intron 6 of a previously modified mouse Stx1B genomic fragment (containing the previously published L165A, E166A “open-form” mutations; Gerber et al., 2008). Assembly of the modified mouse Stx1B genomic fragment, together with overlapping fragments spanning exons 2–10, and subcloning of the diphtheria toxin sequence into the 5′ end, completed the targeting vector for homologous recombination.
The Stx1Byfp targeting construct was linearized and electroporated into R1 mouse embryonic stem cells. Colonies were selected for resistance to G418. Homologous recombination was verified by Southern blotting, and positive clones were expanded and injected into C57BL/6 blastocysts. Chimera mice were backcrossed, and progeny were expanded to establish colonies.
Animal maintenance.
The Animal Care and Use Committees for Baylor College of Medicine, University of Texas Southwestern Medical Center, Stanford University, and the animal welfare committees of Charité Berlin and the Berlin state government approved all protocols for animal maintenance and experiments. The Stx1A−/− mouse line was previously characterized (Gerber et al., 2008). To obtain Stx1B;Stx1A double mutants, Stx1A−/− mice were crossed with Stx1B+/yfp mice. Stx1B+/yfp;Stx1A+/− mice were selected and respectively intercrossed to obtain mice for survival studies. Control and test groups for electrophysiological, ultrastructural, and imaging experiments were obtained from littermate offspring of either sex. Genotyping for the Stx1Byfp allele by PCR used the following primers: forward, 5′-CAA GGA CCG AAT CCA GAG GCA G-3′; and reverse, 5′-GCT TTC CAA CAT GTC TTC TAG-3′. Annealing temperature was set at 60°C. The presence of a 260 bp band corresponded to the Stx1B wild-type allele, while a 300 bp band corresponded to the Stx1Byfp allele.
Cell culture.
Primary neuronal cultures were prepared by plating embryonic day 18.5 (E18.5) or postnatal day 0 (P0) mouse-derived hippocampal neurons in previously made astrocyte feeder cultures. First, alkaline-treated 30 mm coverslips were placed in wells of culture plates and coated with 0.15% agarose. Once the agarose is dry, a cell-attachment substrate consisting of acetic acid, collagen, and poly-d-lysine was applied in a dotted pattern using a custom-made rubber stamp. Astrocytes derived from mouse P1 cortices were plated 5–7 d before neurons, and grew only within acetic acid–collagen–PDL islands. For some experiments, proliferation was arrested by adding the antimitotic agent 8 μm 5-fluoro-2-deoxyuridine and 20 μm uridine (FUDR) before replacing astrocyte media with Neurobasal-A media, while some skipped the use of FUDR. To harvest neurons, brains were removed from E18.5 embryos or P0 newborn mice, then were carefully stripped of meninges and dissected in cold HBSS. Isolated hippocampi were incubated in 2 U/ml papain in DMEM at 37°C. After 45 min, papain was inactivated by incubation of tissue in a solution of albumin, trypsin inhibitor, and 5% FCS for 10 min. Tissue was transferred to Neurobasal-A media containing B-27 supplement (Invitrogen), 50 IU/ml penicillin and 50 μg/ml streptomycin, and triturated by repeated pipetting. Cells were plated with a density of 2500 or 3000 neurons per 35 mm well. When necessary, neurons were transduced with lentiviral constructs 18–24 h after plating. Cultures were incubated at 37°C for 9–10 d before starting electrophysiological recordings. For immunoblotting, protein lysates were derived from neurons plated on coverslips coated only with a collagen/poly-d-lysine cell attachment substrate.
Lentiviral constructs.
Lentiviral vectors and production were based on previous work (Lois et al., 2002). HEK293T cells were cotransfected with 8 μg of shuttle vector and 5 μg each of the helper plasmids pVSVg and pCMVdR8.9, using the FuGENE 6 Transfection Reagent (Roche Diagnostic). Virus-containing cell culture media were collected after 48 h and filtered to remove cellular debris. The filtrate was distributed into aliquots, flash-frozen using liquid nitrogen, and stored at −80°C. The viral titer for both rescue and knock-down constructs was estimated by infecting mass cultures of hippocampal neurons and counting the number of cells expressing a fluorescent marker after 7 d. Mouse cDNA rescue constructs of Stx1A and Stx1B were cloned into vectors that placed them under the control of the neuron-specific synapsin promoter. For RNAi knock-down experiments, a Stx1B-specific short hairpin RNA (shRNA) target sequence (5′-GAT CCC AGG CAC AAT GAG ATC ATC AAA-3′) was obtained using Genscript siRNA Target Finder (http://www.genscript.com). An shRNA construct based on the target sequence was then cloned into a shuttle vector that placed them under the control of the U6 promoter. For Munc18-1 rescue experiments, Munc18-1 cDNA (kindly donated by Dr. Matthijs Verhage, Center for Neurogenomics and Cognitive Research, Amsterdam, The Netherlands) and Stx1A cDNA were cloned into a modified 2A peptide-linked multicistronic vector (Kim et al., 2011) with a fluorescent marker under the control of a synapsin promoter. Stx1A or Stx1B expression levels during rescue or knockdown were assessed by immunoblotting. Protein lysates for analysis were derived from mass cultures of hippocampal neurons 13–15 d after transduction with control and experimental constructs.
Electrophysiology.
During recordings, neurons were immersed in standard extracellular solution consisting of 140 mm NaCl, 2.4 mm KCl, 10 mm HEPES, 10 mm glucose, 2 mm CaCl2, and 4 mm MgCl2. The patch pipette internal solution consisted of 136 mm KCl, 17.8 mm HEPES, 1 mm EGTA, 0.6 mm MgCl2, 4 mm ATP, 0.3 mm GTP, 12 mm creatine phosphate, and 50 U/ml phosphocreatine kinase. Both solutions were adjusted to pH 7.4 with osmolarity at ∼300 mOsm. Sucrose solutions for measurements of hyperosmotic release were prepared as 250, 350, 500, and 1000 mm sucrose in standard extracellular solution. Calcium sensitivity assays were performed by application of extracellular solutions containing 0.5, 2, 4, or 12 mm CaCl2, with 1 mm MgCl2 each.
Solutions were applied using a fast-flow system that provides rapid exchange at time constants of ∼20–30 ms (Rosenmund et al., 1995). Borosilicate glass patch pipettes were pulled using a multistep puller (P-87, Sutter Instruments) using conditions that kept pipette resistance between 2 and 3.5 MΩ. Currents were recorded using Multiclamp 700B amplifier (Molecular Devices). Series resistance was compensated at 75%. Data were acquired using Clampex 9.2 software (Molecular Devices) and were filtered using a low-pass Bessel filter at 3 kHz. Off-line analysis was performed using Axograph X (Axograph Scientific). Data summation and statistical analyses were performed using Kaleidagraph 4.0 (Synergy Software), Prism (GraphPad), and SPSS (IBM).
Whole-cell voltage-clamp recordings from autaptic neurons were obtained between 9 and 15 d in vitro (DIV) at room temperature (∼25°C). To minimize variability among datasets, an approximately equal number of cells was recorded from control and experimental groups per day; data from experimental groups during 1 or 2 consecutive days of recording were normalized to the mean value of the control group on the same days. Data were collected from at least two independent cultures. EPSCs were evoked by 2 ms somatic depolarization from −70 to 0 mV. Release due to hypertonic stimulus was triggered by the application of sucrose solution for 3 s (1000 mm), 5 s (500 mm), 8 s (350 mm), or 10 s (250 mm). To measure the readily releasable pool of vesicles in a calcium-independent fashion, 500 mm sucrose solution was applied to neurons for 5 s. A transient inward current lasting for 2–3 s characterizes the release of the RRP. This is followed by a steady-state current, which indicates the point when rates of refilling and release are equal. When the steady-state current is used as a baseline, the area under the transient curve indicates the total charge released by the RRP (Rosenmund and Stevens, 1996). Pvr was determined by calculating the charge ratio of mean EPSC over hyperosmotic release in 500 mm sucrose, after integration of the responses. To analyze short-term plasticity, EPSCs were evoked at a frequency of 10 Hz for 5 s. Spontaneous release was measured by recording miniature EPSCs for 60 s at −70 mV. To detect false-positive events, 3 mm glutamate receptor antagonist, kynurenic acid, was applied for an equal amount of time. Traces were filtered at 1 kHz, and events were detected using a template-based algorithm in Axograph X (Clements and Bekkers, 1997). To fit Ca2+ and sucrose dose–response curves and to determine the relationships among RRP size, Pvr, or paired-pulse ratio and Stx1 expression levels, the standard Hill equation Y = M/[1 + (Kd/X)n] was applied, where Y is response amplitude, X is Ca2+ or Stx1B concentrations, M is the maximum response, Kd is the dissociation constant, and n is cooperativity. Raw mean values are stated with the SD. Unless specified otherwise, the Student's t test was performed for experiments with two groups, and ANOVA with Tukey's test was performed for experiments with three or more groups. Differences among datasets were considered significant at p < 0.05.
Calcium imaging with SynGCaMP2.
The sequence for SynGCaMP2 was cloned from an Addgene plasmid (plasmid 26124: CMV::ratSynGCaMP2) into a lentiviral construct as described above. Autaptic neurons of specified genotypes were recorded in whole-cell patch-clamp mode, as described above. Images of SynGCaMP2 fluorescence (128 × 128 pixels with 2 × 2 binning) were acquired with a Hamamatsu ImageEM CCD camera at a rate of 20 Hz (exposure time, 49 ms) at 60× magnification (numerical aperture, 1.2 water). SynGCaMP2 excitation was induced by a light-emitting diode (470 nm wavelength; Prizmatix Ltd.).
SynGCaMP2 images were analyzed using ImageJ and custom macros (http://rsbweb.nih.gov/ij/plugins/). Regions of interest (ROIs) were identified from the peak fluorescence of 10 baseline-subtracted AP image sequence. ROIs were applied to the entire image series of background-subtracted image sequences to determine the average baseline fluorescence (F0) and AP-induced change in fluorescence (ΔF) for 2, 3, 5, and 10 APs (20 Hz). Each trial was normalized to three F0 images immediately preceding the AP stimulation. The peak ΔF/F0 was measured from these averaged traces per AP trial per cell.
RNA and protein biochemistry.
Total mRNA was extracted from flash-frozen whole brains of E18.5 embryos using TRIzol reagent (Invitrogen). Reverse transcription to generate Stx1B-YFP cDNA was performed using the Transcriptor First Strand cDNA Synthesis Kit (Roche Applied Science). The open reading frame of the fusion protein was targeted using a forward primer containing a Stx1B-specific sequence (5′-TAG CTA GCA TGA AGG ATC GGA CTC AGG AG-3′) and a reverse primer with an EYFP-specific sequence (5′-AAG GCG CGC CTT ACT TGT ACA GCT CGT CCA TG-3′). Reverse transcription PCR (RT-PCR) amplification was performed using Phusion High-Fidelity DNA polymerase (New England Biolabs) with an annealing temperature of 63°C.
Protein lysates for immunoblot quantification were derived from mass cultures of hippocampal neurons or whole-brain lysates. Briefly, cells were lysed using 50 mm Tris/HCl, pH 7.6, 150 mm NaCl, 1% Nonidet P-40, 0.5% sodium deoxycholate, 250 μm PMSF, and 1 tablet of Complete Protease Inhibitor (Roche Diagnostics). Proteins were separated by SDS-PAGE and transferred to nitrocellulose membranes. Membranes were then incubated with mouse monoclonal anti-Stx1A (1:5000) and rabbit polyclonal anti-Stx1B (1:1000; both from Synaptic Systems), or mouse monoclonal anti-β-tubulin III (1:1000; Sigma-Aldrich) antibodies. Primary antibodies were labeled with horseradish peroxidase-conjugated goat secondary antibodies. Detection was performed using ECL Plus Western Blotting Detection Reagents (GE Healthcare Biosciences). Ratiometric quantification of signal intensity was performed using ImageJ software.
Immunocytochemistry.
Cell-surface localization of YFP was determined by incubating neuronal mass cultures with a rabbit polyclonal antibody (Ab) against GFP and GFP-derived fluorescent proteins (1:200; Synaptic Systems) at 5× concentration in PBS at 4°C for 45 min. After washing, cells were subsequently fixed with 4% PFA for 10 min and permeabilized with PBS-Tween 20 for 5 min. After blocking with serum in PBS-Tween 20 for 30 min, cells were incubated with mouse monoclonal antibody against Stx1 (1:1000; Synaptic Systems) for 1 h. Primary antibodies were labeled with Alexa Fluor 555 goat anti-mouse IgG and Alexa Fluor 647 goat anti-rabbit IgG (1:500 each; Invitrogen) secondary Abs. Coverslips were mounted with ProLong Gold Antifade Reagent (Invitrogen).
To measure the degree of colocalization between surface YFP and Stx1B, images were acquired using an Andor Revolution DSD white-light confocal microscopy system (Andor Technology) at 20× optical magnification. Maximum intensity projections were created from z-stacks and merged using ImageJ to create colocalized images. Pearson's coefficients were calculated using built-in plugins to assess the degree of colocalization.
Stx1B expression in synapses was determined by double labeling of DIV 10 autaptic neurons with antibodies against Stx1B (rabbit polyclonal Ab, 1:2500; Synaptic Systems) and the active zone marker Bassoon (guinea pig polyclonal Ab, 1:2500; Synaptic Systems). Cells were fixed with 4% PFA, permeabilized, and blocked using the above-mentioned procedure. Primary antibodies were incubated overnight at 4°C, and labeled with anti-guinea pig DyLight Rhodamine Red-X and anti-rabbit Alexa Fluor 647 (1:500 each; Jackson ImmunoResearch). Coverslips were mounted with Mowiol 4–88 antifade medium (Polysciences Europe).
Quantification of synaptic Stx1B levels.
Stx1B was quantified by measuring fluorescence intensity in regions marked by Bassoon spots. First, images were acquired using an Andor Revolution DSD white-light confocal microscopy system (Andor Technology) at 60× optical magnification and stored as 16-bit data. Overexposure and photobleaching were avoided by checking for saturation in synaptic boutons and neuronal extensions (via built-in features of the Andor Technology iQ software), and minimized by optimizing exposure time. Consistent exposure times were used for each channel per experiment. Z-stacks of autaptic neurons were set with a 0.5 μm interstack interval and total z-axis range of 3–4 μm. Images were then analyzed using ImageJ software with custom plugins (http://rsb.info.nih.gov/ij/). Briefly, sum intensity projections were created from the stacks. Background subtraction and threshold adjustment were performed uniformly across all groups. Three to four regions, excluding the cell body, per neuron were chosen for analysis. Bassoon spots were selected using an intensity threshold and saved as ROIs. Bassoon and Stx1B fluorescence intensities in their respective channels were measured using the same ROIs. Mean Stx1B expression levels in synapses were calculated as the ratio of average Stx1B intensity over average Bassoon intensity. These ratios were normalized against the control group.
Two-dimensional electron microscopy.
DIV 10 neuronal mass cultures were fixed at room temperature for 45 min using a freshly prepared solution of 4% PFA (Electron Microscopy Sciences), supplemented with 0.1% glutaraldehyde (Fluka Chemie) in 0.1 m phosphate buffer, pH 7.4. Following fixation, neurons were rinsed in phosphate buffer and then fixed in phosphate-buffered 0.1% OsO4 for 45 min at 4°C in the dark. After several washes in phosphate buffer and ddH2O, neurons were stained with 2% aqueous uranyl acetate for 45 min at 4°C in the dark, rinsed again in ddH2O, dehydrated in graded ethanol (30, 50, 70, 90, 2× 100%), infiltrated overnight in a 1:1 mixture of hydroxypropyl methacrylate (Sigma-Aldrich Chemie) and of Epon-812 resin (Sigma-Aldrich Chemie), and finally left in pure resin overnight at room temperature. Neurons were embedded on gelatin capsules (Plano) containing freshly prepared resin (coverslips on top with the cells side down) and polymerized for 20 h at 60°C. Coverslips were removed using liquid nitrogen, and regions of the block containing the neurons were remounted for sectioning. Ultrathin sections (60 nm) were cut parallel to the plane of the substrate using a Reichert Ultracut and were mounted on 200-mesh formvar-coated nickel grids (Plano). Thin sections were stained with uranyl acetate (Merck) and lead citrate, and were examined using a Zeiss EM 900 microscope equipped with a digital camera (1K Slow-Scan CCD Camera, Proscan). Neurons from three separate culture preparations were qualitatively examined, and one was selected for quantitative analysis.
Quantitative analysis of ultrastructural parameters was performed to determine the differences between individual genotypes. Micrographs of each genotype were taken at a magnification of 30,000×. Images were imported into the iTEM software package (Olympus Soft Imaging Solutions). Only excitatory synapses identified by their asymmetric junctions were included in datasets. The area of each synapse was determined by outlining the membrane by using the closed polygon tool of the iTEM software package. All SVs within one bouton were included in the dataset, while nonvesicular structures such as cisternae or endosomes were excluded. The length of the presynaptic active zone and postsynaptic densities (PSDs) of a particular synapse were measured by using an open polyline tool of the iTEM software package. The thickness of PSDs in cell culture at DIV 10 is less developed and was not calculated. For each of the ultrastructural features analyzed, all groups were initially compared using a one-way ANOVA.
Electron microscopic tomography.
Samples were prepared using two slightly different methods of chemical fixation. Cells were immersed either in 4% PFA and 0.25% glutaraldehyde in 0.1 m phosphate buffer, pH 7.4, or in 2.5% glutaraldehyde in 0.1 m cacodylate buffer, pH 7.4. Postfixation and staining was performed with 0.5% OsO4 and 2% uranyl acetate after the first fixation method, and 1% OsO4 and 1% uranyl acetate after the second. Samples were dehydrated using ethanol and embedded in hydroxypropyl methacrylate plus Epon-812 resin (1:1). Thin sections (70–150 nm) were counterstained with lead citrate and examined using a Philips CM 120 BioTwin transmission electron microscope.
Tilt series from 210-nm-thick sections from Epon-embedded cells were recorded on the Philips CM120 electron microscope at 27,500× magnification on a TVIPS 2k × 2k slow-scan CCD camera in unbinned mode. Series were taken from −64.5° to 64.5° in intervals using a 3° Saxton scheme and were calculated using an Etomo package (http://bio3d.colorado.edu/). Distances of the vesicles to the plasma membrane and models were calculated using 3dmod software. Segmentation of the plasma membrane was performed using linetrack, wherein the vesicles represented only points, to visualize the distribution of the vesicle in the cluster. Analysis of mean and variance of vesicle distances to the release site (within ∼80 nm) showed no significant difference between neurons of identical genotypes treated with slightly differing fixatives [Stx1B+/+;Stx1A−/−: 13.50 nm (SD, 12.49 nm) vs 13.24 nm (SD, 10.13 nm); + k.d.: 16.76 nm (SD, 13.83 nm) vs 13.28 nm (SD, 9.72 nm);Stx1Byfp/yfp;Stx1A−/−: 18.41 nm (SD, 13.82 nm) vs 16.71 nm (SD, 10.05 nm); + k.d.: 19.38 nm (SD, 17.21 nm) vs 17.61 nm (SD, 10.90 nm)]. Therefore, datasets from the two experiments were pooled.
Results
A mouse line endogenously expressing a Stx1B–YFP fusion construct as a model for altered Stx1B expression levels
The study derived from an initial attempt to produce a knock-in mouse line expressing fluorescent protein-tagged Stx1B to study SNARE proteins using imaging approaches. The Stx1Byfp mouse line was generated by targeting a replacement cassette containing the Stx1B allele fused with EYFP cDNA at the 3′ end (Stx1Byfp) into the endogenous locus, via homologous recombination in ES cells (Fig. 1A; Materials and Methods). To prevent potential interference of EYFP with SNARE interactions within the synaptic terminal, the fusion protein was designed such that the fluorescent molecule is extracellular and connected to the C-terminal transmembrane domain of Stx1B via a linker sequence (Fig. 1B, top, wild-type Stx1B, bottom, Stx1B-YFP). Expression of the Stx1Byfp knock-in allele was verified by RT-PCR amplification of the open reading frame from Stx1B+/yfp mRNA (Fig. 1C) and sequencing. Interestingly, when Stx1B-YFP levels were quantified by immunoblotting of brain lysates, the ∼70 kDa fusion protein showed a significantly lower level of expression compared with wild-type Stx1B (Fig. 1D). It was not determined whether the expression of Stx1B-YFP is reduced at the transcriptional, translational, or post-translational level. Nevertheless, immunocytochemistry for extracellularly localized YFP was performed to determine whether the translated fusion protein was properly oriented in the plasma membrane or positioned in a manner that could interfere with function. YFP was detected at the surface of unpermeabilized Stx1Byfp/yfp neurons, while wild-type neurons expressing an intracellular fluorescent marker for lentiviral transduction showed little or no signal within the dynamic range (Fig. 1E). In addition, surface YFP shows a high degree of colocalization with Stx1B (Pearson's coefficient = 0.920; SD = 0.021). Together, these results indicate that endogenously expressed Stx1B-YFP is properly oriented in the membranes but is present in severely reduced amounts compared with wild type. The fusion protein can be detected in the hippocampi and cerebella of Stx1Byfp/yfp mice using antibodies against the fluorescent tag (Fig. 1F).

Hypomorphic expression of a Stx1Byfp fusion knock-in allele. A, Cloning strategy for the Stx1Byfp fusion allele. Double asterisks denote a modified exon 7 described in Gerber et. al. (2008). B, Diagrams depicting the orientations of plasma membrane-anchored wild-type (top) and EYFP-fused Stx1B (bottom). C, RT-PCR amplification of a full ∼1.6 kb transcript encoded by the Stx1Byfp allele from Stx1B+/yfp mRNA. D, Immunoblot showing severely reduced levels of Stx1B–YFP in Stx1Byfp/yfp;Stx1A−/− embryonic brain lysates compared with lysates from control littermates. β-tubulin was used as a loading control. E, Immunofluorescent staining of hippocampal mass cultures for extracellularly localized YFP. Stx1Byfp/yfp, but not wild-type controls transduced with intracellular fluorescent protein, is positive for surface expression of YFP. Scale bar, 10 μm. F, Peroxidase immunostaining of Stx1B–YFP fusion protein in sagittal sections of P14 hippocampus and cerebellum. Antibodies to synaptotagmin 1 (Syn1) and Rab3A were used as positive controls, while PBS corresponds to negative control. DG, Dentate gyrus; MF, hippocampal mossy fiber synapse. G, Immunoblot showing expression levels of SNARE proteins, Munc18-1, and other synaptic proteins in wild-type, Stx1Byfp/yfp, and Stx1A−/− P14 mice. Valosin-containing protein (VCP) was used as a loading control. Asterisks mark proteins with significant changes in expression levels.
We then determined the expression profile of Stx1Byfp/yfp mice for other synaptic proteins. Levels of Syb2, SNAP25, tomosyn, complexin 1 (Cplx-A), synapsin 1 (Syn1), NSF protein, rabphilin (Rph), Rab3A, synaptophysin 1 (Syp1), synaptotagmin 1 (Syt1), Rim1A, ELKS, liprin, and synaptojanin 1 (Synj1) were not significantly different in Stx1Byfp/yfp compared with wild-type controls (Fig. 1G; Table 1). However, there was a ∼25% decrease in Munc18-1 expression in Stx1Byfp/yfp lysates, which was not observed in Stx1A−/− mice, indicating that Stx1B stabilizes Munc18-1. This is not an unexpected finding, as it is consistent with the well known physical and functional interactions between the syntaxin and Sec1/Munc18 family of proteins (Rizo and Südhof, 2012).
Quantification of synaptic protein expression levels from immunoblots
Whole-cell voltage-clamp recordings from autaptic hippocampal neurons show that average peak amplitudes of EPSCs between wild-type (11.3 nA; SD, 9.7 nA; n = 38) and Stx1Byfp/yfp neurons (11.1 nA; SD, 10.6 nA; n = 36) are not significantly different (t(72) = 0.51, p = 0.61; data not shown). Short-term plasticity behavior was analyzed by high-frequency stimulation at 10 Hz for 5 s. Both wild-type and Stx1Byfp/yfp AP-evoked responses initially undergo facilitation, and then depression to reach steady-state, without significant differences in normalized amplitudes (data not shown). In addition to evoked responses, the RRP of fusion-competent vesicles was measured by rapid application of hyperosmotic solution (Materials and Methods; Rosenmund and Stevens, 1996). The RRP charges of wild-type neurons (1.84 nC; SD, 1.79 nC; n = 39) and Stx1Byfp/yfp neurons (2.09 nC; SD, 1.76 nC; n = 37) are not significantly different from each other (t(74) = 0.44, p = 0.66; data not shown). Taken collectively, these results indicate that although Stx1B expression is reduced in Stx1Byfp/yfp hippocampal neurons, neurotransmitter release is not significantly affected.
Although there are no significant changes in hippocampal neurotransmission in culture, and the gross morphology of newborn homozygous mice is similar to that of wild-type mice, juveniles eventually stopped gaining weight and died at 3 weeks (Fig. 2A,B). These results are in contrast to mice lacking the isoform Stx1A, which were generally healthy, had normal lifespans, and exhibited basal excitatory synaptic transmission similar to wild-type mice (Fujiwara et al., 2006; Gerber et al., 2008). We then tested functional redundancy between Stx1A and Stx1B by generating Stx1Byfp/yfp;Stx1A−/− double-mutant mice. In this case, lethality manifested at an even earlier time point compared with Stx1Byfp/yfp mice, as demonstrated by death of double homozygotes very shortly after birth (Fig. 2B). Examination of E18.5 embryos revealed gross morphological abnormalities such as smaller size, curved spine, and deformed head and neck structures compared with control littermates (Fig. 2C). Such developmental defects were similar to findings in other SNARE protein knockouts (Schoch et al., 2001; Washbourne et al., 2002). Meanwhile, heterozygote littermates (Stx1B+/yfp;Stx1A−/−) are physically indistinguishable from Stx1B+/+;Stx1A−/− controls, are fertile at the normal breeding age, and have normal lifespans. Though a full Stx1A−/−;Stx1B−/− double knockout is necessary for verification, these findings demonstrate that mammalian Stx1A and Stx1B are functionally redundant during embryonic development. On the other hand, wild-type Stx1B is essential and sufficient for postnatal survival.

Stx1Byfp/yfp;Stx1A−/− double mutants show premature lethality, gross morphological defects, and diminished Ca2+-evoked and spontaneous release. A, Weight curves for the Stx1Byfp mouse line. Stx1A+/+;Stx1Byfp/yfp and StxA+/−; Stx1Byfp/yfp show impaired growth and development before death at 3 weeks. B, Survival curves for the Stx1Byfp mouse line. Stx1A+/+;Stx1Byfp/yfp and Stx1A+/−;Stx1Byfp/yfp die postnatally after 3 weeks. Stx1A−/−;Stx1Byfp/yfp are not shown because they die at birth. C, Gross morphological abnormalities in Stx1Byfp/yfp;Stx1A−/− embryos compared with Stx1B+/yfp;Stx1A−/− and Stx1B+/+;Stx1A−/− littermates at E18.5. D, Sample traces of EPSCs from Stx1B+/+;Stx1A−/− (black), Stx1B+/yfp;Stx1A−/− (blue), and Stx1Byfp/yfp;Stx1A−/− (red) autaptic neurons. E, Normalized summary plot of EPSC peak amplitudes (***p < 0.0001). F, Normalized summary plot of EPSC rise times (***p < 0.0001). G, Sample traces of mEPSCs recorded at −70 mV from Stx1B+/+;Stx1A−/− (black) and Stx1Byfp/yfp;Stx1A−/− (red) neurons. H, Normalized summary plot of mEPSC frequency (***p < 0.0001).
Reduced Stx1 expression diminished AP-evoked and spontaneous neurotransmitter release
We then used the reduced expression of the Stx1B-YFP protein (Fig. 1D) as an opportunity to study synaptic properties and neurotransmitter release efficiency under hypomorphic conditions. In doing so, we aimed to circumvent a complete block of neurotransmitter release associated with the complete loss of SNARE protein.
While synaptic transmission in Stx1Byfp/yfp neurons was not perturbed, neurotransmitter release in Stx1Byfp/yfp;Stx1A−/− neurons showed severe impairments. EPSC amplitude was dramatically decreased by ∼80% in Stx1Byfp/yfp;Stx1A−/− neurons (0.49 nA; SD, 1.5 nA; n = 69) compared with controls (3.7 nA; SD, 6.3 nA; n = 83; F(2,180) = 48, p < 0.0001; Fig. 2D,E), and EPSC rise times were longer by ∼30% (Stx1B+/+;Stx1A−/− controls: 1.9 s; SD, 0.59 s; Stx1B+/yfp;Stx1A−/−: 1.6 s; SD, 0.38 s; Stx1Byfp/yfp;Stx1A−/−: 2.5 s; SD, 0.88 s; F(2,109) = 15.03, p < 0.0001; Fig. 2F), strongly indicating impairments in evoked release efficiency. In addition, miniature EPSC frequency was severely reduced by ∼70% in Stx1Byfp/yfp;Stx1A−/− double mutants (0.64 s−1; SD, 0.43 s−1; n = 66), compared with Stx1B+/+;Stx1A−/− controls (3.7 s−1; SD, 3.8 s−1; n = 60; t(124) = 6.5, p < 0.0001; Fig. 2G,H). The mean amplitude and charge of mEPSC events are slightly reduced (Stx1B+/+;Stx1A−/−: 29.9 pA; SD, 9.5 pA; n = 59; and 110 fC; SD, 37.1 fC; n = 59; Stx1Byfp/yfp;Stx1A−/−: 24.2 pA; SD, 9.4 pA; n = 65; and 92.7 fC; SD, 50.0 fC; n = 65; t(122) = 2.7, p = 0.0070 and t(122) = 2.3, p = 0.026, data not shown). Evoked release in Stx1B+/yfp;Stx1A−/− neurons (3.3 nA; SD, 7.5 nA; n = 31) is not significantly different from controls (Fig. 2D,E). These results suggest that AP-evoked and spontaneous forms of neurotransmitter release are sensitive to levels of Stx1; one wild-type copy of Stx1 is sufficient to achieve normal levels of neurotransmitter release, but levels of Stx1 below a certain threshold begin to cause impairments.
Stx1-deficient neurons have a smaller readily releasable pool
The availability of fusion-competent vesicles is a key determinant of neurotransmitter release. To determine whether reduced Stx1B levels change RRP characteristics, we measured the size and refilling speed of vesicles that are available for fusion in Stx1Byfp/yfp;Stx1A−/− neurons, independent of external calcium concentrations. Stx1Byfp/yfp;Stx1A−/− neurons (0.30 nC; SD, 0.38 nC; n = 70) showed a ∼65% reduction in RRP charge compared with Stx1B+/+;Stx1A−/− controls (1.07 nC; SD, 1.24 nC; n = 85), while Stx1B+/yfp;Stx1A−/− showed no significant changes (1.39 nC; SD, 0.89 nC; n = 32; F(2,186) = 28, p < 0.0001; Fig. 3A,B). To determine the calcium-independent refilling rate of the RRP, a paired sucrose assay was performed. In this experiment, neurons were treated with two consecutive applications of hypertonic solution at increasing time intervals to measure the fraction of the RRP refilled after a given period. Data were fitted into a single exponential equation to derive time constants (τ), which were used to evaluate refilling rates. The average τ for refilling in Stx1Byfp/yfp;Stx1A−/− mutants was 4.1 s, while τ for Stx1B+/+;Stx1A−/− controls was 1.5 s. The rate of RRP refilling in Stx1 hypomorphs is therefore significantly slower by ∼63% compared with controls (two-way ANOVA, F(2,143) = 4.68, p = 0.01; Fig. 3C,D). Taken collectively, these results indicate that Stx1 is a critical factor for vesicle priming.

Stx1Byfp/yfp;Stx1A−/− double mutants have a smaller RRP of vesicles and slower RRP refilling rate. A, Sample traces of release induced by hyperosmotic stimulation from Stx1B+/+;Stx1A−/− (black), Stx1B+/yfp;Stx1A−/− (blue), and Stx1Byfp/yfp;Stx1A−/− (red) autaptic neurons. B, Normalized summary plot of RRP charge (***p < 0.0001). C, Refilling of the RRP as measured by paired applications of 0.5 m sucrose in Stx1B+/+;Stx1A−/− (black) and Stx1Byfp/yfp;Stx1A−/− (red). D, Fraction of the RRP refilled 2, 5, and 10 s after the first hyperosmotic stimulus (**p < 0.001).
Stx1 expression levels are critical for vesicle fusogenicity
We then asked whether vesicles from the readily releasable pool of Stx1Byfp/yfp;Stx1A−/− neurons fuse as efficiently as vesicles from Stx1B+/+;Stx1A−/− controls and addressed this question in several ways. First, we measured the overall efficiency of AP-evoked release by a Ca2+ dose–response assay and measurement of vesicular release probability. Ca2+ dose–response assay was performed by recording EPSCs at different calcium concentrations (Fig. 4A). To control for rundown and cell-to-cell variability, test responses were normalized to average EPSCs in base external solution that were recorded before and after treatment. Normalized test responses were then normalized to the response at 12 mm Ca2+ (maximum concentration). In addition, EPSCs were measured in both ascending and descending orders of calcium concentration from an equal number of cells. The normalized values were fitted into a standard Hill equation to plot dose–response curves (Fig. 4B). The Stx1Byfp/yfp;Stx1A−/− dose–response curve is shifted markedly toward higher Ca2+ concentrations [0.5 mm: 0.10 nA (SD, 0.15 nA), n = 25; 2 mm: 1.1 nA (SD, 1.3 nA), n = 25; 4 mm: 1.4 nA (SD, 1.5 nA), n = 26; 12 mm: 1.6 nA (SD, 1.3 nA), n = 26] relative to Stx1B+/+;Stx1A−/− controls [0.5 mm: 0.61 nA (SD, 0.82 nA), n = 31; 2 mm: 3.2 nA (SD, 3.6 nA), n = 29; 4 mm: 3.9 nA (SD, 4.1 nA), n = 27; 12 mm: 5.18 nA (SD, 5.4 nA), n = 29; F test, F(3,166) = 8.3, p < 0.0001; Fig. 4B]. The apparent k.d. was significantly increased by ∼50% in Stx1Byfp/yfp;Stx1A−/− neurons (2.3 mm; SD, 0.15 mm; n = 20) compared with controls (1.6 mm; SD, 0.13 mm; n = 23; t(166) = 3.9, p = 0.0002), while the Hill coefficient (n) was not affected [2.6 (SD, 0.48) vs 2.4 (SD, 0.47); t(166) = 0.30; p = 0.76]. Together, these data indicate reduced apparent sensitivity to extracellular Ca2+ in Stx1Byfp/yfp;Stx1A−/− neurons.

Vesicle fusogenicity is impaired in Stx1Byfp/yfp;Stx1A−/− neurons. A, Sample traces of evoked responses from Stx1B+/+;Stx1A−/− (black) and Stx1Byfp/yfp;Stx1A−/− (red) neurons at different external Ca2+ concentrations. B, Ca2+ dose–response curves for Stx1B+/+;Stx1A−/− (black) and Stx1Byfp/yfp;Stx1A−/− (red) neurons. C, Normalized summary plot of Pvr, measured as the ratio of the EPSC charge and RRP charge, in Stx1B+/+;Stx1A−/− (black), Stx1B+/yfp;Stx1A−/− (blue), and Stx1Byfp/yfp;Stx1A−/− (red) neurons (***p < 0.0001). D, Short-term plasticity behavior during 10 Hz stimulation. E, Sample traces of release induced by different (hyperosmotic) sucrose concentrations. F, Dose–response curves from hypertonic sucrose stimulation. G, Spontaneous release rate, calculated as the fraction of the RRP released spontaneously per second (*p < 0.05).
Pvr is another measure of release efficiency. It is the average likelihood that a fusion-competent vesicle will be released due to an action potential. We calculated Pvr as the ratio between the charge of the evoked release and the RRP charge. In Stx1B+/+;Stx1A−/− control neurons, this probability is 5.3% (SD, 3.9%). Heterozygotes have a Pvr of 5.3% (SD, 3.5%), while Stx1Byfp/yfp;Stx1A−/− neurons have a Pvr of only 1.9% (SD, 2.6%). The ∼60% decrease in Pvr (F(2,181) = 27.1, p = 0.012; Fig. 4C) indicates impaired release efficiency upon severe reduction in Stx1 levels. We then determined short-term plasticity behavior to verify the observed changes in Pvr. During high-frequency stimulation, neurons with “high” release probability generally exhibit depression, while those with “low” release probability show facilitation. Consistent with this phenomenon, control neurons consistently showed depression during a 10 Hz train of action potentials, while Stx1Byfp/yfp;Stx1A−/− neurons displayed strong facilitation (Fig. 4D). In summary, decreased apparent Ca2+ sensitivity and lower Pvr in Stx1Byfp/yfp;Stx1A−/− neurons indicate that a reduction in Stx1 expression significantly decreases vesicle fusion efficiency.
AP-evoked release can be considered a product of several factors, namely calcium influx into the terminals and excitation–secretion coupling, which in turn can be affected by the efficiency of the calcium-sensing apparatus and the intrinsic vesicular fusogenicity. Therefore, although Ca2+ dose–response curves are conventionally used to evaluate putative changes in the Ca2+-sensing apparatus, the contribution of the intrinsic fusion machinery in regulating release efficiency is equally a rate-limiting factor for apparent sensitivity to calcium. This has been demonstrated by the roles of Stx1 conformation and Complexin on regulating fusion kinetics (Gerber et al., 2008; Xue et al., 2010). We then tested for Ca2+-independent vesicular fusogenicity, which can be probed by assessing release as a function of hypertonicity. Briefly, neurons were stimulated with different concentrations of sucrose to gradually increase hypertonicity, and then the charge released under each concentration (Fig. 4E) was normalized to the release at maximum concentration (1.0 m sucrose) and plotted as a sigmoidal dose–response curve. The k.d. of Stx1Byfp/yfp;Stx1A−/− neurons (0.36 m; SD, 0.0065 m; n = 31) is ∼20% higher compared with k.d. of Stx1B+/+;Stx1A−/− controls (0.30 m; SD, 0.0064 m; n = 33), indicating that they have a lower sensitivity to hyperosmotic stimulation (F test, F(2,339) = 9.4, p < 0.0001; Fig. 4F). Overall, these data suggest a decreased vesicular fusogenicity of Stx1Byfp/yfp;Stx1A−/− neurons.
Vesicle fusogenicity in the absence of Ca2+-triggered release can also be assessed by measuring spontaneous release rate. Spontaneous release rate was calculated by dividing mEPSC frequency (Fig. 2H) by the number of vesicles in the RRP (RRP charge over mean mEPSC charge). Conceptually, this determines the fraction of the RRP released spontaneously per second. Stx1Byfp/yfp;Stx1A−/− neurons have a 42% lower spontaneous release rate (0.00034 s−1; SD, 0.00032 s−1; n = 51) compared with controls (0.00059 s−1; SD, 0.00068 s−1; n = 50) consistent with a decreased vesicular fusogenicity (t(99) = 2.342, p = 0.0212; Fig. 4G).
Taken collectively, our results suggest that Stx1 deficiency impairs neurotransmitter release efficiency by decreasing vesicular release probability, mainly through a lowered vesicle fusogenicity.
Changes in presynaptic calcium influx do not account for changes in synaptic release
Another possible explanation for the reduced calcium sensitivity in Stx1Byfp/yfp;Stx1A−/− neurons was reduced AP-evoked Ca2+ influx through voltage-gated calcium channels. To test this hypothesis, we performed imaging experiments on genetically encoded Ca2+ indicator fused to synaptophysin, SynGCaMP2, which has been used previously to show relative changes in presynaptic Ca2+ influx between conditions (Zhao et al., 2011). We found that induction of APs in Stx1Byfp/yfp;Stx1A−/− neurons expressing SynGCaMP2 resulted in a clear increase in fluorescence (Fig. 5A). To compare Ca2+ influx between genotypes, regardless of SynGCaMP2 expression level, we compared the average ΔF normalized to F0 (Fig. 5B,C). Overall, two-way ANOVA analysis showed no effect of genotype on the AP-evoked SynGCaMP2 signals (Fig. 5C). It should be noted, however, that the Bonferroni post-test reported a significant difference (*p < 0.05) at 10 APs between Stx1B+/+;Stx1A−/− and Stx1Byfp/yfp;Stx1A−/− neurons, but not between any other stimulus number or genotype combination. Though the slopes of the linear regression fits differed significantly between the three groups [*p = 0.03; Stx1Byfp/yfp;Stx1A−/− slope = 0.0486 (SE, 0.0023); Stx1B+/+;Stx1A−/− slope = 0.0570 (SE, 0.0015); Stx1B+/yfp;Stx1A−/− slope = 0.0524 (SE 0.0002)], we do not believe this difference could account for the reduction of EPSC amplitude (Fig. 5D) or the increase in paired-pulse ratio (Fig. 5E) in Stx1Byfp/yfp;Stx1A−/− neurons compared with Stx1B+/+;Stx1A−/− or Stx1B+/yfp;Stx1A−/− neurons.

Presynaptic Ca2+ influx is not altered in Stx1Byfp/yfp;Stx1A−/− neurons. A, Example baseline fluorescence (left; average of three images; F0) and peak 5 AP fluorescence (right; average two images; ΔF) for an Stx1Byfp/yfp;Stx1A−/− autaptic neuron. B, Average ΔF/F0 for ROIs selected from neuron shown in A (n = 41) in response to 2, 3, and 5 AP at 20 Hz. Arrow indicates initiation of stimulation. C, Average ΔF/F0 responses per cell for Stx1Byfp/yfp;Stx1A−/− (red; n = 35 cells) and control (black; Stx1B+/+;Stx1A−/− and Stx1B+/yfp;Stx1A−/− pooled; n = 33) for 2, 3, 5, and 10 AP at 20 Hz. D, E, Data were fitted with a linear regression analysis (red and black lines, respectively). Average paired-pulse ratio (D; 50 ms interstimulus interval; ***p < 0.0001) and EPSC amplitude (E; ***p < 0.0001) for Stx1Byfp/yfp;Stx1A−/− and control cells from C. All error bars represent SEM.
Knockdown of Stx1B-YFP enhanced the reduction in release efficiency
If Stx1 expression levels modulate the readily releasable pool and fusion efficiency, then we expect an enhancement of the Stx1Byfp/yfp;Stx1A−/− phenotype upon further reduction of Stx1Byfp expression. To test this hypothesis, an shRNA construct that reduces the expression of both wild-type Stx1B and Stx1B-YFP fusion proteins was expressed in Stx1Byfp/yfp;Stx1A−/− via lentivirus vector. Transduction of the shRNA construct in neuronal mass cultures reduces levels of both Stx1B (36% reduction compared with untransduced Stx1B+/+;Stx1A−/− neurons; F(2,5) = 12.42, p = 0.0115) and Stx1B-YFP expression (62% reduction compared with untransduced Stx1Byfp/yfp;Stx1A−/− neurons; F(2,5) = 21.86, p = 0.0034), but not that of Stx1A (11% reduction compared with untransduced Stx1B+/+;Stx1A−/− neurons; F(2,5) = 0.1008, p = 0.8990), demonstrating the specificity of the knockdown (Fig. 6A).

Knockdown of Stx1B–YFP further impaired release efficiency. A, Immunoblot showing knockdown of both Stx1B (in wild-type background), and Stx1B–YFP fusion protein (in Stx1Byfp/yfp;Stx1A−/− background), but not Stx1A, using a Stx1B sequence-specific shRNA. B, Sample traces of EPSCs from Stx1B+/+;Stx1A−/− (black), Stx1Byfp/yfp;Stx1A−/− untransduced (red), transduced with lentiviral vector only (Lois et al., 2002), and transduced with knock-down construct (purple). C, Sample traces of RRP released by hyperosmotic stimulation. D, Normalized summary plot of EPSC amplitudes (***p < 0.0001). E, Normalized summary plot of RRP charge (*p < 0.05, ***p < 0.001). F, Normalized summary plot of vesicular release probability. G, Short-term plasticity behavior during 10 Hz stimulation.
Reduction of Stx1B-YFP expression by knockdown (k.d.) dramatically decreased the evoked responses of Stx1Byfp/yfp;Stx1A−/− neurons by ∼80% (0.12 nA; SD, 0.20 nA; n = 32) compared with untransduced (0.82 nA; SD 1.2 nA; n = 32) or vector-transduced neurons (0.53 nA; SD, 0.66 nA; n = 27; F(3,116) = 72.42, p < 0.0001; Fig. 6B,D). RRP size was reduced to a similar degree by ∼80% (Stx1B+/+;Stx1A−/−: 899.0 pC; SD, 974 pC; n = 28; Stx1Byfp/yfp;Stx1A−/−: 300.5 pC; SD, 239 pC; n = 27; Stx1Byfp/yfp;Stx1A−/− + vector: 357.8 pC; SD, 358 pC; n = 27; Stx1Byfp/yfp;Stx1A−/− + k.d.: 79.2 pC; SD, 135 pC; n = 32; F(3,109) = 24.23, p < 0.0001; Fig. 6C,E). Interestingly, Stx1Byfp/yfp;Stx1A−/− neurons transduced with the knock-down construct did not lead to further significant changes in Pvr compared with the untransduced hypomorphs (Stx1B+/+;Stx1A−/−: 5.3%; SD, 6.7%; n = 28; Stx1Byfp/yfp;Stx1A−/−: 1.4%; SD, 2.3%; n = 32; Stx1Byfp/yfp;Stx1A−/− + vector: 1.7%; SD, 2.7%; n = 27; Stx1Byfp/yfp;Stx1A−/− + k.d.: 0.96%; SD, 1.8%; n = 36; F(3,110) = 25.76, p < 0.0001; Fig. 6F). Consistent with Pvr results, shRNA-transduced Stx1Byfp/yfp;Stx1A−/− neurons facilitated to a similar degree as untransduced or vector-transduced neurons (Fig. 6G). In summary, knockdown of Stx1B-YFP expression, in a genetic background with already reduced Stx1 expression, further diminishes evoked release and RRP, without significantly affecting Pvr.
Knockdown of wild-type Stx1B mimicked hypomorphic effects
We analyzed neurotransmitter release in Stx1B+/+;Stx1A−/− neurons transduced with Stx1B-specific shRNA as an alternative approach to analyzing Stx1Byfp/yfp;Stx1A−/− neurons. Stx1A−/− neurons transduced with the knock-down construct showed an ∼70% reduction in evoked release compared with untransduced and vector-transduced controls (Stx1B+/+;Stx1A−/−: 3.0 nA; SD, 2.6 nA; n = 39; Stx1B+/+;Stx1A−/− + vector: 2.8 nA; SD, 3.3 nA; n = 37; Stx1B+/+;Stx1A−/− + k.d.: 1.1 nA; SD, 1.9 nA; n = 41; F(2,114) = 10.8, p < 0.0001; Fig. 7A,B). In addition, the RRP was reduced by ∼60% (Stx1B+/+;Stx1A−/−: 323.1 pC, SD 315.5, n = 39; Stx1B+/+;Stx1A−/− + vector: 333.8 pC, SD 399.4, n = 37; Stx1B+/+;Stx1A−/− + k.d.: 101.7 pC; SD, 165.8 pC; n = 42; F(2,115) = 9.8, p < 0.0001; Fig. 7C,D), Pvr is lower by ∼50% (Stx1B+/+;Stx1A−/−: 6.2%; SD, 4.1%; n = 39; Stx1B+/+;Stx1A−/− + vector: 5.8%; SD, 6.0%; n = 38; Stx1B+/+;Stx1A−/− + k.d.: 5.1%; SD, 3.9%; n = 39; F(2,113) = 4.5, p < 0.05; Fig. 7E), and facilitation occurred upon high-frequency stimulation (Fig. 7F). These results were analogous to Stx1Byfp/yfp;Stx1A−/− phenotypes, suggesting that low expression levels, rather than the presence of the YFP domain in Stx1Byfp knock-in mice, led to reduced release efficiency.

Knockdown of wild-type Stx1B phenocopied Stx1Byfp/yfp;Stx1A−/− hypomorphs. A, Sample traces of EPSCs from Stx1B+/+;Stx1A−/− neurons untransduced (black), transduced with lentiviral vector only (blue), or transduced with a Stx1B sequence-specific shRNA (green). B, Normalized summary plot of EPSC amplitudes (***p < 0.0001). C, Sample traces of RRP released by hyperosmotic stimulation. D, Normalized summary plot of RRP charge (***p < 0.0001). E, Normalized summary plot of vesicular release probability (**p < 0.001). F, Short-term plasticity behavior during 10 Hz stimulation. G, Sample images of autaptic neurons double labeled with the synaptic marker VGluT1 and the dendritic marker MAP2. Scale bar, 10 μm. H, Summary plot of synaptic vesicle density measured as VGluT1 puncta per 100 μm of dendrite length.
We quantified synaptic density to determine whether there were impairments in central synapse number and distribution upon Stx1 reduction. To ensure that all autaptic neurons analyzed were excitatory, vesicular glutamate transporter 1 (VGluT1) was used as a synaptic marker. The number of VGluT1 puncta over dendritic length, which was measured using the staining pattern of antibodies against microtubule-associated protein 2 (MAP2), was used as an indicator of synaptic density (Chao et al., 2007). The number of puncta per 100 μm dendrite length was comparable between transduced and untransduced Stx1A−/− neurons (Stx1B+/+;Stx1A−/−: 22/100 μm; SD, 6.9/100 μm; n = 12; Stx1B+/+;Stx1A−/− + vector: 21/100 μm; SD, 9.4/100 μm; n = 13; Stx1B+/+;Stx1A−/− + k.d.: 24/100 μm; SD, 9.2/100 μm; n = 14; F(2,37) = 0.3588, p = 0.7009; Fig. 7G,H). This suggests that defects in neurotransmission were not likely caused by defects in synaptic development, but rather by the release machinery itself.
Exogenous expression of either Stx1A or Stx1B, but not Munc18-1, is sufficient to rescue neurotransmitter release
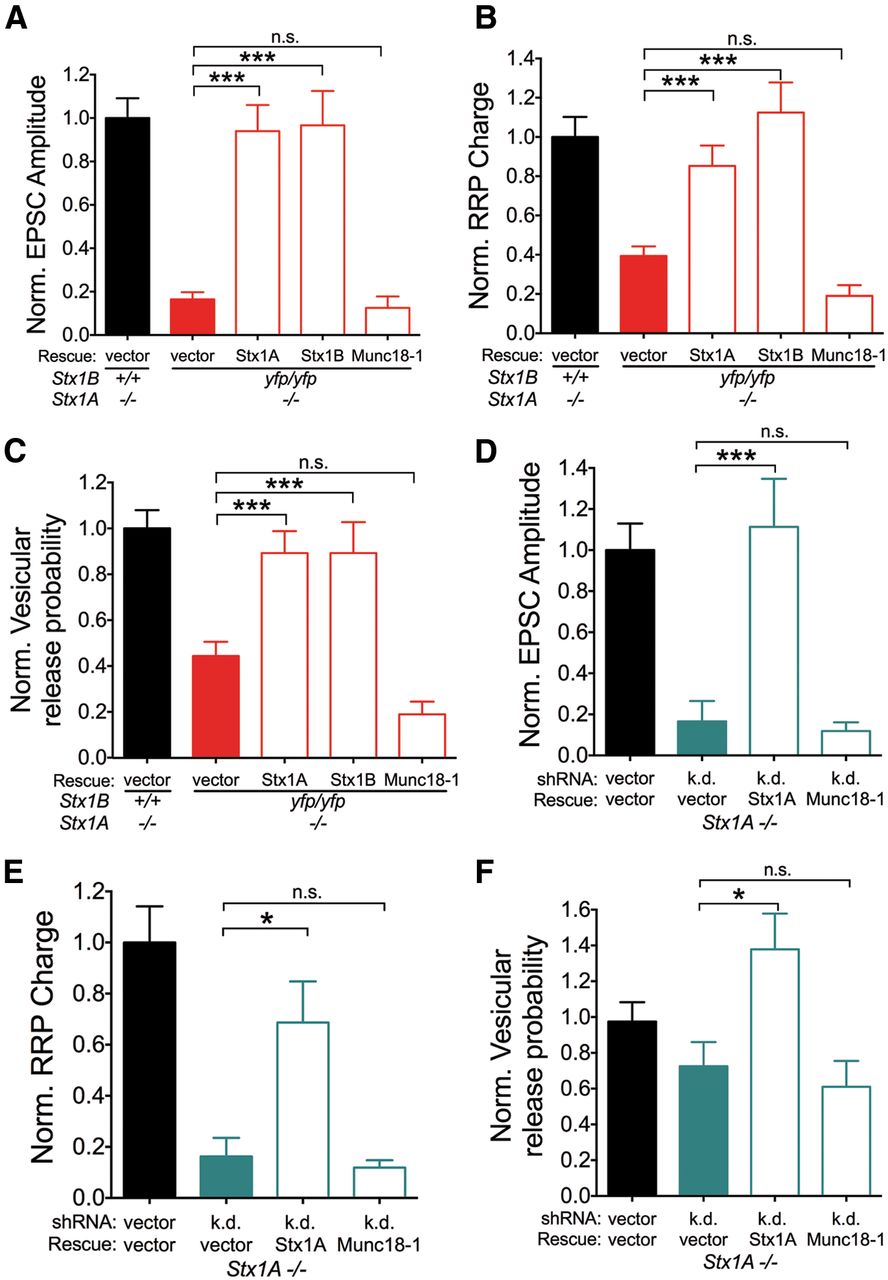
A decrease in Munc18-1 levels was observed in Stx1-deficient neurons (Fig. 1G). Given the important role of Munc18-1 in synaptic release and vesicle priming (Rizo and Südhof, 2012), this finding raises the possibility that the associated loss of Munc18-1 is the underlying reason for reduced evoked and spontaneous release, vesicle priming, and release probability. We therefore performed a rescue experiment by lentivirally expressing Stx1A, Stx1B, or Munc18-1 in Stx1Byfp/yfp;Stx1A−/− neurons, and Stx1A or Munc18-1 in Stx1A−/− neurons with a Stx1B-specific knock-down construct (Fig. 6A). Lentiviral expression of either Stx1 wild-type isoform restored EPSC amplitudes, RRP charges, and vesicular release probability to a degree comparable to Stx1B+/+;Stx1A−/− controls, while neurons transduced with Munc18-1 were not significantly different from Stx1Byfp/yfp;Stx1A−/− neurons (EPSC amplitudes: F(4,202) = 8.3, p < 0.0001; RRP Charges: F(4,210) = 10.1, p < 0.0001; Pvr: F(4,210) = 9.0, p < 0.0001; Fig. 8A–C), verifying that the expression of either Stx1A or Stx1B is sufficient for normal synaptic transmission in hippocampal neurons. In Stx1B+/+;Stx1A−/− neurons with knockdown, exogenous expression of Munc18-1 alone also did not rescue synaptic release, in contrast to expression of Stx1A (EPSC amplitudes: F(3,119) = 10.6, p < 0.0001; RRP charges: F(3,120) = 10.8, p < 0.0001; Pvr: F(3,116) = 4.8, p < 0.05; Fig. 8D–F). Together, our results demonstrate that increasing Munc18-1 expression alone does not bypass Stx1 deficiency and rescue impaired neurotransmitter release. In addition, restoring Stx1 expression is sufficient for synaptic function, indicating that the defects in release, vesicle priming, and release probability seen in Stx1-deficient neurons are directly related to the loss of the molecule.

Lentiviral expression of either Stx1A or Stx1B, but not Munc18-1, rescues synaptic release in neurons with severe reduction in Stx1 levels. A–C, Normalized summary plots of EPSC peak amplitudes (A), RRP charge (B), and vesicular release probability (C) in control Stx1Byfp/yfp;Stx1A−/− neurons (black), and Stx1Byfp/yfp;Stx1A−/− neurons transduced without (red) or with Stx1A, Stx1B, or Munc18-1 rescue constructs (red outlines; ANOVA with Tukey's test, ***p < 0.001; n.s., not significant). D–F, Normalized summary plots of EPSC peak amplitudes (D), RRP charge (E), and vesicular release probability (F) in Stx1A−/− neurons without (black) or with shRNA-mediated knockdown of Stx1B (teal), and knockdown neurons transduced with Stx1A, Stx1B, or Munc18-1 rescue constructs (teal outlines; ANOVA with Tukey's test, *p < 0.05, ***p < 0.001; n.s., not significant).
Synaptic vesicle distribution upon reduction of Stx1 expression
We observed severe impairments in functionally defined priming and release probability upon reduction of Stx1 expression, but an effect on vesicle docking is unclear. To analyze docking, we generated three-dimensional projections of synapses by tomography. Compared with conventional transmission electron microscopy (TEM), tomography increases the resolution in the z-axis to give a more precise representation of vesicle distribution from the plasma membrane. We assessed docking by measuring mean vesicle distance from the plasma membrane. Stx1B knockdown in Stx1B+/+;Stx1A−/− neurons did not cause significant changes in cumulative vesicle distribution compared with untransduced controls, while Stx1Byfp/yfp;Stx1A−/− neurons with or without knockdown showed a small but significant increase in the fraction of vesicles residing farther away from the membrane (Kolmogorov-Smirnov z test = 1.8, p=0.003 for both; Fig. 9A,B). Mean vesicle distance within a range of 40 nm from the plasma membrane is increased by ∼25% in Stx1Byfp/yfp;Stx1A−/− neurons with or without knockdown (Stx1B+/+;Stx1A−/−: 13.3 nm; SD, 9.4 nm; Stx1B+/+;Stx1A−/− + k.d.: 14.6 nm; SD, 9.6 nm; Stx1Byfp/yfp;Stx1A−/−: 16.7 nm; SD, 10.4 nm; Stx1Byfp/yfp;Stx1A−/− + k.d.: 16.5; SD, 10.1 nm; Kruskall-Wallis t test = 11.25, p = 0.011; Fig. 9C).

Vesicle distance from the active zone upon reduction of Stx1 expression. A, Sample tomographic images of presynaptic nerve terminals from Stx1B+/+;Stx1A−/− neurons and Stx1Byfp/yfp;Stx1A−/− neurons that were untransduced and transduced with a Stx1B sequence-specific shRNA. Scale bar, 100 nm. B, Cumulative distribution of vesicle distance from the plasma membrane. C, Summary plot of vesicle distance within 40 nm of the plasma membrane. *p < 0.05. D, Summary plot of presynaptic area. E, Summary plot of total number of synaptic vesicles per synapse. **p < 0.001. F, Summary plot of synaptic vesicle density (ANOVA with Tukey's test, **p < 0.001). G, Summary plot of active zone length.
We determined whether Stx1 levels were indeed significantly reduced in the samples analyzed by measuring total fluorescence intensity of Stx1B among the different groups. In this experiment, knockdown in Stx1B+/+;Stx1A−/− neurons resulted in a 56% reduction (SD, 26%), while Stx1Byfp/yfp;Stx1A−/− neurons with or without knockdown showed 76% (SD, 12%) and 67% (SD, 12%) reductions, respectively. The weaker reduction in Stx1B+/+;Stx1A−/− neurons with knockdown compared with Stx1Byfp/yfp;Stx1A−/− neurons could explain the lack of impairments in vesicle distribution in the former group. Overall, these data suggest that Stx1 is involved in docking, but levels have to be reduced by ∼70% to start observing changes in vesicle positions.
Meanwhile, changes in synaptic morphology were evaluated by conventional TEM. Presynaptic terminal size (Stx1B+/+;Stx1A−/−: 0.71 μm2; SD, 0.28 μm2; Stx1B+/+;Stx1A−/− + k.d.: 0.63 μm2; SD, 0.28 μm2; Stx1Byfp/yfp;Stx1A−/−: 0.59 μm2; SD, 0.36 μm2; Stx1Byfp/yfp;Stx1A−/− + k.d.: 0.66 μm2; SD, 0.66 μm2; Fig. 9D) and active zone length (Stx1B+/+;Stx1A−/−: 796 nm; SD, 321 nm; Stx1B+/+;Stx1A−/− + k.d.: 913 nm; SD, 385 nm; Stx1Byfp/yfp;Stx1A−/−: 955 nm; SD, 341 nm; Stx1Byfp/yfp;Stx1A−/− + k.d.: 956 nm; SD, 308 nm; Fig. 9G) were comparable among all four groups (F(3,116) = 0.92, p = 0.43; and F(3,116) = 1.5, p = 0.22, respectively; n = 30 synapses), indicating no changes in synaptic architecture upon reduction of Stx1 levels. The total number of synaptic vesicles and synaptic vesicle density were not significantly different in Stx1B+/+;Stx1A−/− transduced with the knock-down construct, while these were slightly decreased in Stx1Byfp/yfp;Stx1A−/− neurons with and without Stx1B knockdown (Stx1B+/+;Stx1A−/−: 124 vesicles; SD 60 vesicles; 88/0.5 μm2; SD, 20/0.5 μm2; Stx1B+/+;Stx1A−/− + k.d.: 104 vesicles; SD, 53 vesicles; 82/0.5 μm2; SD, 27/0.5 μm2; Stx1Byfp/yfp;Stx1A−/−: 78 vesicles; SD, 58 vesicles; and 66/0.5 μm2; SD, 22/0.5 μm2; Stx1Byfp/yfp;Stx1A−/− + k.d.: 82 vesicles; SD, 28 vesicles; 62/0.5 μm2; SD, 22/0.5 μm2; F(3,116) = 5.3, p = 0.0018 and F(3,116) = 7.3, p = 0.0001; Fig. 9E,F).
Priming and release probability as a function of Stx1 expression levels
Different mechanisms can explain the regulation of release by Stx1, including clustering of Stx1 molecules in large copy numbers around release sites (Barg et al., 2010; Knowles et al., 2010) and formation of Stx1:SNAP25 heterodimers that serve as acceptor complexes for Syb2 (Fasshauer and Margittai, 2004; Weninger et al., 2008). Since we have means to vary levels of Stx1 over a range of concentrations that differentially affect vesicle priming and fusion efficiency, we used this as an opportunity to gain insights into the underlying process by performing quantitative analysis of function versus SNARE protein concentration. First, quantitative immunocytochemistry of Stx1 at synapses was performed, as it allowed us to determine the concentration directly at the site of release and provided us with built-in normalization procedures by costaining for a synaptic protein that is similarly anchored to the plasma membrane. Autaptic neurons were double labeled with antibodies against Stx1B and the active zone marker Bassoon (tom Dieck et al., 1998). Stx1B is expressed abundantly and has a patchy staining pattern throughout the neuron, while Bassoon has a punctate staining pattern that marks release sites (Fig. 10C). Stx1B expression levels were measured as fluorescence intensity only in regions marked by Bassoon and then were normalized to the intensity levels of the marker. There were no significant differences in mean fluorescence intensity of Bassoon among the groups (Stx1B+/+;Stx1A−/− fluorescence: 1647 units; SD, 288.4; Stx1B+/yfp;Stx1A−/− fluorescence: 2980 units; SD, 577.9; Stx1B+/+;Stx1A−/− + k.d. fluorescence: 1791 units; SD, 203.9; Stx1Byfp/yfp;Stx1A−/− fluorescence: 2244 units; SD, 300.3; Stx1Byfp/yfp;Stx1A−/− + k.d. fluorescence: 2972 units; SD, 450.5; F(5,55) = 1.538, p = 0.2056; Fig. 10B). Hypomorphic expression of Stx1B, combined with knockdown of either wild-type Stx1 or Stx1B-YFP, resulted in graded reductions in Stx1 expression (Stx1B+/+;Stx1A−/− fluorescence: 376.7; SD, 83.36; Stx1B+/yfp;Stx1A−/− fluorescence: 288.6; SD, 38.75; Stx1B+/+;Stx1A−/− + k.d. fluorescence: 77.89; SD, 17.73; Stx1Byfp/yfp;Stx1A−/− fluorescence: 135.3; SD, 27.13; Stx1Byfp/yfp;Stx1A−/− + k.d. fluorescence: 84.82; SD, 22.68; F(5,56) = 8.737, p < 0.0001; Fig. 10A). To account for trial-to-trial variability, fluorescence intensities were normalized to the mean fluorescence intensities of Stx1B+/+;Stx1A−/− neurons per culture. Normalized Stx1B/Bassoon ratios were then calculated for a more precise quantification of the graded reductions (Stx1B+/+;Stx1A−/− with knock-down ratio: 0.16; SD, 0.16; Stx1Byfp/yfp;Stx1A−/− ratio: 0.15; SD, 0.11; Stx1Byfp/yfp;Stx1A−/− with knock-down ratio: 0.09; SD, 0.07; with respect to Stx1B+/+;Stx1A−/− controls; F(4,51) = 11.3, p < 0.0001; Fig. 10D).

Priming and release probability as a function of Stx1 expression levels. A, Normalized summary plot of Stx1B fluorescence intensities. ***p < 0.0001. B, Normalized summary plot of Bassoon fluorescence intensities. C, Sample images from double labeling of autaptic neurons with anti-Stx1B and anti-Bassoon antibodies. Scale bar, 5 μm. D, Summary plot of Stx1B/Bassoon fluorescence intensity ratios measured within regions marked by Bassoon. E, F, Readily releasable pool size (E) and vesicular release probability (F), derived from previously shown data, were plotted as a function of normalized Stx1B expression levels (Stx1B+/+;Stx1A−/−, black; Stx1B+/yfp;Stx1A−/−, blue; Stx1B+/+;Stx1A−/− + k.d., teal; Stx1Byfp/yfp;Stx1A−/−, red; Stx1Byfp/yfp;Stx1A−/− + k.d., purple).
To measure how RRP size and Pvr change with increasing Stx1 levels, previously calculated values from different experimental groups were then normalized and plotted as a function of Stx1B expression (Fig. 10E,F) and were fitted with the standard Hill equation (see Materials and Methods). The mean k.d. for syntaxin was similar for priming and Pvr, with values 0.19-fold and 0.18-fold of wild-type expression, respectively. In addition, the Hill coefficient or cooperativity was 3.4 for RRP size and 2.5 for Pvr.
At expression levels between 10% and 50% of wild type, small changes in Stx1 concentration lead to steep changes in RRP size and Pvr (Fig. 10E,F). These data suggest that at very low concentrations, Stx1 is a rate-limiting factor for priming and release efficiency. In addition, our estimates suggest that the Stx1 “cooperative unit” for both RRP size and vesicular release probability is ∼3, implying that priming and vesicle fusion have the same molecular stoichiometry.
Discussion
Although the function of SNARE proteins in membrane fusion has been well characterized, their roles at distinct steps of the synaptic vesicle cycle, such as docking and priming, are poorly understood. Our main objective was to investigate how manipulation of SNARE protein expression levels affect docking, priming, and release probability. We used a unique experimental approach that diminishes neurotransmitter release by controlled genetic reduction of Stx1 expression in mammalian central synapses. Two methods were used, either individually or in combination, to reduce Stx1 gene expression in hippocampal neurons in a graded fashion. First, we took advantage of a Stx1Byfp knock-in mouse line that expresses an Stx1B–YFP fusion protein in a hypomorphic fashion. Second, we used RNAi-mediated knockdown to reduce wild-type Stx1 and Stx1–YFP expression levels. This complementary approach offers two advantages: a means to check for artifacts, and multiple data points for analyzing the relationship between reduction of Stx1 expression and neurotransmitter release.
Our results lead us to several conclusions. First, due to the observation that a severe reduction in Stx1B expression alone leads to juvenile lethality in mice, we conclude that mammalian Stx1B, in contrast to Stx1A, has an essential role in postnatal development. Both Stx1 isoforms are coexpressed abundantly throughout the adult rodent nervous system, though there is evidence of differential distribution and enrichment of one isoform over the other in certain regions (Ruiz-Montasell et al., 1996; Aguado et al., 1999). Since behavioral analysis was not performed, we are not able to comprehensively determine which specific neuronal populations are dysfunctional in Stx1Byfp/yfp mice.
The possibility that the Stx1B–YFP fusion protein has a neomorphic effect is not likely for several reasons. First, the YFP tag is localized extracellularly, indicating that the fluorophore is not in a position to sterically hinder SNARE function. Second, the Stx1B–YFP allele does not have apparent dominant-negative effects, as indicated by the lack of significant changes in evoked release amplitudes, spontaneous release frequency, RRP size, and Pvr of Stx1B+/yfp;Stx1A−/− neurons compared with controls and Stx1Byfp/yfp;Stx1A+/+ neurons compared with wild type. Third, Stx1 knock-down phenotypes lead to similar decreases in EPSC amplitude, RRP size, and Pvr, providing complementary evidence that severe reductions in Stx1 levels impair release efficiency.
Severe reductions in total Stx1 expression are needed to impair neurotransmitter release in central synapses. First, reduction of Stx1B levels alone does not impair neurotransmission. Only in the absence of Stx1A expression does the reduction of Stx1B in hippocampal neurons (either by knockdown or hypomorphic expression of Stx1B in hippocampal neurons) diminish evoked and spontaneous forms of release. Also, Stx1B+/yfp;Stx1A−/− heterozygotes do not show any significant changes in neurotransmitter release, supporting the notion that expressing Stx1B at levels below ∼50% of wild type are needed to induce a decline in priming and Pvr.
Previous studies on reduced levels of SNARE or SNARE-associated proteins have shown sensitivity similar to those in our findings. On the mRNA level, reduction of SNAP25 of >85% does not produce a measurable change in synaptic transmission in cultured neurons (Sharma et al., 2011). Analyses of hypomorphic syntaxin-1 alleles in Drosophila and Caenorhabditis elegans (Schulze et al., 1995; Saifee et al., 1998) yielded distinct severities of phenotypes, though the relationship of syntaxin levels with docking, priming, and release probability was not analyzed.
We observed a relatively selective corresponding decrease in Munc18-1 levels upon reduction of Stx1B expression levels. The inverse situation, which involves the decrease of Stx1A and Stx1B levels in the absence of Munc18-1, has been observed in previous studies (Toonen et al., 2005). Thus, Stx1 and Munc18-1 are chaperones of each other—deficiency in one leads to instability in the other. This relationship has a functional significance, as demonstrated by overexpression studies in which inhibition of neurotransmission by Stx1 overexpression was suppressed by co-overexpression of Munc18-1 and vice versa (Wu et al., 1998; Mitchell and Ryan, 2005). These findings suggest that the synaptic phenotypes we observed upon reduction of Stx1 levels are due to the associated loss of Munc18-1. However, we did not observe any significant rescue of EPSC amplitudes, RRP, and Pvr in Stx1-deficient neurons transduced only with Munc18-1 (Fig. 8), excluding this possibility.
Fourth, we found similar sensitivity and a strong cooperative unit of ∼3 for both Stx1-dependent priming and release probability, suggesting that these two processes arise from the same molecular process.
Our results on docking are different from earlier studies, which found no significant changes in docked vesicles upon expression of BoNT/C in neurons (de Wit et al., 2006, 2009). The involvement of mammalian Stx1 in vesicle docking has been suggested before by total internal reflection fluorescence analysis of PC12 cells, which showed that Stx1 and SNAP25 cluster in large copy numbers at sites where secretory granules dock (Barg et al., 2010; Knowles et al., 2010). Whether large clusters of SNARE proteins are actively involved in the docking process or simply increase the likelihood of SNARE complex formation is not clear. Our findings show that even with a significant reduction of Stx1 expression in knock-down neurons, the change in vesicle distribution is relatively subtle, suggesting that the former mechanism is unlikely.
Acute interference of Stx1 function in the calyx of Held by botulinum toxin cleavage blocked neurotransmitter release without changing the kinetics of the vesicle exocytosis (Sakaba et al., 2005). This experiment confirmed that Stx1 is important, but since it creates a soluble Stx1 fragment, its interpretation is not unequivocal. Here, we show that the vesicular release probability in central synapses was affected by reduction of Stx1, suggesting that SNARE proteins are rate limiting for Ca2+-evoked release, provided their concentration has decreased below a certain minimal level. From a mechanistic perspective, a decrease in release probability is likely due to the availability of fewer Stx1 molecules that can form functional SNARE complexes, which can decrease the driving force for fusion. Previous estimates for the minimum number of SNARE complexes required for fusion ranged from 5 to 11 (Han et al., 2004; Domanska et al., 2009; Karatekin et al., 2010), favoring the formation of multimeric SNARE complexes per vesicle to facilitate exocytosis. Other studies, however, have challenged the multimeric model by arriving at lower estimates of two to three in live cells (Hua and Scheller, 2001; Mohrmann et al., 2010; Sinha et al., 2011), and one SNARE complex using liposome fusion assays (van den Bogaart et al., 2010). We estimated a Stx1 cooperative unit of 3 for both priming and release probability. Taken collectively with studies involving SNAP25 (Mohrmann et al., 2010) and Syb2 (Sinha et al., 2011), there is now evidence from all three SNARE proteins that efficient exocytosis in vivo generally requires more than one SNARE complex. Severely decreasing the number of SNARE complexes per vesicle reduces release efficiency, though we cannot exclude the possibility that fusion can occur with a single SNARE complex.
Having the same cooperativity for priming a vesicle and for the regulation of the release probability has interesting biological implications for SNARE-mediated fusion. It has been proposed that molecular priming of a vesicle involves partial assembly of the SNARE complex at the N terminus, and that full assembly toward the C terminus upon Ca2+ influx facilitates fusion (Südhof, 1995; Sørensen et al., 2006; Walter et al., 2010). Our findings that docking, priming, and vesicular release probability are all affected upon severe Stx1 reduction, with an accompanying decrease in Munc18-1 levels, support the idea that they are highly related processes. At the very least, our results imply that molecular priming is a direct regulation of release probability, via modulation of vesicle fusogenicity. This goes against the suggestion that SNARE complex formation only occurs downstream of calcium influx (van den Bogaart et al., 2011). A cooperative unit of ∼3 provides a minimum estimate of Stx1 molecules needed for these processes, presumably to form functional SNARE complexes between vesicles and release sites, corresponding to molecular priming. Primed vesicles attain fusogenicity, enabling them to be released spontaneously, by an action potential or by hyperosmotic stimulus. Consistent with this idea, the approximate fit of the Pvr function approaches zero at very low Stx1 concentrations (Fig. 10F). Fusion efficiency as a function of Stx1 levels will be difficult to assess at very low concentrations, as the small response size sets a threshold for detection Pvr values of ∼1%. Nevertheless, our results suggest that SNARE proteins are rate limiting, and that we need more than one SNARE complex for fusion.
Our model proposes that small changes in the number of SNARE complexes can regulate release by affecting the number of vesicles reaching the threshold for fusogenicity. This, in turn, affects how likely they will be released by an action potential. In the same way, molecules such as Munc13 (Basu et al., 2007) and complexin (Xue et al., 2007, 2010) can also regulate Pvr, through conformational changes or direct interactions that enhance the performance of the fusion machinery. These mechanisms are distinct from Ca2+-dependent modulation of release, such as the one mediated by synaptotagmin 1 (Fernández-Chacón et al., 2001; Dai et al., 2007; Xue et al., 2008).
Footnotes
This research was supported by the Deutsche Forschungsgemeinschaft Research Training Group 1123 for Learning and Memory (to M.A.); and by the Neurocure Cluster of Excellence Exc257, the Collaborative Research Center 958, and the European Research Council Grant SYNVGLUT (to C.R.). We thank Ralf Nehring for assistance in designing the knock-down and rescue constructs; Benjamin Rost for design and cloning of the SynGCaMP2 lentiviral construct and for discussions on the projects; Hui Deng, Kathleen Grüttner, Metin Yenilmez, and Annegret Felies for help with cell culture; Berit Söhl-Kielczynski for help with sample preparations for microscopy; Hongmei Chen and Sabine Lenz for assistance with animal care and genotyping; Bettina Brokowski and Katja Pötschke for help with virus production, molecular biology, and DNA sequencing; and Jakob B. Sørensen for comments on the manuscript.
The authors declare no competing financial interests.
- Correspondence should be addressed to Christian Rosenmund, NeuroCure Cluster of Excellence, Charité-Universitätsmedizin Berlin, 10117 Berlin, Germany. christian.rosenmund{at}charite.de


