

Abstract
Communication is an inherently interactive process that weaves together the fabric of both human and nonhuman primate societies. To investigate the properties of the primate brain during active social signaling, we recorded the responses of frontal cortex neurons as freely moving marmosets engaged in conversational exchanges with a visually occluded virtual marmoset. We found that small changes in firing rate (∼1 Hz) occurred across a broadly distributed population of frontal cortex neurons when marmosets heard a conspecific vocalization, and that these changes corresponded to subjects' likelihood of producing or withholding a vocal reply. Although the contributions of individual neurons were relatively small, large populations of neurons were able to clearly distinguish between these social contexts. Most significantly, this social context-dependent change in firing rate was evident even before subjects heard the vocalization, indicating that the probability of a conversational exchange was determined by the state of the frontal cortex at the time a vocalization was heard, and not by a decision driven by acoustic characteristics of the vocalization. We found that changes in neural activity scaled with the length of the conversation, with greater changes in firing rate evident for longer conversations. These data reveal specific and important facets of this neural activity that constrain its possible roles in active social signaling, and we hypothesize that the close coupling between frontal cortex activity and this natural, active primate social-signaling behavior facilitates social-monitoring mechanisms critical to conversational exchanges.
SIGNIFICANCE STATEMENT We provide evidence for a novel pattern of neural activity in the frontal cortex of freely moving, naturally behaving, marmoset monkeys that may facilitate natural primate conversations. We discovered small (∼1 Hz), but reliable, changes in neural activity that occurred before marmosets even heard a conspecific vocalization that, as a population, almost perfectly predicted whether subjects would produce a vocalization in response. The change in the state of the frontal cortex persisted throughout the conversation and its magnitude scaled linearly with the length of the interaction. We hypothesize that this social context-dependent change in frontal cortex activity is supported by several mechanisms, such as social arousal and attention, and facilitates social monitoring critical for vocal coordination characteristic of human and nonhuman primate conversations.
Introduction
Social factors are thought to have had a considerable impact on the evolution of the primate brain (Dunbar, 2003; Miller et al., 2016; Platt et al., 2016). Unique circuits for social signal processing and cognition, such as faces and language (Hickok and Poeppel, 2004; Tsao et al., 2006; Hung et al., 2015), reflect the potential significance of sociality in shaping many aspects of primate brain architecture. Yet, despite evidence of remarkably complex social behaviors in nonhuman primates that likely rely on this intricate neural circuitry (Cheney and Seyfarth, 2007; Rosati et al., 2010), notably few neurobiological studies directly link neuronal processes to these characteristic natural behaviors. Neuroimaging and neurophysiological studies of social communication in primates have typically presented restrained subjects with static social stimuli (e.g., faces, vocalizations, etc.; Leopold et al., 2006; Perrodin et al., 2011; Fisher and Freiwald, 2015). Because of the intrinsic interactive nature of communication, this approach effectively divorces the signal from the very social interactions they evolved to mediate, thereby limiting interpretations of these data to facets of signal processing. Not only does the social context in which social signals are produced have a profound influence on what is communicated (Engh et al., 2006; Seyfarth and Cheney, 2014), but active communication is known to affect properties of neural activity (Stephens et al., 2010; Hasson et al., 2012; Silbert et al., 2014). Because of the sophistication of the primate social landscape, and the evolution of neural circuits to support these behaviors, neurobiological studies of active communication are likely to yield unique insight into the neural processes supporting distinct aspects of the primate brain related to social functions (Hasson et al., 2012; Miller et al., 2016).
Primate communication might be based not only on the content of individual social signals, which are limited in number and content, but also on communicative behaviors that mediate myriad social interactions characteristic of their societies (Miller et al., 2016). Marmoset antiphonal conversations, a naturally occurring vocal behavior characterized by the coordinated reciprocal exchange of phee calls (Fig. 1; Miller and Wang, 2006; Roy et al., 2011), offer unique opportunities to investigate these more social dimensions of primate communication at a neurobiological level (Eliades and Miller, 2017). For example, two recent neurophysiology experiments showed that neurons in multiple areas of marmoset prefrontal and premotor cortices exhibited little to no response to hearing phee calls during antiphonal conversations, despite the same population showing robust vocal motor-related changes in activity (Miller et al., 2015; Roy et al., 2016). Notably, these findings contrasted with prior neurophysiology studies of head-restrained rhesus and squirrel monkeys showing strong sensory-driven responses to vocalizations in the same areas of the frontal cortex (Newman and Lindsley, 1976; Gifford et al., 2005; Romanski et al., 2005). The disparity evident in these findings is difficult to currently reconcile, but suggests that, like human communication (Hasson et al., 2012), natural primate communication may involve processes that are not strictly sensory and motor.

Antiphonal conversations in marmosets. Spectrograms of antiphonal and independent phee calls. Top, the virtual marmoset phee stimuli broadcast to the marmoset subject. Bottom, Phee calls from the live marmoset Subject M. The first virtual marmoset phee call is an independent stimulus, characterized by the absence of response from M within the antiphonal period of 10 s as denoted by a gray dashed line. The next two calls from the virtual marmoset are antiphonal stimuli, characterized by phee responses from M within the antiphonal period. The final call from the virtual marmoset is independent, with no vocal response from M within 10 s.
Further analyses revealed a potentially distinct, parallel mechanism to sensory encoding in the marmoset frontal cortex during active communication. We found that frontal cortical activity when subjects heard a phee call could classify whether subjects produced a subsequent response or not in the conversation, despite the dearth of stimulus-driven activity evident at the level of single neurons (Miller et al., 2015). This intriguing result suggests that the frontal cortex participates in the outcome of marmoset conversations, but a more thorough characterization is required to distinguish among the many mechanisms at play during active vocal interactions. These mechanisms include sensory encoding, perceptual categorization, decision making, attention, and arousal. Here we thoroughly characterize the underlying sources of variance in frontal cortical activity, narrowing its possible role in natural conversations. By doing so, we take important steps toward understanding a specific neural mechanism in the technically and conceptually challenging context of natural, freely moving, primate social behaviors.
Materials and Methods
Subjects
Three adult common marmosets (Callithrix jacchus) group-housed in the Cortical Systems and Behavior Laboratory at University of California, San Diego served as subjects in these experiments. Marmosets are a New World monkey endemic to the forests of northeastern Brazil (Schiel and Souto, 2017). Marmoset Subjects B and R were male. Marmoset Subject F was female. We recorded neural activity from two microelectrode arrays in Subject B. The array in the left hemisphere, B01, was centered in area 6v, while the second array, B02, was centered in area 6d in the right hemisphere. Subject R had a single array, R01, placed in the right hemisphere centered in areas 45 and 8av. Subject F had a single array, F01, placed in the left hemisphere centered in area 6d with the most rostral electrodes in 8ad, similar to array B02. Microelectrode array locations were chosen based on previous functional neuroanatomy study of marmosets engaged in natural vocal communication (Miller et al., 2010b).
Surgical procedures
Before the placement of the electrode arrays and initiation of the neurophysiology experiments, all subjects underwent a surgery to implant an acrylic head cap and stainless-steel head posts. During this surgery, the lateral sulcus, as well as the rostral and lateral edges of frontal cortex, were visible through the skull and marked. We were able to later use the markings on the skull made during surgery to triangulate the desired location of the frontal cortex when placing the microelectrode array. We recorded neural activity using a Warp16 electrode array (Neuralynx). The Warp16 comprises 16 independent guide tubes that house sharp tungsten electrodes (impedance, 2.5–3.5 MΩ) in a 4 × 4 mm grid. Since the arrays are positioned on the surface of the brain, electrodes are lowered perpendicular to the laminar surface of the neocortex. Individual electrodes in the Warp16 were advanced incrementally over the course of the experiment by restraining animals in a monkey chair. A calibrated Warp Drive pusher was attached to the end of each guide tube and each respective electrode was advanced 10–20 μm twice a week. The Warp16 array was coupled with a tether to allow for freely moving behavior during recordings.
Experimental design and statistical analysis
Behavioral paradigm.
All recordings took place in a 4 × 3 m radio frequency-shielded testing room (ETS-Lindgren). A speaker (Polk Audio, TSi100; frequency range, 40–22,000 Hz) was placed 5 m away on the opposite side of the room with cloth occluders equidistant between the animal and speaker. All vocal signal stimuli were broadcast at 80–90 db SPL measured 1 m in front of the speaker. A directional microphone (Sennheiser, model ME-66) was placed 0.5 m in front of the subject to record all vocalizations produced during a test session. For each behavioral session, marmosets were removed from colony housing <1 h before the session, and returned to the colony after the session was complete between 9:00 A.M. and 4:00 P.M. (the colony had a 6:00 A.M. to 6:00 P.M. light cycle), with each subject run at the same time of day. Further details of the playback and software are provided in previous publications (Miller and Wang, 2006; Miller et al., 2009, 2015; Miller and Thomas, 2012). Here we briefly describe the overall procedure used during these experiments.
Marmosets produce phee calls both within antiphonal conversation and independent of these vocal interactions. Based on previous behavioral studies (Miller and Wang, 2006; Miller et al., 2009; Chow et al., 2015), phee calls that receive a marmoset response within 1–10 s of hearing it are deemed antiphonal, while calls that do not elicit a timely response are classified as independent (Fig. 1). Thus, the social context (antiphonal or independent) of a phee stimulus is determined by events after the call has been heard; that is, by whether the subject vocally responds. Importantly, there is no evidence that the acoustics of the phee call determines its social context, as the use of a discriminant function analysis was unable to distinguish between phee calls produced in these two contexts (Miller et al., 2010a). Our primary interest was comparing the impact of the two social contexts of the phee stimuli on frontal cortical activity.
In each recording session, stimuli were phee calls produced by a single marmoset previously recorded during naturally occurring antiphonal calling interactions. Our interactive playback software was designed to broadcast these stimulus classes, antiphonal and independent, at different intervals relative to subjects' behavior. Each time a subject produced a phee call, an antiphonal phee-call stimulus was broadcast 2–4 s following call offset. Bouts of antiphonal calling occurred when subjects alternated an antiphonal call response with a stimulus presentation successively, which we refer to as an extended conversation. Independent phee-call stimuli were broadcast if subjects produced no phee calls for 45–60 s. The aim of broadcasting independent stimuli was to induce conversational exchanges in subjects. Only phee calls with two pulses were analyzed. All stimuli produced by the virtual monkey consisted of two pulses, and one-pulse and three-pulse calls by subjects were extremely rare (<1% of data).
Spike extraction and sorting.
Neural activity was digitized and sorted off-line. Based on previous reports using similar recording methods (Eliades and Wang, 2008a,b), units were determined based on the criteria that the unit have a signal-to-noise ratio (SNR) ≥13 dB and, after spike sorting, that the waveforms appeared throughout an entire recording session, which typically lasted 60–80 min. Units with <1% of interspike intervals within a 1 ms refractory period were classified as single units, and all others were classified as multiunits. Multiunits typically occurred when spike sorting was unable to separate several lower-amplitude waveforms. We used the activity of all single and multiunit recordings from sessions with ≥20 independent and antiphonal stimuli.
Simulations of single and population recordings.
Simulations of individual and population responses were performed for further analyses, including principal components analysis (PCA), and two-means classification. For individual units, we performed nonparametric Monte Carlo simulations of the firing rates in response to phee calls by drawing responses to 5000 stimuli, with replacement, evenly divided between antiphonal and independent stimuli. Firing rates were calculated during four time periods, each close to 1.5 s long, relative to each stimulus (Pre: 1.5 s before stimulus onset; Voc 1: first stimulus pulse; Voc 2: second stimulus pulse; Post: 1.5 s immediately following stimulus offset). We calculated the z score of firing rates for both independent and antiphonal stimuli for each time period from each unit so that all dimensions were centered for further analyses. Firing rate draws were always conserved across time periods (i.e., firing rates for Pre and Voc 1 time periods were always from the same phee stimulus). Although Monte Carlo simulation for individual units was unnecessary, it preserved any influence the process may have had on population simulations when comparing two-means classification. For simulating population responses, one response (firing rates over all four time periods) was randomly drawn from the same phee context from each unit. This was repeated 5000 times, with replacement, evenly split between independent and antiphonal stimuli. Thus, each population response could include responses from many different stimuli, so long as the vocalization context was the same, which was necessary because individual behavioral sessions typically included simultaneous recording of <10 units. The use of 5000 Monte Carlo samples was validated by examining the variance in two-means classification and receiver operating characteristic (ROC) analysis, increasing sample size until variance plateaued (which had occurred by 3000 samples).
PCA.
Principal components and their coefficients for recording simulations were obtained using the Matlab (Mathworks) “pca,” using the singular value decomposition method.
ROC analysis.
ROC analysis was applied to test simulations in principal components of the training simulations by sliding a criterion from the lowest to greatest response value in 1/1000 increments of the range, with responses greater than criterion categorized antiphonal and those less than criterion as independent, with this axis flipped if the median independent response from the training set was greater than antiphonal. Hits were correctly identified antiphonal responses and false alarms were independent responses identified as antiphonal, and the ability to separate contexts was measured from the area under the resulting curve of hits against false alarms. We repeated the entire procedure 500 times to produce confidence intervals (CIs) via Monte Carlo cross-validation. This cross-validation method, which is closely related to the bootstrap and jackknife, is more clearly applicable for this case of combining responses across multiple behavior sessions.
Two-means classification.
Because the principal component (PC) 1 of population simulations showed such clear separation between antiphonal and independent phee calls, we devised a way to test how well we could classify the social context from PC1 of population and individual unit response simulations. We first split the firing rates to antiphonal and independent stimuli into two sets: a training set (50% of the data) and a test set (50%). This was done before the simulation of the recordings to preserve independence of the datasets. PC1 was extracted from the training dataset and two-means clustering was performed using the “kmeans” Matlab function, which determined the direction of antiphonal and independent calls. The test dataset was transformed into PC1 of the training set and two-means clustering was performed on the transformed test values. The identity of each cluster from the test dataset was assigned based on the training-set clusters (e.g., if the lower-valued training-set cluster corresponded to independent phee calls, then the lower-valued test-set cluster was assumed to also be independent phee calls). Accuracy was calculated by taking the sum of correctly identified contexts divided by the 5000 total responses in the test set. CIs were estimated by repeating 500 population simulation cross-validations. Variance in classifier performance was identified according to how the training and test datasets were split. We found 200 cross-validations were sufficient to estimate median accuracy and 95% CIs (<1% changes in estimates).
The same two-means classification was also used on individual units and individual sessions using the exact same procedures, except the dimensionality of the data was reduced by including fewer units. For sessions, Monte Carlo population response simulations were performed with (normal) and without (shuffled) drawing responses for each unit from the same stimulus (and not just within the same context). When combining units across sessions, responses must be drawn from different stimuli (although still within the same context).
Determining stimulus preference for individual units.
PC1 coefficients from population training simulations were used to define the preferred stimulus of each recording. This method was reliable in that the axis of PC1 was preserved across training and test datasets for all 500 simulations. To do this, preference was assigned based on the sum of PC1 coefficients over all time periods. For most of the training datasets (98%), antiphonal preference was assigned to positive values and independent to negative values. Importantly, all analyses that involved calculating a score from responses, or that involved combining responses, based on unit preference only included the half of the stimulus set presented to each unit that was not used to calculate the stimulus preference. This reduces the number of trials available for the analyses, but it is necessary to prevent the stimuli used to calculate preference from biasing subsequent analyses in favor of that preference. Z score was used to normalize all unit responses. Significance of context preference index for individual units used the distribution of indices for each unit from the 500 Monte Carlo cross-validations, applying a one-tailed criterion with α <0.05, for indices grater than 0. For comparing preferential activity across populations of units, we performed t tests on the median normalized firing rates of all Monte Carlo cross-validations, which had unimodal central tendencies, with degrees of freedom determined by the population of 258 units.
Measurement of neuronal correlations.
To estimate the correlation in activity between units, we looked at each unit, with at least one other simultaneously recorded unit (n = 256 units, because two behavioral sessions included only one unit). Pairwise correlation coefficients were calculated between each unit and all the other units in that session, comparing firing rates for each time period (Pre, Voc 1, Voc 2, and Post) of each stimulus. The average pairwise correlation for each unit was estimated by the mean absolute value of all its pairwise correlation coefficients.
Conversation categorization.
Context preference of each unit was estimated using half the stimulus responses from each context. The other half was processed and tagged with independent and antiphonal bouts (bouts referring to consecutive stimuli of the same context). Each sequence was counted to determine bout length. A bout-related response for each unit was calculated by averaging firing rates for each stimulus over all time periods, normalizing firing rates by taking z scores across stimuli from both contexts, and rectifying responses by inverting these responses for units with antiphonal context preferences. Bout-related responses took the mean response over all stimuli that met the following bout criteria: the first and last stimuli in antiphonal and independent bouts; the second and second-to-last stimuli in independent bouts; the third and third-to-last stimuli in independent bouts (all n = 258); and, in antiphonal bouts, “middle” stimuli that were not the first or last stimulus (n = 220). Population responses and CIs were calculated from the mean and t distributions from all unit responses.
Repeated-measures two-way ANOVA was used to determine significance across six time points in bouts with factors of array location and bout category. The six time points were first and last in a bout, second and second from last, and third and third from last. Post hoc multiple comparisons with Tukey–Kramer correction were used to determine which of the bout positions within categories was significantly different from the others.
Bouts of various lengths were compared to see how population responses, as calculated above, changed depending on bout length. In each unit, only bouts of length 2–9 were analyzed, and only units with data for both antiphonal and independent bouts of the same length were included for these comparisons. Only independent bouts occurred in sequences >9, so those stimuli were not included.
Due to the decreasing sample size of the number of units for higher bout lengths, the distributions became less normal and had increasing variance. Multivariate ANOVA and ANOVA were not suitable for this. Rather, significant-difference testing was done with multiple paired-sample one-tailed t tests, which were then corrected for multiple comparisons by the Holm–Bonferroni method. Our alternative hypothesis was that mean independent bouts would be greater than mean antiphonal bouts due to the rectification of unit responses based on context preference.
Results
Our primary interest in the current study was to understand, by examining the frontal cortex population responses from three marmoset subjects, the source of variance that made it possible to predict the social context of a phee stimulus (Miller et al., 2015). One hypothesis posits that changes in frontal activity may be stimulus driven, reflecting decisions in response to hearing and encoding the phee call. Alternatively, the observed change in neural activity may also reflect a change in state unrelated to the phee stimulus. Such changes in activity could depend on many neurons distributed broadly across frontal cortical areas or a smaller proportion of neurons confined to one area. As a first step, we performed PCA on combined responses of all units to antiphonal and independent phee stimuli (see Materials and Methods, Simulations of single and population recordings). Figure 2 demonstrates that PCA identified a structure in the frontal population activity that was able to separate antiphonal from independent stimuli. Figure 2A (top) shows a sample test simulation of frontal cortex population responses to phee stimuli plotted in PC1 and PC2 of the training simulation. Notably, the two social contexts form two clusters in PC1. As a negative control, we performed the same analysis, except that the antiphonal and independent designations for each stimulus were randomly shuffled. As expected, PCA did not separate frontal population responses by these arbitrary phee contexts (Fig. 2A, middle). To discover whether frontal cortex population responses might also distinguish between basic acoustic features of phee calls, we performed the same PCA analysis, except that stimuli were categorized by phee stimulus length instead of social context (Fig. 2A, bottom). As with the arbitrarily assigned contexts, PCA did not separate population responses by stimulus length.

Frontal cortical activity separates vocalization social contexts. A, Sample frontal cortical population responses simulated from test datasets plotted in the first and second PCs from training simulations by phee social context (top), randomly shuffled contexts (middle), and phee-stimulus lengths (bottom). The population responses to phee social contexts form distinct clusters for antiphonal and independent contexts, but this is not the case for randomly shuffled contexts, or to stimuli separated by phee length. B, ROC analysis measures the separation of population responses by social context (top), randomly shuffled contexts (middle), and stimulus length (bottom), in the first three PCs from independent training datasets. An area under the ROC curve of 0.5 indicates stimulus categories are not separable, and 1 indicates they are completely separable. Population responses to independent and antiphonal phee calls are highly separable in PC1, and remain significantly separable in the PC2. The remaining PCs show no separation. Population responses to randomly shuffled contexts (middle) or to different phee stimulus lengths (bottom) are not separable. Error bars are 95% CIs. C, The median coefficients of PC1 from all 500 training simulations of population responses to antiphonal and independent stimuli. Coefficients are organized by unit (columns) and time period (rows). Units are sorted by the sum of the coefficient magnitudes over all time periods, such that recording 1 contributes the least to PC1 and recording 258 contributes the most. D, Mean and 95% CIs for median PC1 coefficient contributions from each time period, calculated by summing the coefficient magnitudes across all units. Error bars are 95% CIs.
We used a ROC analysis to measure how well each PC of a training simulation separated population responses of the test simulation (see Materials and Methods, ROC analysis). An area under the ROC of 0.5 indicates no separation of responses and an area of 1 indicates perfect separation. Figure 2B plots the median area under ROC for population responses to social contexts (top), to the randomly assigned contexts (middle), and to phee stimuli by length (bottom) for the first three PCs. PCs 1 and 2 separated population responses to antiphonal stimuli from independent stimuli to a significant degree (Monte Carlo cross-validation, p < 0.002, the minimum p value definable given 500 cross-validations), with greater separation in PC1 (median, 0.96) compared with PC2 (median, 0.75; Monte Carlo cross-validation, p < 0.002). No individual PC (or combination of PCs) significantly separated population responses to randomly shuffled contexts or by phee-stimulus length.
To better understand how the population activity was able to distinguish between antiphonal and independent contexts, we examined the coefficients assigned to each dimension of the population responses. Figure 2C shows the median PC1 coefficients from 500 training simulations, organized by unit in columns and by time period in rows. We presented PC1 median coefficients because they were unimodal, with a strong central tendency over the simulations resulting in highly significant correlations between PC1 coefficients between simulations (mean of r(1030) = 0.59, all p's < 0.0001). Units were sorted in order of mean coefficient magnitude across all four time periods, and half of the coefficient contributions were from the 78 most strongly weighted units, implying that many units contribute to the distinction between phee contexts. Notably, coefficients are exceptionally evenly distributed over time periods (Fig. 2D), so that when averaged over all units, no single time period showed a greater contribution to PC1 than any other [t(257) < 0.88 (magnitude), p > 0.38, no correction for multiple comparisons]. This suggests social context may be as discriminable before hearing a phee stimulus as during or immediately after the stimulus. Also, coefficients in PC1 span positive and negative values, indicating that some frontal neurons have greater firing rates for the antiphonal context, whereas others are more active for the independent context. Importantly, PC coefficients do not distinguish contributions to variance between social contexts (i.e., context separation) from contributions to variance within social contexts, and so these implications must be verified with direct tests.
Initially, we sought to test these implications by measuring the accuracy of social-context classification using a two-means classifier that takes advantage of the separation between antiphonal and independent stimuli in PC1 (see Materials and Methods, Two-means classification). This classifier performed well for test simulations of frontal cortical activity from large neuron populations, but not for individual units. Figure 3A shows two distributions that illustrate classification accuracy for our entire population of units (magenta histogram) compared with the units individually (gray histogram). Median accuracy for individual units was 51%, only slightly better than chance performance of 50% correct, though this was highly significant (signed-rank test, z = 4.97, p < 0.0001, n = 258 units), and even the best individual unit classified stimulus context with only 72% accuracy (Monte Carlo cross-validation, p < 0.002). In contrast, median accuracy for the entire population of units was 91%, significantly greater than the most accurate single unit (Monte Carlo cross-validation, p < 0.002). This indicates that the variance in PC1 used to classify neural activity emerges from the large population of units, once again indicating that many units likely help distinguish between social contexts. It is also possible that population classification may benefit from the methods required to simulate responses.

Social context classification from PC1 emerges from the population activity. A, Histograms of individual unit classifier accuracies and the distribution of accuracies of the population classifier performed on all 500 population response simulations. B, The distribution of average pairwise correlation coefficients over all units estimated under two conditions: with responses to each phee stimulus maintained across all units within a session (normal) and with responses to phee stimuli shuffled within each context across units (shuffled). C, The change in classifier accuracy for each behavioral session with responses to each stimulus maintained across all units in that session (normal) and with responses to each stimulus shuffled, within social context, across units (shuffled). D, Accuracy of the population classifier is much greater than chance even when predicting stimulus context from population activity at only one time period relative to that stimulus. Error bars are 95% CIs.
When simulating the frontal cortex population responses, activity across neurons is decorrelated because all units were not recorded in the same behavioral session. This is shown in Figure 3B, which estimates the distribution of pairwise correlations of all frontal units from the only the frontal units simultaneously recorded within a behavioral session. When phee-stimulus responses were maintained across all units (normal), median pairwise correlations were 0.11. When unit responses to stimuli were shuffled within each of the social contexts (shuffled, as occurs for the population simulations), median pairwise correlations decreased to 0.05 (signed-rank test, z = 11.9, p < 0.0001, n = 258 units). To address how this might affect the population classifier within the constraints of our data, we compared accuracies for each session before (normal) and after shuffling (shuffled) responses within social contexts (Fig. 3C). Sessions typically had few units (median of four), which resulted in most accuracies only slightly above chance, similar to individual units (Fig. 3A). Nevertheless, median accuracy increased by ∼0.01 when responses were shuffled, a proportional increase by ∼40% above chance (signed-rank test, z = −2.15, p = 0.032, n = 62 sessions). Removing this proportional improvement from our population classifier (91% median accuracy, 41% above chance) results in a median accuracy of 77%, which still performs significantly better than the median accuracy of the best individual unit (Monte Carlo cross-validation, largest p = 0.014).
We also tested whether activity from each of the four stimulus time periods (Pre, Voc 1, Voc 2, and Post) could identify phee-stimulus social context using the same population classifier using unit activity only in the respective time period. The accuracy of classification is given, along with 95% CIs calculated from 500 simulations, in Figure 3D, in which all four time periods show significant accuracies well above chance. Despite its limitations, our classifier illustrates the power of small activity changes in large neuronal populations in determining context. Next, we applied simpler analyses to measure social context-dependent changes in individual units and across time periods.
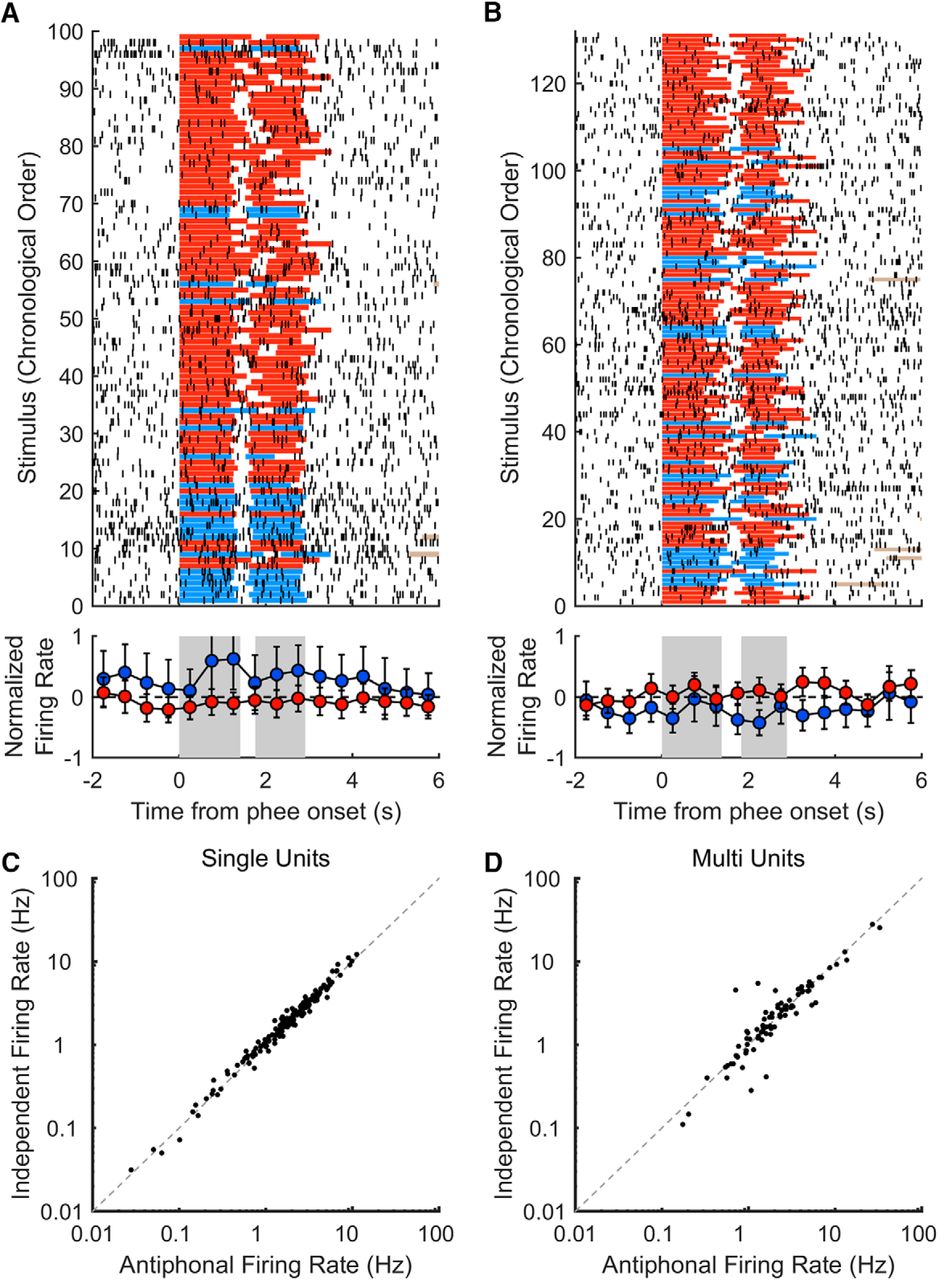
We examined two sample units with high PC1 coefficient magnitudes as exemplars to guide further analysis. Figure 4A shows an example raster plot of unit activity from one behavioral session (top) summarized by normalized firing rates in 0.5 s time bins (bottom). This example unit corresponded to large positive PC1 coefficients, which, based on the initial population analysis, is expected to be more active for antiphonal phee stimuli. While this trend is apparent before, during, and after stimuli are heard, which is consistent with the PC1 coefficients in each time period, the raster plot shows substantial variability, and a low enough firing rate that differences within 0.5 s time bins are rarely significant. Figure 4B shows the activity of an example unit with large negative PC1 coefficients, displayed in the same format as Figure 4A. In this example, firing rates tend to favor independent phee stimuli. Also, as in Figure 4A, this example exhibits this preference before, during, and after stimuli are heard, but again, comparisons rarely reach significance over the 0.5 s time bins. From an examination of these particular units, it seems the difficulty in finding significant changes in activity across contexts has to do with the low firing rates of these frontal units engaging in these natural vocal exchanges. Figure 4 also plots the mean activity for each single unit (Fig. 4C; 172 of 258) and each multiunit (Fig. 4D; 86 of 258), averaged over all time periods for the antiphonal context compared with the independent context. Typically, changes in activity were <1 Hz; however, these changes could be quite large as a proportion of their mean firing rates (mean of 2.5 Hz for single units and 3.3 Hz for multiunits), with a mean difference between contexts of 10% for single units and 18% for multiunits. Averaging over longer time periods, or across many units, could reveal significant differences despite the low firing rates.

Differences in unit activity between vocalization social contexts. A, Sample raster (1 ms resolution; top) and normalized spike rates (0.5 s time bins; bottom) for a unit with large positive PC1 coefficients. In the raster plot, red lines indicate independent phee stimuli, blue lines indicate antiphonal phee stimuli, and brown lines mark subject replies (when within the axis limits). Binned, normalized, firing rates are shown below, with blue points for antiphonal stimuli and red points for independent stimuli. Gray rectangles indicate the mean phee pulse times. Error bars are 95% CIs. B, Sample raster with same conventions as A, except for a recording with preference for independent stimuli, which had large negative PC1 coefficients. C, Mean firing rates of all 172 single units in response to antiphonal stimuli compared with independent stimuli. Firing rates were averaged over all four time periods and plotted on a logarithmic scale. D, Mean firing rates of all 86 multiunits using the same conventions as C.
We quantified the prevalence of social-context response preferences, as observed in the example units above, by calculating a context preference index for each unit spanning all four stimulus time periods (Pre, Voc 1, Voc 2, and Post; see Materials and Methods, Determining stimulus preference for individual units). Of the all 258 units, 43 (17%) significantly distinguished between social contexts (Monte Carlo cross-validation, p < 0.05), and 155 (60%) had a positive context preference index (signed-rank test, z = 6.48, p < 0.0001, n = 258 units). Figure 5A shows the context preference index of each unit, with blue indicating antiphonal preferring units and red for independent. Notably, preference is almost evenly split, both for units with significant preferences (40% antiphonal to 60% independent) and over all units (43% antiphonal to 57% independent). Eliminating the firing-rate normalizations revealed an average unit change in firing rate between preferred and nonpreferred contexts is quite small (mean, <1 Hz), making analyses of individual units at finer time scales impractical. The context preference index may miss important units that show interactions between social context and the phee-stimulus periods. For example, unit 247 from Figure 5A may play such a role. It has large negative PC1 coefficients during Voc 1 and Voc 2 but a large positive coefficient during the Post time period (Fig. 2C), and yet the context preference index is negative. Notably, the context preference index is strongly correlated with the unit PC1 coefficient magnitudes (r(256) = 0.80, p < 0.0001), illustrated in Figure 5A by ordering units by increasing coefficient magnitudes, validating the use of the coefficients for identifying sources of variance between social contexts.

Frontal cortical activity distinguishes between vocalization social contexts. A, The context preference index, given by the difference in mean normalized firing rate between preferred and nonpreferred stimuli contexts, is plotted for each unit. Blue points indicate preference for the antiphonal context and red points for the independent context. Error bars are one-tailed 95% CIs. The inset provides the percentage of units preferring each social context, indicated by color, for the units that reached significance (Sig) and for all units (All). The example units from Figure 4A,B have respectively colored error bars. B, Mean normalized firing rates over all units for the preferred phee context (black) and nonpreferred phee context (white), in 0.5 s time bins. Error bars are 95% CIs. Mean phee-stimulus pulse timings are indicated by gray rectangles. C, D, Same conventions as A and B except context preference index was calculated when phee contexts were randomly assigned by shuffling context identity. E, F, Same conventions as A and B except context preference index was calculated based on length of the phee stimulus instead of its social context. In C and E, unit positions were kept the same as in A, with colors corresponding to the phee context preferences of each unit in A.
Because most units (60%) had a consistent phee preference, we tested whether the entire population of units could distinguish between stimulus contexts on a finer time scale. Figure 5B plots the mean normalized firing rates of all 258 units for preferred stimuli compared with nonpreferred stimuli; as in Figure 5A, the data used to determine the preferred context was omitted. Firing rates were significantly different at every time point from 1.5 s before phee onset to 6 s after (t(257) < −3.3, p < 0.001, all points remain significant after Holm–Sidak correction for multiple comparisons). Notably, this shows differences in activity between social contexts of phee stimuli before they are even heard. To confirm that our analyses for Figure 5A,B were unbiased, they were performed after randomly shuffling the social context assigned to each stimulus and for stimuli categorized by phee length (Fig. 5C–F). Neither controls reached significance, with fewer individual units showing significant differences than expected by chance (4.7 and 3%, binomial test, p = 1 and 0.20, respectively) and no significant differences in population activity in any time period [t(257) < 1.77 (magnitude), p > 0.089]. In summary, we find that a substantial proportion of individual units in the frontal cortex differentiate between the social context of vocalizations when responses are averaged over several seconds, and the combined activity of many frontal units distinguish the social context on finer time scales, even before the stimulus is heard.
In addition to changes in firing rate, we also tested for differences in interneuronal correlations associated with stimulus social context (see Materials and Methods, Measurement of neuronal correlations). We estimated the average magnitude of pairwise correlations for units recorded in the same behavioral sessions separately for each social context, but otherwise using the same methods as in Figure 3B. The population of units had median interneuronal correlations of 0.12 for antiphonal stimuli compared with 0.09 for independent stimuli (signed-rank test, z = 6.5, p < 0.0001, n = 258 units). Thus, in addition to changes in frontal cortex firing rates, interneuronal correlations are also greater within the antiphonal social context.
In the analyses performed above, we included cortical units from all four arrays to increase the power of our analyses. It is possible that several of our results are only possible when combining all units or that only distinct areas of the frontal cortex exhibit different changes in unit activity. However, we recorded nonoverlapping populations of neurons throughout marmoset areas 6, 8, 45, and 47 in the frontal cortex from four electrode arrays in three different subjects. The positions of each array are illustrated in Figure 6. We found no obvious indication that anatomical location corresponded to the context preference index of units, except that Array B02 exhibited the weakest preferences. Array B02 also included the fewest units (n = 28 units; <11%). We averaged activity across units from each array using the same methods as in Figure 5B except that we used longer time windows (specifically the Pre, Voc 1, Voc 2, and Post time periods) and we also combined all time periods. We found that Arrays B01, F01, and R01 all had significant differences in activity across one or more time periods, and all were significant for the Pre period (t(118,68,46) = −2.17, −2.68, −2.02, p = 0.034, 0.009, 0.046, respectively, no correction for multiple comparisons) and for all time periods combined (t(118,68,46) = −2.29, −2.30, −2.68, p = 0.027, 0.026, 0.010, respectively, no correction for multiple comparisons). Only Array B02 did not show consistent significant differences. This suggests that the role of the frontal cortex in distinguishing between phee contexts is not limited to one area, although the extent throughout all of the frontal cortex remains unknown. Also, by analyzing each array separately, we confirm that our results are reproducible in all three subjects.

Discrimination of social contexts by location of electrode arrays in the frontal cortex. The anatomical layout of the four electrode arrays are shown. B01 and B02 are arrays from Subject B, and F01 and R01 are from Subjects F and R. Each electrode is colored according to its context preference index. Channels with multiple units only show the highest value; channels with no units are light gray with no border.
Antiphonal conversations in marmosets are characterized by the reciprocal exchange of vocalizations (Fig. 1). In the final set of analyses, we investigated how neural activity was affected by sequences of phee stimuli within these conversations, rather than the individual instances of independent and antiphonal stimuli targeted in all previous analyses. We refer to consecutive sequences of stimuli within a single context as “bouts,” with conversations occurring during antiphonal bouts. To compare activity during bouts, we calculated a population response, which averages activity across units by normalizing and rectifying stimulus spike rates (see Materials and Methods, Bout categorization). Figure 7A shows that unit activity is tightly coupled to social context. Repeated-measures ANOVA found significant interaction between bout category and the position in the bout (F(5,1480) = 7.915, p = 0.005). Population responses significantly change between the end of an independent bout and the start of an antiphonal conversation (p < 0.005, Tukey's range test, df = 2313, α = 0.05). This difference in activity persists over the course of the conversation and reliably changes again. The response to the first independent stimulus does not reach significance compared with the final stimulus of an antiphonal bout, but the responses to subsequent independent stimuli are significantly different (p < 0.0354, Tukey's range test, df = 2313, α = 0.05). This pattern emphasizes that the behavioral outcome is closely coupled with a change in firing rate across the population. Notably, there is no difference in the stimuli at the time they are broadcast, yet the latter exhibits the shift in neural activity even before the stimulus presentation. In other words, although the first antiphonal stimulus in a conversation is not deemed antiphonal until the subject produces a response several seconds later, the change in firing rate is evident before the vocalization is heard and persists over the length of the conversation. This has occurred because, presumably, the state of the frontal cortex has shifted to mediate conversations.

Population responses during conversations A, A schematic of an antiphonal conversation between a virtual monkey (VM) and marmoset subject (M) showing a bout of three independent stimuli (red), followed by a conversational bout of three antiphonal stimuli (blue) with subject replies (black), and then another independent bout. Below, Neural population responses to stimuli within the conversation. Responses to phee stimuli at the end and start of independent bouts (red) are greater than responses to stimuli at the start, middle, and end of an antiphonal conversation (blue). *p < 0.05 differences for antiphonal bouts compared with independent bouts. B, Population responses to antiphonal (blue) and independent (red) stimuli are compared with responses during antiphonal and independent bouts of specified lengths. Below each comparison n is the number of units with data for the bout length. *p < 0.03 for differences between independent and antiphonal contexts. All error bars are 95% CIs.
There is some indication that the bout length may affect neural firing rates, though data are limited. Using the same normalization method as used in the previous bout analysis, Figure 7B plots population responses for all antiphonal and independent stimuli across the population, as well as those that occurred in bouts of 1, 2, 3, 4, 5, or more phee stimuli. In general, there is a trend toward more extreme responses over longer sequences of independent stimuli with significant difference reached at the ≥5 bout length (p < 0.03, t test, Holm–Bonferroni corrected df = 55, α = 0.05). A similar trend is evident for antiphonal stimuli, but too few long conversations were available to convincingly determine this case. A two-way ANOVA test of stimulus context and bout length shows significant interaction and group mean differences (p < 0.001, F test, df = 4, α = 0.05). These analyses suggest a linear relationship between neural activity and the length of the natural conversation.
Discussion
We examined the activity of frontal cortical neurons recorded from areas 6, 8, 45, and 47 of freely moving marmoset subjects engaged in natural vocal conversations with a virtual marmoset to characterize how neural activity distinguished between two social contexts in which phee calls are heard. Namely, occasions when a phee elicits a conspecific vocal response (antiphonal context) and those that do not (independent context). We found small (∼1 Hz), but widespread, changes in activity across neural populations within all frontal areas sampled. Notably, this population of units did not tend to exhibit stimulus-driven responses to hearing vocalizations produced by conspecifics. In fact, the period before stimulus onset was comparable to periods during or after the phee stimulus in the degree to which the population activity distinguished between the two social contexts (Figs. 3D, 5B). Finally, not only was a robust correlation evident between frontal cortex activity and antiphonal conversations (Fig. 7A), but the magnitude of the neural response increased as a function of conversation length (Fig. 7B), supporting the notion that this neuronal process is strongly related to the social context of these natural vocal exchanges. It is possible that the magnitude of the change in the neural activity at the time the conversation initiated determined its eventual duration, or it could be that these changes became increasingly affected as the conversation persisted, potentially due to neuronal coupling that may occur between both individuals during the vocal interaction (Stephens et al., 2010; Hasson et al., 2012; Silbert et al., 2014). These important facets of frontal activity help narrow the potential role of this activity in the process of natural communication.
The pattern of activity observed here is particularly notable given the constraints imposed on neurophysiological recordings of the frontal cortex in freely moving, naturally behaving monkeys. Although the overall effect was most clearly evident when pooling activity across the population, 17% of individual units showed significant differences between the antiphonal and independent social contexts (Fig. 5A). This number likely underestimates the proportion of units with changes in activity related to social context because many units showed different patterns of activity across the time periods before, during, and after phee stimuli based on PCA (Fig. 2C). This type of response complexity likely contributes to the accurate classification of social context (91%; Fig. 3A), which substantially outperformed results from a reasonably comparable study in which classification of conditioned auditory task behavior was based on prefrontal neuron activity (Russ et al., 2008). Furthermore, of units in which we observed a significant difference, slightly fewer units showed activity preferences in the antiphonal context (40%) compared with the independent context (60%), suggesting that the temporal epoch of each unit is not only where heterogeneity of the population occurs, but is also where preference for a particular social context is evident. One notable difficulty with regards to our analysis was the small changes observed in firing rate. We are, however, highly confident that these changes are significant, because no differences were evident when the same analyses were applied to randomly assigned social contexts or the classification of phee-stimulus length (Fig. 2). These analyses paint an intricate picture in which multiple mechanisms may support the observed pattern of response, potentially in coordination with a broader process critical to primate social communication that will only manifest under natural conditions.
Many processes are involved in active social signaling, including sensory processing, recognition, categorization, decision making, attention, and arousal. A key question for the current study is which mechanism, or more likely mechanisms, may underlie the observed changes in frontal cortex activity during natural marmoset conversations, and which may not. First, general wakefulness can be ruled out as a key contributing factor because animals were monitored continuously, and remained awake throughout these recordings. General arousal from stress is also unlikely. The marmosets were habituated to the experimental setup and exhibited no overt signs of stress. Also, sensory-driven processes, such as encoding the phee stimulus or decision making based upon the phee are unlikely because differences in neural activity were comparable in magnitude before, during, and after the phee stimuli were broadcast.
The frontal cortex activity reported here is likely related to some facet of attention and/or arousal, which are both often poorly defined terms that can refer to a wide range of mechanisms (Harris and Thiele, 2011). Each are also likely synonymous with nearly all active primate social behaviors, and difficult to disambiguate in natural contexts. With regards to selective attention of sensory information, attentive states show reduced neuronal noise correlations (Cohen and Maunsell, 2009; Mitchell et al., 2009; Harris and Thiele, 2011), which is notably different from the increase in unit correlations that we observe in the engaged, antiphonal, context. Moreover, it does not resemble the known mechanism for selective attention, which corresponds to large changes in neuronal activity localized to specific frontal cortical areas (Gregoriou et al., 2012). It seems more likely that if this activity is related to attention, it would be more related to a concept of “sustained attention” (Sarter and Bruno, 2000), which is not well distinguished from aspects of arousal. Given behavioral evidence showing that marmosets acutely attend to the behavior of multiple individuals during antiphonal conversations (Toarmino et al., 2017b) and coordinate the timing of these exchanges based on the behavior of conspecifics (Roy et al., 2011), it is reasonable to assume that some type of attentional mechanisms contribute to the pattern of activity reported here in the frontal cortex.
It is also probable that a broad variety of processes referred to as arousal may have modulated frontal cortex responses during natural conversations (McGinley et al., 2015). With regards to the sensory cortex, arousal refers to multiple behavioral states, some of which have similar effects on sensory processing. Key among them is desynchronization of neural activity, which can help sensory encoding, and increased activity in particular types of neurons (McGinley et al., 2015; Vinck et al., 2015). Remarkably few studies, however, have observed the mechanisms of such arousal in the frontal cortex, and none in a naturally behaving primate. In a socially engaged antiphonal state, we observed fewer units with increased activity than those with decreased activity (Fig. 5A), and also a greater degree of interneuronal correlations. In this case, a broad, correlated, and distinct pattern of frontal activity could shift marmosets between levels of social arousal or receptiveness. Likewise, small changes in firing may also be ideal for maintaining the behavioral state with neuromodulators, such as acetylcholine, which is associated with various types of arousal (McKenna et al., 1989; Sarter and Bruno, 2000). As a result, individual firing rates across the population, even on the order of 1 Hz reported, could have substantial influence on behavior, especially when they are more tightly correlated and persist over several seconds, such as during antiphonal conversations.
Marmoset antiphonal conversations are characterized by the reciprocal, coordinated exchange of vocalizations between conspecifics. We hypothesize that the observed change in frontal cortex activity indicates a shift in brain state that facilitates social monitoring, a process critical to natural human and nonhuman primate social interactions, including conversations. While this type of shift in behavioral state cannot account for the full complexity of natural conversations, one key characteristic of this human and nonhuman primate behavior is coordinated turn-taking, in which individuals alternate speaking and listening (Levinson, 2016). To produce an appropriate response, an individual must attend to a conspecific ongoing behavior while suppressing their own motor behavior. The change in the state of the frontal cortex may reflect a change in social arousal and attention, and serve a sensory gating function to facilitate rapid processing of conspecific vocalizations throughout the auditory system (Miller et al., 2010b; Petkov et al., 2015) and precipitate the cascade of subsequent social decision-making processes (Toarmino et al., 2017a). The observed neuronal process could also enable neuronal coupling to improve the communicative efficacy of the conversations, similar to what has been shown in human fMRI experiments (Stephens et al., 2010; Silbert et al., 2014). Because these experiments involved a marmoset engaging in conversations with a virtual marmoset, rather than a live marmoset, we cannot test this latter hypothesis, which will be a key target in future studies.
Primate sociality is somewhat paradoxical. Whereas primate social cognition is dynamic and sophisticated, the content and number of social signals is relatively limited despite their fundamental role in mediating these complex social interactions. Resolving this contradiction may necessitate understanding not only what individual social signals communicate but also how they are used within the myriad of ongoing social interactions that typify primate societies. The approach taken here offers unique opportunities to investigate communication within the dynamic, natural contexts that more fully encapsulate the myriad of neural mechanisms that support primate sociality. Neuronal processes, such as the social context-dependent change in frontal cortex state reported here, may occur only when primates are actively interacting with each other. Considerations of how these active dimensions of communication unfold over time within the context of natural primate social life may lead to unique insights into the intricate complexities of the primate social brain.
Footnotes
This work supported by the National Institutes of Health Grant R01 DC012087 to C.T.M.
The authors declare no competing financial interests.
- Correspondence should be addressed to Samuel U. Nummela, Department of Psychology, University of California, San Diego, 9500 Gilman Drive, La Jolla, CA 92093-0109. snummela{at}gmail.com


