

Abstract
Rapid activation of postsynaptic GABAA receptors (GABAARs) is crucial in many neuronal functions, including the synchronization of neuronal ensembles and controlling the precise timing of action potentials. Although the γ2 subunit is believed to be essential for the postsynaptic clustering of GABAARs, synaptic currents have been detected in neurons obtained from γ2−/− mice. To determine the role of the γ2 subunit in synaptic GABAAR enrichment, we performed a spatially and temporally controlled γ2 subunit deletion by injecting Cre-expressing viral vectors into the neocortex of GABAARγ277Ilox mice. Whole-cell recordings revealed the presence of miniature IPSCs in Cre+ layer 2/3 pyramidal cells (PCs) with unchanged amplitudes and rise times, but significantly prolonged decays. Such slowly decaying currents could be evoked in PCs by action potentials in presynaptic fast-spiking interneurons. Freeze-fracture replica immunogold labeling revealed the presence of the α1 and β3 subunits in perisomatic synapses of cells that lack the γ2 subunit. Miniature IPSCs in Cre+ PCs were insensitive to low concentrations of flurazepam, providing a pharmacological confirmation of the lack of the γ2 subunit. Receptors assembled from only αβ subunits were unlikely because Zn2+ did not block the synaptic currents. Pharmacological experiments indicated that the αβγ3 receptor, rather than the αβδ, αβε, or αβγ1 receptors, was responsible for the slowly decaying IPSCs. Our data demonstrate the presence of IPSCs and the synaptic enrichment of the α1 and β3 subunits and suggest that the γ3 subunit is the most likely candidate for clustering GABAARs at synapses in the absence of the γ2 subunit.
Introduction
The subunit composition of GABAA receptors (GABAARs) critically determines their kinetic and pharmacological properties, as well as their subcellular distribution. Despite the diverse subunit repertoire and potentially enormous combinatorial complexity, GABAAR subunit partnership is thought to be governed by the preferential assembly of certain subunits to form a limited number of functional pentameric channel types (Jones et al., 1997; Barnard et al., 1998; Olsen and Sieghart, 2008). Most GABAAR subunits show specific expression patterns in different brain regions and cell types, whereas the γ2 subunit is ubiquitously present in all nerve cells (Wisden et al., 1992; Fritschy and Mohler, 1995; Pirker et al., 2000). Using cell expression systems and physiological approaches, addition of the γ2 subunit to α and β subunits endowed receptors with an increased single-channel conductance and benzodiazepine sensitivity characteristic of native GABAARs (Verdoorn et al., 1990; Angelotti and Macdonald, 1993). Furthermore, the genetic deletion of the γ2 subunit, but not the most abundant α and β subunits, led to early postnatal lethality (Günther et al., 1995; Homanics et al., 1997; Sur et al., 2001; Vicini et al., 2001), further emphasizing the uniqueness of the γ2 subunit as an essential component of synaptic GABAARs. Consistent with this, Essrich et al. (1998), Brünig et al. (2001), Schweizer et al. (2003), Sumegi et al. (2012), and Rovo et al. (2014) have found disrupted clustering of the α1, α2, and β2/3 subunits after γ2 subunit deletion, as detected with light microscopic (LM) immunofluorescent localization, leading to the current widely accepted view that the γ2 subunit is essential for synaptic enrichment of GABAARs (Alldred et al., 2005) and that it is a ubiquitous subunit of all postsynaptic GABAARs that mediate phasic inhibition (Farrant and Nusser, 2005). However, Essrich et al. (1998) and Schweizer et al. (2003) reported that some cultured neurons from γ2−/− mice exhibited GABAAR-mediated IPSCs, as did our previous study (Sumegi et al., 2012). Although these studies clearly demonstrate that synaptic-like currents can be generated without the γ2 subunit, we must emphasize that these currents cannot be taken as evidence that the underlying receptors are indeed concentrated within the postsynaptic specializations of GABAergic synapses.
Investigating the role of the γ2 subunit in GABAAR localization and the generation of synaptic currents in situ in adult animals is difficult with conventional gene knock-out strategies because γ2−/− mice die shortly after birth (Günther et al., 1995). Instead, we used the strategy of injecting Cre-recombinase-expressing viral vectors into the superficial layers of the somatosensory cortex of transgenic animals in which the γ2 gene is flanked by two loxP sites, allowing us to control spatially and temporally the deletion of the γ2 gene from cortical neurons in young adult animals. We performed whole-cell patch-clamp recordings in acute slices to investigate the kinetic and pharmacological properties of GABAAR-mediated currents and, in parallel, LM immunofluorescent and electron microscopic (EM) SDS-digested freeze-fracture replica immunogold labeling (SDS-FRL) to reveal the precise subcellular location, densities, and subunit composition of synaptic GABAARs in neurons lacking the γ2 subunit.
Materials and Methods
Animals and virus injections.
Male and female mice in which the γ2 gene is flanked by two loxP sites and the 77th amino acid is mutated from phenylalanine to isoleucine (GABAARγ277Ilox; Wulff et al., 2007; henceforth 77I mice) between 21 and 40 postnatal days were anesthetized with a mixture of ketamine:piplophen:xylazine (62.5:6.25:12.5 μg/g body weight) and 0.6 μl of adeno-associated viruses expressing a Cre-GFP fusion protein with a nuclear localization signal motif under a human synapsin promoter [AAV2/9.hSynapsin.hGHintron.GFP-Cre.WPRE.SV40 (p1848); obtained from the University of Pennsylvania Vector Core, Philadelphia, PA] was stereotaxically injected into the somatosensory cortex at a flow rate of 0.1 μl min−1. For five mice used for physiology experiments, a 95%/5% mixture of lentiviruses expressing Cre and GFP, respectively, generated in our laboratory were used instead. Slices for electrophysiological recordings were prepared either 2 weeks (mean 16.9 ± 3.6 d; age 44.5 ± 14.7 d) or 6 weeks (mean 46.9 ± 8.8 d; age 76.1 ± 11.0 d) after injection. For immunofluorescent experiments, animals were perfused 2 weeks (mean 14.9 ± 2.5 d; age 47.1 ± 6.3 d) or 6 weeks (mean 45.3 ± 4.4 d; age 75.8 ± 4.0 d) after injection. For SDS-FRL, animals were perfused 2 weeks (mean 14 d; age 36 d) or 6 weeks (mean 41.7 ± 0.6 d; age 73 d) post injection. Two p29 wild-type (WT) mice were injected with viruses and slices were prepared 21 or 28 d later to check the effects of virus infection on intrinsic excitability and synaptic currents. Noninjected WT (n = 6) and 77I (n = 3) mice were also used for control and paired recordings (41.8 ± 15.9 and 48.9 ± 3.7 d old, respectively).
Acute slice preparation.
Injected mice (n = 87) were deeply anesthetized with isoflurane (Abbott Laboratories) in accordance with the ethical guidelines of the Institute of Experimental Medicine Protection of Research Subjects Committee. After decapitation, the brain was removed and placed into ice-cold artificial CSF (ACSF) containing the following (in mm): 230 sucrose, 2.5 KCl, 25 glucose, 1.25 NaH2PO4, 24 NaHCO3, 4 MgCl2, and 0.5 CaCl2. Coronal slices from the cerebral cortex were cut at 250 μm thickness with a Vibratome (VT1000S; Leica) and were stored in ACSF containing the following (in mm): 126 NaCl, 2.5 KCl, 25 glucose, 1.25 NaH2PO4, 24 NaHCO3, 2 MgCl2, and 2 CaCl2. All extracellular solutions were bubbled continuously with 95% O2 and 5% CO2, resulting in a pH of 7.4. After a 30 min recovery period at 33°C, slices were further incubated at room temperature until they were transferred to the recording chamber. In a subset of pharmacological recordings involving ZnCl2, the ACSF contained the following (in mm): 126 NaCl, 2.5 KCl, 25 glucose, 10 HEPES, 2 MgCl2, and 2 CaCl2.
Electrophysiological recordings.
Somatic whole-cell recordings were performed at 26.5 ± 1.0°C using IR-DIC on an Olympus BX50WI microscope with a 40× water-immersion objective. Recordings were performed using a mixed K-gluconate- and KCl-based intracellular solution containing the following (in mm): 65 K-gluconate, 70 KCl, 2.5 NaCl, 1.5 MgCl2, 0.025 EGTA, 10 HEPES, 2 Mg-ATP, 0.4 Mg-GTP, 10 creatinine phosphate, and 8 biocytin, pH = 7.33, 270–290 mOsm. Voltage-clamp recordings of miniature IPSCs (mIPSCs) at a holding potential of −70 mV were performed in the presence of 1 μm tetrodotoxin (TTX; Alomone Laboratories) to block voltage-gated sodium channels and 3 mm kynurenic acid to inhibit ionotropic glutamate receptors. After establishing the whole-cell configuration and allowing for a 2 min stabilization period, a period of 4 min was recorded for each cell (“baseline”). For pharmacological experiments, the perfusion solution was changed to one containing ACSF, 5 or 50 μm flurazepam, 1 or 10 μm ZnCl2, 100 nm 5α-Pregnane-3α,21-diol-20-one (THDOC), 10 μm 4-chloro-N-[2-(2-thienyl)imidazo[1,2-a]pyridin-3-yl]benzamide (DS2; Tocris Bioscience), 20 μm tracazolate hydrochloride (Tocris Bioscience) or 10 μm 4-ethyl-6,7-dimethoxy-9H-pyrido[3,4-b]indole-3-carboxylic acid methyl ester hydrochloride (DMCM hydrochloride; Tocris Bioscience). After a 12 min period of drug equilibration, a second 4 min period (“steady-state”) was recorded. In a subset of recordings, the drug solution was then changed to one containing the drug and SR95531 (20 μm). For paired recordings, TTX was omitted from the ACSF and the same intracellular solution was used for both cells. Cells were initially held in the whole-cell current-clamp mode, and a sequence of hyperpolarizing and depolarizing current injections was used to determine their firing parameters. Putative postsynaptic pyramidal cells (PCs) were then recorded in voltage-clamp while brief, large depolarizing currents (1 nA, 1.5 ms) were injected into the putative presynaptic fast-spiking basket cells every 3 s. Recordings were performed with MultiClamp 700A and 700B amplifiers (Molecular Devices). Patch pipettes were pulled (Universal Puller; Zeitz-Instrumente Vertriebs) from thick-walled borosilicate glass capillaries with an inner filament (1.5 mm outer diameter, 0.86 mm inner diameter; Sutter Instruments). Data were digitized online at 20 kHz and filtered at 3 kHz with a low-pass Bessel filter. Individual mIPSCs were detected as inward current changes above a variable threshold for 1.2 ms, referenced to a 2.5 ms baseline period, and analyzed offline using EVAN 1.5 (Nusser et al., 2001). The detection thresholds were similar between groups (WT noninjected; 5.25 ± 0.96 pA, range 4–6 pA; WT Cre−, 4.75 ± 3.50 pA, range 3–10 pA; WT Cre+ 4.33 ± 1.53 pA, range 3–6 pA; 77I Cre−, 2.98 ± 1.21 pA, range 1.4–6 pA; 77I Cre+, 3.72 ± 1.61 pA, range 1.4–7 pA). Traces containing overlapping synaptic currents in their rising or decaying phase were discarded for the analysis of rise and decay times. Access resistance (Ra) was subject to 70% compensation and was continuously monitored. If Ra changed >20% during the recording, the cell was discarded from the analysis. All recordings were rejected if the uncompensated Ra became >20 MΩ. For paired recordings, only evoked responses meeting these criteria were analyzed. Latency was measured from the peak of the presynaptic action potential to the onset of the postsynaptic response. After recordings, slices were fixed in 0.1 m phosphate buffer (PB) containing 2% paraformaldehyde (PFA; Molar Chemicals) and 15 v/v% picric acid (PA) for 24 h before post hoc visualization of the biocytin-filled cells.
Post hoc visualization of biocytin-filled cells.
Slices were washed several times in 0.1 m PB, embedded in agar, and resectioned at 60 μm thickness with a Vibratome. Sections were then washed in Tris-buffered saline (TBS), blocked in TBS containing 10% normal goat serum (NGS) for 1 h, and then incubated in a solution of mouse anti-Cre (1:5000; Millipore) and rabbit anti-GFP (1:1000; Millipore) primary antibodies diluted in TBS containing 2% NGS and 0.1% Triton X-100 overnight at room temperature. Sections were then washed three times in TBS, incubated in TBS containing Alexa Fluor 488-conjugated goat anti-rabbit (1:500; Life Technologies) and Cy5-conjugated goat anti-mouse (1:500; Jackson ImmunoResearch) secondary antisera, Cy3-conjugated streptavidin (1:500; Jackson ImmunoResearch), 2% NGS, and 0.1% Triton X-100 for 2 h, followed by washing and mounting on glass slides in Vectashield (Vector Laboratories). Images were acquired using a confocal laser scanning microscope (FV1000; Olympus) with a 20× objective. For some paired recordings where we could not unambiguously identify the cell or determine the Cre immunolabeling, we used the spontaneous IPSC weighted decay time constant to determine if the γ2 subunit was ‘deleted’ (Fig. 4).
Immunofluorescent reactions.
Adult injected 77I mice (n = 18) were transcardially perfused with either a fixative containing 4% PFA and 15% v/v PA in 0.1 m PB for 15 min or with ice-cold oxygenated ACSF for 4 min, followed by 50 min postfixation in 4% PFA and 15% v/v PA in 0.1 m PB (Notter et al., 2014). The sections were then washed three times in PB. Vibratome sections were cut at 60 or 70 μm. Some of the perfusion-fixed sections were treated with 0.2 mg/ml pepsin (12 min), followed by several washes in 0.1 m PB. All sections were then washed in TBS, followed by blocking in TBS containing 10% NGS for 1 h. The sections were incubated in a solution containing a mixture of primary antibodies made up in TBS containing 0.1% Triton X-100 and 2% NGS. The following primary antibodies were used for immunofluorescent reactions: mouse anti-Cre (1:5000; Millipore), guinea pig anti-γ2 (1:1000, kindly provided by J.-M. Fritschy), rabbit anti-α1 (1:1000, kindly provided by J.-M. Fritschy), and guinea pig anti-β3 (1:500; Synaptic Systems). Next, sections were incubated in a mixture of Alexa Fluor 488-conjugated goat anti-rabbit (1:500; Life Technologies), Cy3-conjugated donkey anti-guinea pig (1:1000; Jackson ImmunoResearch), and Cy5-conjugated goat anti-mouse IgGs (1:500; Jackson ImmunoResearch) made up in TBS containing 2% NGS for 2 h, then washed and mounted in Vectashield (Vector Laboratories). Images were acquired using a confocal laser scanning microscope (FV1000; Olympus) with a 10× [numerical aperture (NA) = 0.4] or a 60× (NA = 1.35) objective.
SDS-FRL.
Adult injected 77I mice (n = 4) were transcardially perfused with a fixative containing 2% PFA and 15 v/v% PA in 0.1 m PB for 15 min. Next, 80 μm coronal sections were cut from the forebrain. Small tissue blocks containing the injected area indicated by the endogenous GFP signal were cut in a way that it contained a small, noninjected area around the injection zone. Blocks were frozen with a high-pressure freezing machine (HPM100; Leica Microsystems), fractured with a freeze-fracture machine (BAF060; Leica Microsystems), and processed for SDS-FRL as described previously (Kerti et al., 2012). The replicas were treated with TBS containing 2.5% SDS at 80°C for 18 h. Replicas were then washed in TBS, followed by blocking with 5% bovine serum albumin (BSA) for 1 h. For double replica immunolabeling, the antibodies were applied sequentially as follows. On the first day, a primary antibody was applied overnight at room temperature. On the second day, 5 nm gold-conjugated goat anti-guinea pig IgGs diluted in 5% BSA was applied to label the first primary antibody, followed by the application of the second primary antibody overnight. On the third day, a 10 nm gold-conjugated goat anti-rabbit IgG secondary antibody was applied to label the second primary antibody. Finally the replicas were rinsed in distilled water, picked up on copper grids, and examined with a transmission electron microscope (JEM1011; Jeol). Combinations of the following antibodies were used for SDS-FRL: rabbit anti-α1 (1:1000, kindly provided by J.-M. Fritschy) and guinea pig anti-γ2 (1:500), rabbit anti-γ2 (1:600), guinea pig anti-β3 (1:600), and rabbit anti-neuroligin-2 (NL-2; 1:1000), all from Synaptic Systems.
Quantification of immunogold reactions.
For quantifying the immunogold particle labeling of different GABAAR subunits, the “mirror replica” technique (Hagiwara et al., 2005) was used. One side of the replica was labeled for NL-2 and used as a marker of GABAergic synapses, which labels on the protoplasmic face (P-face). In a subset of experiments, the guinea-pig anti-GABAAR β3 subunit antibody was coapplied with NL-2. The other side of the replica was labeled for various GABAAR subunits. Somata of layer 2/3 cells were randomly chosen at low magnification and images were taken at 15,000× or 25,000× magnification for all synapses and for the surrounding extrasynaptic regions. The synaptic areas in each image were delineated based on the IMP clusters in the P-face and the NL-2 labeling using ITEM software (Olympus). The exoplasmic face (E-face) image was then superimposed on the P-face image in Adobe Photoshop CS3 and the synaptic area was projected onto the E-face image. Gold particles inside the synaptic area and up to 30 nm away from its edge were counted for NL-2, γ2, α1, and β3 subunits. We considered only those synapses in which a minimum of four gold particles labeling for NL-2 were present. Only intact and completely fractured synapses were quantified. The replica was tilted whenever the synaptic area was not flat. We only analyzed synapses that were larger than 0.008 μm2. The nonspecific background labeling was calculated on either the E-face or the P-face structures depending on the location of the epitope of the antibodies used.
All drugs and chemicals were purchased from Sigma unless otherwise indicated. All statistical comparisons were made with Statistica 11 software (Scientific Computing). Electrophysiological parameters and immunogold particle counts were compared by parametric ANOVA. For rise-time subselection analysis, all events and subselected events from the same cell were analyzed as repeated measures within the ANOVA. For pharmacology experiments, baseline and steady-state data from the same cell were analyzed as repeated measures within the ANOVA. Tukey's honest significant difference (HSD) test for unequal n was used as a post hoc test for significant main effect decomposition. Significance was taken as p < 0.05. All data are expressed as mean ± SD.
Results
Inhibitory synaptic currents in the absence of the GABAAR γ2 subunit
We injected Cre-GFP fusion protein-expressing adeno-associated viruses into the somatosensory cortex of 77I mice. Two weeks after injections, we performed whole-cell voltage-clamp recordings from the somata of layer 2/3 PCs in acute in vitro slices and observed spontaneously occurring mIPSCs in most recorded cells (Fig. 1). The frequency of mIPSCs in GFP- and Cre-recombinase-positive (77I Cre+) cells was significantly (p = 0.022; Tukey's unequal n HSD post hoc test of significant ANOVA main effects, subsequently referred to as Tukey's post hoc test) lower (1.5 ± 1.1 Hz; n = 20 cells) than in WT noninjected cells (6.1 ± 1.2 Hz; n = 4 cells), but was not significantly (p = 0.52; Tukey's post hoc test) different from GFP- and Cre-recombinase-negative (77I Cre−) cells found in and around the injection zone (2.6 ± 2.3 Hz; n = 36 cells). As controls, we recorded from WT mice 2 weeks after injection of the same virus and found that mean mIPSC frequency was unchanged in WT Cre− and WT Cre+ cells (5.8 ± 2.5 Hz; n = 4 cells, and 6.2 ± 3.8 Hz; n = 3 cells, respectively; p > 0.99 in both cases; Tukey's post hoc test) compared with WT noninjected cells.

Neocortical PCs lacking the GABAAR γ2 subunit display mIPSCs with altered kinetics. A, Continuous whole-cell voltage-clamp recordings from layer 2/3 PCs (top) and superimposed consecutive mIPSCs (bottom, averages in gray) color coded by experimental category. B, Averaged traces color coded by experimental category and peak scaled and peak aligned to highlight the slower decay kinetics of mIPSCs recorded from Cre+ cells in 77I mice. C, Summary of peak amplitude, 10–90% rise time, and τw of mIPSCs recorded in distinct experimental conditions. The mean τw of mIPSCs recorded from Cre+ cells in 77I mice is significantly slower than in all other conditions (***p < 0.00018 for 77I Cre+ vs all other groups; Tukey's unequal n HSD post hoc test). D–E, Examples of biocytin-filled PCs that are either immunonegative (D) or immunopositive (E) for Cre-recombinase. F, Inward currents in both Cre− and Cre+ 77I cells are completely blocked by the GABAAR antagonist SR95531. Scale bars: D and E, 20 μm.
Next, we examined the amplitude and kinetics of mIPSCs recorded in WT noninjected, WT Cre−, WT Cre+, 77I Cre−, and 77I Cre+ cells (Fig. 1B,C). Although some variability was evident in the peak amplitudes of mIPSCs among the different groups, they were not significantly different (p > 0.21 in all cases; Tukey's post hoc test). The 10–90% rise times were not different between groups (p = 0.18; one-way ANOVA). In contrast, the mean weighted decay time constant (τw) of mIPSCs recorded from 77I Cre+ PCs was significantly slower than that in all other groups (p < 0.0002 in all cases; Tukey's post hoc test), whereas the mean τw in the other groups was not significantly different from each other (p > 0.98 in all cases; Tukey's post hoc test). Although Cre negativity or positivity was initially judged based on the intrinsic GFP fluorescence in the acute slices, all cells were post hoc immunolabeled for Cre-recombinase and GFP using specific antibodies and the biocytin-filled cells were only accepted as Cre+ if they were post hoc confirmed to be immunopositive for Cre-recombinase (Fig. 1D,E).
In a subset of experiments, we applied SR95531 after the baseline recording period and observed complete elimination of mIPSCs in both 77I Cre− and 77I Cre+ PCs (Fig. 1F), demonstrating that these mIPSCs are mediated by GABAAR. However, we observed only very small shifts in holding currents in these experiments, indicative of negligible tonic currents (77I Cre−: 0.81 ± 1.50 pA, n = 7; 77I Cre+: −0.81 ± 0.42 pA, n = 3; p = 0.11, one-way ANOVA). We also calculated the SD of the baseline membrane current in each recorded cell (WT noninjected, 1.82 ± 0.35 pA; WT Cre−, 2.75 ± 1.78 pA; WT Cre+, 2.60 ± 1.16 pA; 77I Cre−, 2.20 ± 0.78 pA; 77I Cre+, 2.68 ± 1.04 pA) and found no significant difference (p = 0.26, one-way ANOVA).
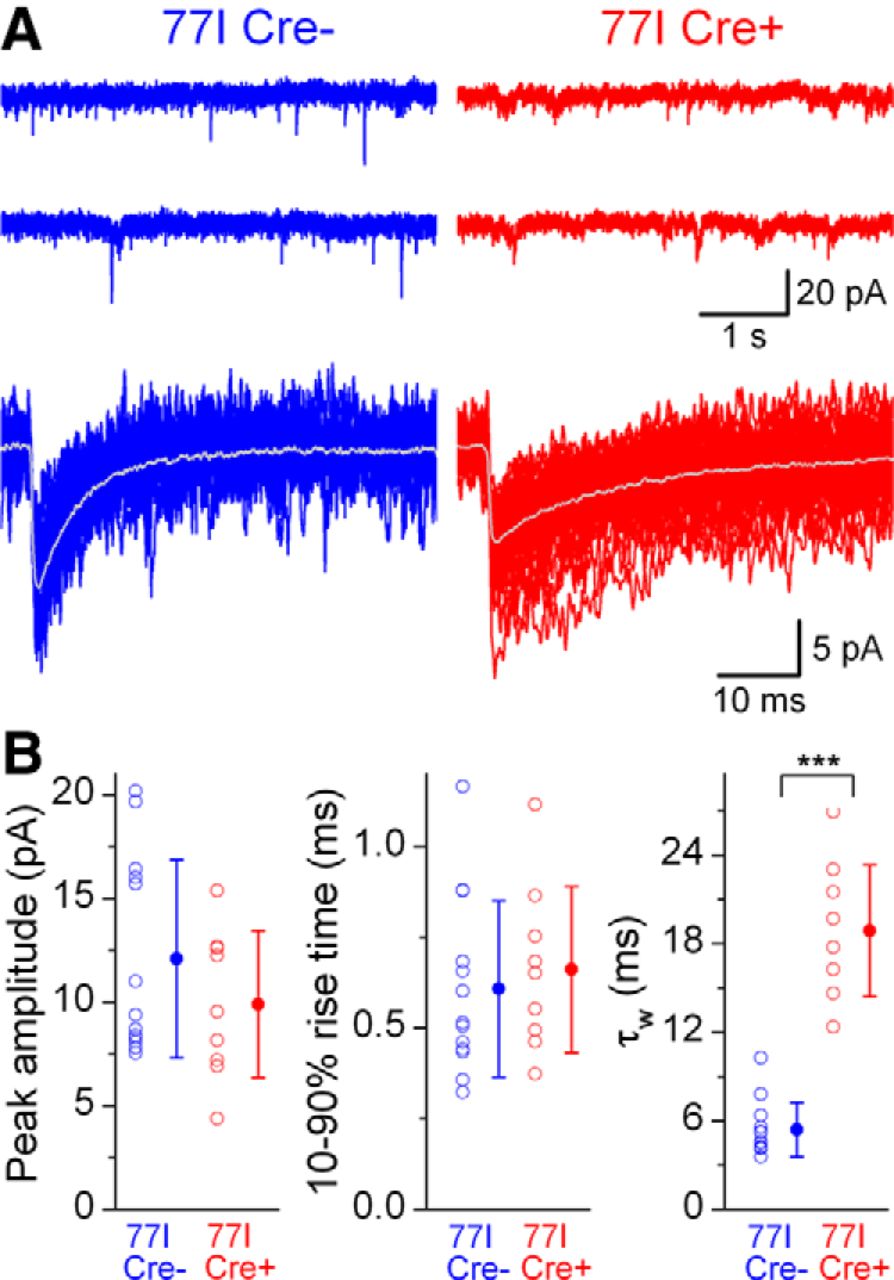
Although protein turnover is believed to be very fast under physiological conditions, the deletion of the γ2 gene with Cre-recombinase, and therefore the lack of new γ2 subunit synthesis, could drastically prolong the half-life of γ2 subunit proteins already present in the plasma membrane. To investigate whether the alterations described in the previous paragraphs at 2 weeks after injection undergo further changes, we conducted more mIPSC measurements 6 weeks after virus injection (Fig. 2A). The properties of mIPSCs in Cre− and Cre+ 77I PCs 6 weeks after injection were similar to those recorded from their 2 week postinjection counterparts, including their mean frequencies, peak amplitudes, and 10–90% rise times. Importantly, the prolongation of τw in 77I Cre+ PCs was comparable (p = 0.38; Tukey's post hoc test) 6 weeks (18.9 ± 4.5 ms) and 2 weeks (16.7 ± 4.3 ms) after injection (cf. Figs. 1C, 2B), indicating that the change in mean mIPSC τw is functionally indistinguishable in 77I Cre+ PCs at time points 2 weeks or longer after injection.

mIPSC decay in 77I Cre+ cells is also slow 6 weeks after virus injection. A, Continuous current traces (top) and superimposed consecutive mIPSCs (bottom) recorded from Cre− (left) and Cre+ (right) layer 2/3 PCs. B, Summary of peak amplitudes, 10–90% rise times, and τw of mIPSCs. τw of mIPSCs recorded from Cre+ PCs was significantly larger than that in Cre− PCs (***p < 0.00015; Tukey's unequal n HSD post hoc test).
Slowly decaying IPSCs are not the result of transmitter spillover and do not originate from distal synapses
To explain the mechanisms of the slower mIPSC decay kinetics in 77I Cre+ PCs, we tested the hypothesis that a severe dendritic filtering of distally originating synaptic currents is responsible for their slower decay. We subselected the mIPSCs with the fastest rise times from each cell, which would represent mIPSCs originating from synapses physically closest to the recording electrode. As can be seen from the individual examples from WT 77I Cre−, and 77I Cre+ cells (Fig. 3A), such subselection of the events with the fastest 10% of the 10–90% rise times did not substantially alter the resulting averaged traces. As expected, subselection reduced the 10–90% rise time across all groups, but statistical analysis (one-way ANOVA with subselection as a repeated measure; main effects, subselection, p < 0.0001; group, p = 0.22; subselection group interaction, p = 0.53) indicated that the 10–90% rise time in each group remained similar and that subselection did not have a differential effect on any one group, suggesting that most of our recorded mIPSCs are probably originating from perisomatic locations (Soltesz et al., 1995). The 10–90% rise times of the subselected mIPSCs in WT, 77I Cre− and 77I Cre+ cells were 0.32 ± 0.15 ms (n = 9), 0.32 ± 0.12 ms (n = 24), and 0.37 ± 0.14 ms (n = 6), respectively. These values are comparable to those obtained from electrotonically compact cells (Brickley et al., 1999), giving us further confidence that these subselected mIPSCs are originating from locations very close to the somatic recording electrode. In addition, the similar and very fast 10–90% rise time values argue against a spillover-mediated origin of the slowly decaying currents in 77I Cre+ cells or the involvement of neurogliaform cell-like volume transmission. Comparisons of the peak amplitude and τw between the rise time subselected and all mIPSCs resulted in no significant changes for 77I Cre− or Cre+ cells (p > 0.47 in all four cases; Tukey's post hoc test). After subselection, the mean τw in 77I Cre+ cells was still 3-fold slower than in 77I Cre− and WT cells (17.6 ± 6.2, 5.7 ± 2.0 and 6.3 ± 1.9 ms, respectively; Fig. 3B), suggesting that neither dendritic filtering nor spillover of GABA to extrasynaptic GABAARs prolonged the decay.

Slow decay kinetics of mIPSCs recorded from 77I Cre+ cells is not the consequence of dendritic filtering. A, Peak-scaled averaged traces of all recorded mIPSCs (black, blue, and red) and averaged traces of the fastest rising 10% of the events (gray) recorded from PCs in three experimental categories. B, Summary of mean mIPSC amplitude, 10–90% rise time, and τw of all events and the fastest 10% rising events. With the exception of the peak amplitude of WT cells (p = 0.0009; Tukey's unequal n HSD post hoc test), no significant effect of rise time subselection was found on the peak amplitude, rise time, or τw in any group. The slow decay of the mIPSCs in 77I Cre+ cells remained after rise time subselection despite the fact that the average 10–90% rise time of the subselected fast-rising mIPSCs was 0.37 ms, a value similar to that of mIPSCs recorded from small, electrotonically compact cells. Note that the average 10–90% rise times of the subselected fast-rising mIPSCs are very similar under the three experimental conditions.
Slowly decaying IPSCs are evoked by perisomatic-targeting interneurons
Our kinetic analysis with rise time subselection indicated that some of the mIPSCs should originate from synapses located close to the soma. To provide a more direct evidence for the perisomatic origin of IPSCs in 77I Cre+ PCs, we performed simultaneous recordings from synaptically coupled PCs and perisomatic-targeting fast-spiking interneurons (FSINs), which include parvalbumin-positive basket and axo-axonic cells. Recordings were made in the absence of TTX and cells were identified by their characteristic firing responses to long, depolarizing current injections as either FSINs or PCs (Fig. 4A,B). Using large amplitude, short duration current pulses in FSINs to evoke single action potentials, the connectivity and properties of unitary IPSCs (uIPSCs) were investigated in PCs in virus-injected 77I mice. In agreement with the variability in the decay of mIPSCs, FSIN-evoked uIPSCs had either fast (Fig. 4A) or slow (Fig. 4B) decay kinetics. When the postsynaptic PCs were post hoc identified, the Cre− PCs (Fig. 4C) consistently showed fast decay kinetics, whereas the Cre+ PCs (Fig. 4D) had slow uIPSCs. In addition, spontaneous IPSCs measured in these cells matched the kinetics of the evoked currents (data not shown), supporting the conclusion that most of the synapses of 77I Cre+ cells generate IPSCs with altered decay kinetics. From our simultaneous recording dataset, we calculated the probability of finding a connection from a FSIN to a PC in the virus injection zone and found that this was almost halved compared with noninjected animals (pooled from WT and 77I data; Fig. 4E). The mean success rate of connections did not differ between groups (p = 0.68; one-way ANOVA), although connections to Cre+ PCs showed greater variability [coefficient of variation (CV) = 0.51] compared with noninjected (CV = 0.36) or Cre− PCs (CV = 0.16). Mean response latency (p = 0.63; one-way ANOVA), peak amplitude (p = 0.115; one-way ANOVA), and 10–90% rise times (p = 0.846; one-way ANOVA) did not differ significantly between groups. The mean τw was significantly larger in 77I Cre+ cells (29.4 ± 8.4 ms; n = 4 connections) compared with 77I Cre− (9.7 ± 1.6 ms; n = 8 connections) and WT noninjected (7.2 ± 2.6 ms; n = 11 connections) cells (p < 0.0002 in both cases, Tukey's post hoc test), but the Cre− and noninjected groups were not different from each other (p = 0.41; Tukey's post hoc test). The lack of significant difference in the 10–90% rise time of uIPSCs between WT (0.79 ± 0.34 ms) and 77I Cre+ (0.84 ± 0.2) cells strongly suggests that the GABAARs activated by the synaptically released GABA are concentrated within the postsynaptic specialization in Cre+ PCs.
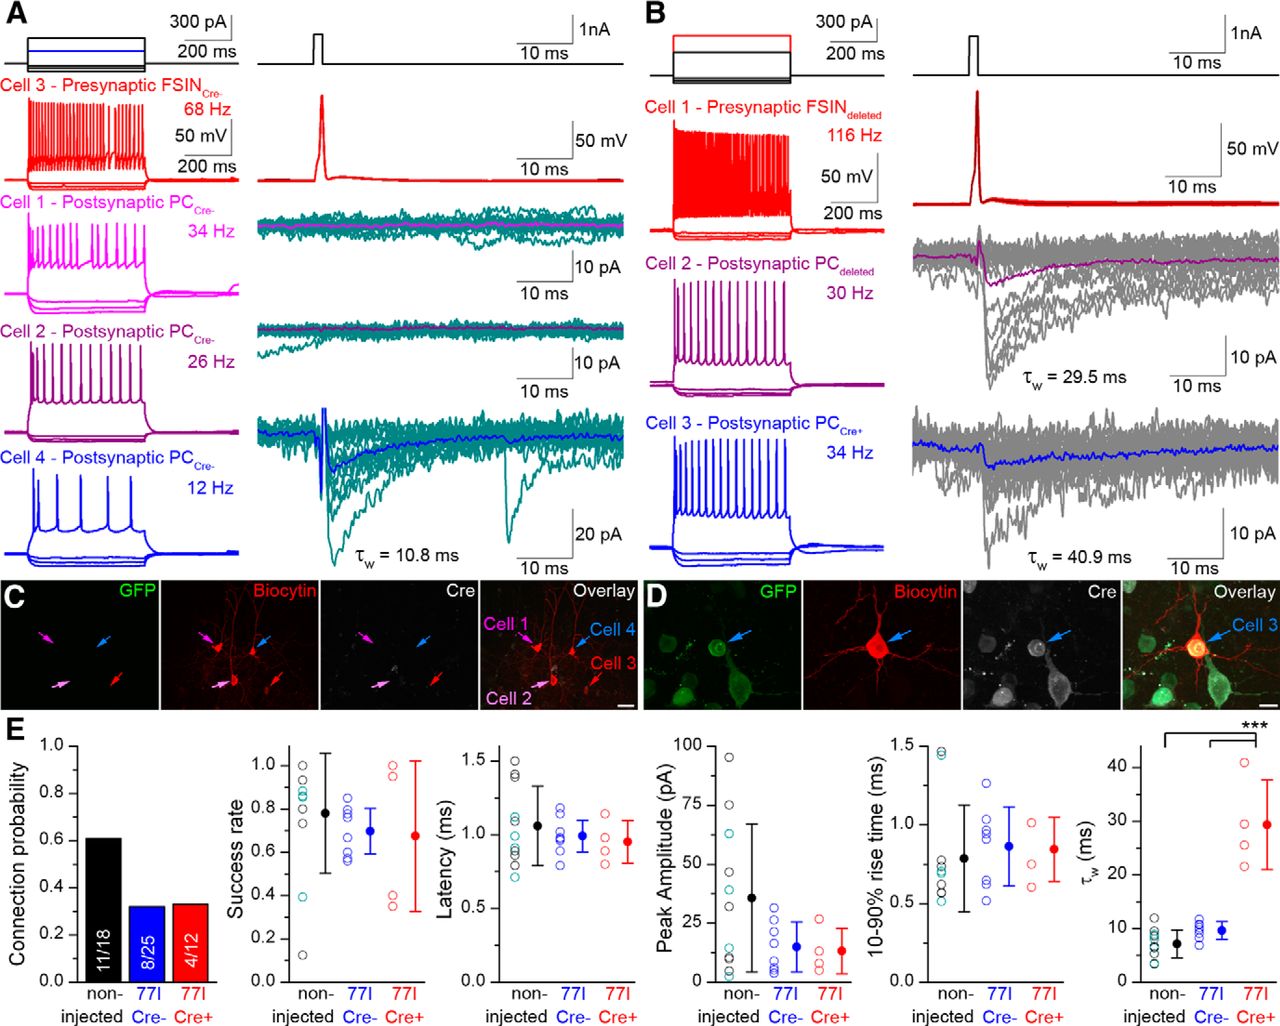
uIPSCs can be evoked by FSINs in layer 2/3 PCs. A, Firing patterns of 4 simultaneously recorded layer 2/3 neurons are shown on the left. Inhibitory connections were tested (right) by injecting a short current pulse (right, top) to elicit a single action potential in a FSIN (red, top) and postsynaptic responses were recorded in three PCs in the voltage-clamp configuration. In this quadruple recording, uIPSCs were detected in cell number 4 (blue, bottom) with a mean τw of 10.8 ms. B, A triple recording is shown with two postsynaptic PCs that were innervated by the presynaptic FSIN. The evoked, uIPSCs had slow τw in both PCs (29.5 and 40.9 ms). C–D, Immunofluorescent labeling for GFP (green), biocytin (red), and Cre-recombinase (cyan) are shown for the experiments shown in A and B. Note that in C, cell number 4 is Cre−, whereas in D, cell number 3 is Cre+. E, Summary of the properties of uIPSCs evoked by FSINs in PCs. Connection probability is decreased. Success rates, latencies, peak amplitudes, and 10–90% rise times were similar in 77I Cre−, 77I Cre+, and WT PCs (p = 0.115 or greater for all data; one-way ANOVA). The τw was significantly slower in Cre+ PCs compared with noninjected and Cre− PCs (one-way ANOVA; p = 0.0001 for both comparisons; Tukey's unequal n HSD post hoc test). Scale bars: C, 20 μm; D, 10 μm. Data from noninjected WT (black) and 77I (teal) animals are pooled.
IPSCs in Cre+ cortical interneurons have altered kinetics
So far, we have presented data obtained from in vitro recordings from layer 2/3 PCs. During the course of our experiments we also recorded from a variety of GABAergic interneurons (INs), which were post hoc identified by their dendritic and axonal arborizations. mIPSCs were readily detected in WT Cre+, 77I Cre−, and 77I Cre+ INs (Fig. 5A). Differences in the kinetics of mIPSCs recorded from 77I Cre+ INs were pronounced, which can be seen clearly from the overlay of peak-scaled averaged traces (Fig. 5B). Compared with WT Cre+ INs, 77I Cre+ INs showed a reduced mean peak amplitude (17.7 ± 5.6 pA vs 9.7 ± 2.9 pA; n = 8 and 37, respectively; p < 0.0003; Tukey's post hoc test). Although the 10–90% rise times were slightly increased (p = 0.041; one-way ANOVA), post hoc decomposition indicated no significant difference (0.42 ± 0.15 ms vs 0.60 ± 0.25 ms; p = 0.3; Tukey's post hoc test). In contrast, a dramatic ∼3-fold prolonged mean τw was observed in 77I Cre+ INs compared with WT Cre+ INs (19.8 ± 5.9 ms vs 7.0 ± 2.2 ms; p < 0.0002; Tukey's post hoc test). We also performed paired recordings between FSINs in 77I mice within the virus injection zone. In the single connection where the postsynaptic FSIN was Cre+, the mean τw of the uIPSCs was 18.8 ms (Fig. 5C), which was substantially slower than the mean τw of the two connections we obtained onto Cre− FSINs (4.4 and 8.8 ms). These results demonstrate that the alterations to synaptic GABAARs and the slowing of the decay of synaptic currents after γ2 subunit deletion are similar in 77I Cre+ PCs and INs.
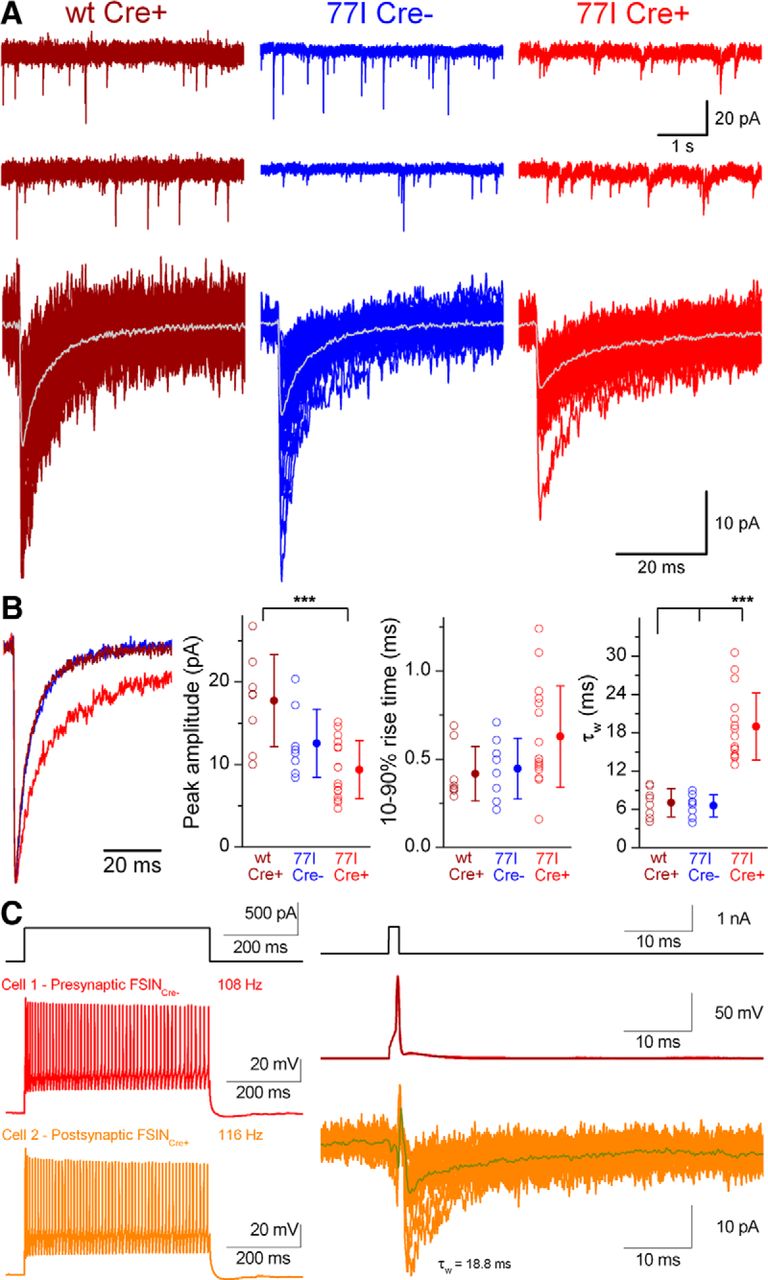
Deletion of the GABAAR γ2 subunit alters IPSC decay kinetics in cortical INs. A, Continuous current recordings of mIPSCs from layer 2/3 cortical INs (top) and superimposed consecutive mIPSCs (bottom, averages in gray). B, Averaged traces color coded by experimental category, peak scaled, and peak aligned to highlight the slower decay kinetics of mIPSCs recorded from a 77I Cre+ IN. Right, Summaries of peak amplitude and kinetic properties according to experimental category. Peak amplitude is significantly different between WT Cre+ and 77I Cre+ cells (***p = 0.0003, Tukey's unequal n HSD post hoc test). The τw of mIPSCs is significantly (***p < 0.00015 and p < 0.00013, respectively; Tukey's unequal n HSD post hoc test) slower in 77I Cre+ compared with 77I Cre− and WT cells. C, Left, Voltage responses to a 500 ms, 500 pA current injection (left) into two simultaneously recorded layer 2/3 FSINs. Inhibitory connections were tested by short current pulses (right, top) to elicit single action potentials in the presynaptic Cre− cell (red) and monosynaptically evoked unitary IPSCs are shown in the Cre+ postsynaptic cell (orange). The τw of the evoked IPSC is 18.8 ms.
Immunofluorescent labeling for GABAAR subunits indicates a selective loss of the γ2 subunit within the virus injection zone
Next, we investigated the effects of viral Cre expression on the abundance of different GABAAR subunits in the cortex of virus-injected 77I mice using immunofluorescent labeling. We observed strong immunoreactivity for Cre-recombinase in a localized region of the injected hemisphere (Fig. 6A), which overlapped with a strong reduction in immunoreactivity for the GABAAR γ2 subunit (Fig. 6A). When the corresponding noninjected contralateral hemisphere was examined, no change in the γ2 labeling intensity was detected (Fig. 6B). Upon examination of the virus injection zone at higher magnifications, many Cre+ nuclei were found with a greatly reduced immunosignal for the γ2 subunit in their surrounding somatic plasma membranes (Fig. 6C) compared with the strong, punctate γ2 labeling of the Cre− cells (Fig. 6C, arrows). In contrast, immunoreactivity for the α1 and β3 subunits appeared apparently unchanged within the Cre+ injection zone (Fig. 7A). When examined at higher magnifications, the somatic plasma membrane labeling for both the α1 and β3 subunits was punctate and of similar intensities for both Cre+ and Cre− putative PCs (Fig. 7B). We also observed putative GABAergic INs transfected with Cre-expressing viruses and their perisomatic plasma membranes remained strongly α1 immunopositive, although, as expected for this cell type, they were immunonegative for the β3 subunit (Fig. 7B, double asterisks).

Immunofluorescence labeling for the GABAAR γ2 subunit is dramatically reduced within the injection zone in 77I mice. A, Cre immunoreactivity (white) delineates the injection zone. Immunoreactivity for the γ2 subunit (red) is greatly reduced within this zone. B, Contralateral cortex shows no Cre immunolabeling (white) and strong γ2 immunoreactivity (red). C, High-magnification images of a Cre+ (*) and a Cre− (#) cell within the injection zone. Strong punctate clusters of γ2 immunoreactivity can be seen surrounding the Cre− cell (arrows), but not the Cre+ cell. Scale bars: A–B, 200 μm; C, 10 μm. Roman numerals indicate cortical layers.

Immunofluorescence labeling for the GABAAR α1 and β3 subunits is unchanged within the virus injection zone. A, Cre immunoreactivity (white) delineates the injection zone where immunoreactivity for the α1 (green) and the β3 (red) subunits is apparently unchanged. B, High-magnification images of cells immunonegative (#) and immunopositive (*, **) for Cre. In both Cre− and Cre+ cells, GABAAR labeling is often punctate (arrowheads and arrows), indicating the labeling of synaptic receptors. The lack of β3 puncta around a cell (**) suggests that this is a GABAergic interneuron that strongly expresses the α1 and β2 subunits, but not the β3 subunit. Note the GFP signal (green) in the nuclei of Cre+ cells as a result of the GFP-Cre fusion protein expression. Scale bars: A, 200 μm; B, 10 μm. Roman numerals indicate cortical layers.
Freeze-fracture replica immunogold labeling demonstrates the synaptic location of GABAAR subunits in 77I Cre+ cells
To provide direct evidence for the synaptic enrichment of GABAARs in γ2 subunit-lacking cells, we performed EM SDS-FRL of different GABAAR subunits (Figs. 8, 9). One limitation of this approach is that it cannot be used to visualize cytoplasmic or nuclear proteins because they are removed during the SDS treatment (“digestion”). However, based on our immunofluorescent data, the lack of the γ2 subunit seems to be a good indicator of the presence of Cre-recombinase in the nucleus. Therefore, we chose to assess the γ2 subunit density quantitatively in all somatic synapses of a given cell as a strategy to categorize it as γ2-negative (γ2−) or γ2-positive (γ2+), corresponding to Cre positivity or negativity, respectively. Paired recording experiments establishing that uIPSCs could originate from perisomatic synapses justify our strategy of concentrating on somatic synapses with SDS-FRL. Most of our antibodies against GABAAR subunits recognize extracellular epitopes and therefore label the E-face of the replica, where the intramembrane particle (IMP) clusters characteristic of GABAergic synapses are absent (Kasugai et al., 2010), making it difficult to delineate the border of a synapse. To delineate inhibitory synapses, we used the GABAergic synapse-specific cell adhesion molecule NL-2. Our NL-2 antibody recognizes intracellular epitopes and therefore labels the P-face of the replica. In the P-face, the aggregation of IMPs and the gold particle labeling NL-2 allowed the unequivocal identification and delineation of GABAergic synapses. This, however, necessitated the use of the mirror replica technique (Hagiwara et al., 2005): both sides of the fractured plasma membranes (E- and P-faces) had to be immunolabeled separately and then analyzed together. Although our physiological data demonstrated that alterations in the decay kinetics of mIPSCs were stabilized from 2 weeks after injection onwards, the possibility that some γ2 subunit proteins still remained in GABAergic synapses 2 weeks after injection prompted us to perform SDS-FRL on samples 6 weeks after injection. This provides a more rigorous test of the potential synaptic clustering of the α and β subunits in the complete absence of the γ2 subunit. Although our LM immunofluorescence data indicated the lack of the γ2 subunit in Cre+ cells, we first aimed to provide direct evidence of this using SDS-FRL.

SDS-FRL for the GABAAR γ2 and α1 subunits in cortical GABAergic perisomatic synapses 6 weeks after virus injection. A, P-face image of a layer 2/3 soma showing immunogold labeling for NL-2. The clusters of gold particles delineate GABAergic synapses. B, Complementary E-face of the same somatic membrane (mirror replica) shows strong immunogold labeling for the α1 (10 nm particles) and γ2 (5 nm particles) subunits. C, D, Higher-magnification images of the boxed areas outlined in A and B. E, F, Corresponding P- and E-face images of another soma from the same replica as shown in A–D containing NL-2 labeled synapses. Note the presence of strong immunogold labeling for the α1 subunit, but the complete lack of labeling for the γ2 subunit on the E-face. G–H, Higher-magnification images of the boxed areas outlined in E and F. I–K, Background-subtracted density values of synaptic immunogold labeling for NL-2 (I), γ2 (J), and α1 (K) subunits are shown for individual γ2+ (blue) and γ2− (red) cells with the respective population means (***p < 0.00001; one-way ANOVA). L, The mean area of γ2+ perisomatic synapses is significantly (***p < 0.001; one-way ANOVA) larger than that of γ2− perisomatic synapses. Data from two 77I mice were pooled. Scale bars: A, B, E, F, 200 nm; C, D, G, H, 100 nm.

Immunogold labeling for the GABAAR γ2 and β3 subunits in cortical GABAergic somatic synapses 6 weeks after virus injection A, P-face image of a layer 2/3 soma showing immunogold labeling for NL-2 (10 nm particles) and the β3 subunit (5 nm particles). B, Complementary E-face of the same somatic membrane (mirror replica) showing strong immunogold labeling for the γ2 subunit. C, D, Higher-magnification images of the boxed areas shown in A and B. E–F, Images of the P- and E-faces of another soma from the same replica as shown in A–D containing synapses immunolabeled for NL-2 (10 nm particles) and the β3 subunit (5 nm particles), but devoid of labeling for the γ2 subunit. G, H, Boxed synapse shown at a higher magnification. I–K, Background-subtracted density values of synaptic labeling for NL-2 (I), γ2 (J), and β3 (K) subunits are shown for individual γ2− (red) and γ2+ (blue) cells with the respective population means (***p < 0.0001; one-way ANOVA). L, Area of somatic synapses is reduced by 39% (***p < 0.001; one-way ANOVA) in the γ2− (red) compared with γ2+ (blue) cells. Data from two 77I mice were pooled. Scale bars: A, B, E, F, 200 nm; C, D, G, H, 100 nm.
In all randomly selected somata within the virus-injected area of 77I mice, we detected many strongly NL-2 immunolabeled IMP clusters, demonstrating that GABAergic synapses must be present in both virus-transfected and nontransfected cells (Figs. 8A,E, 9A,E). We then examined the γ2 subunit in the same randomly selected cells. Each cell was categorized by calculating the mean synaptic γ2 density from all synapses found on its fractured somatic membrane (Figs. 8A–H, 9A–H). As can be seen in Figures 8J and 9J, the cells fell into two clear populations: some had a γ2 density close to zero (2.0 ± 6.3 gold/μm2 with the rabbit anti-γ2 antibody, Fig. 9J; 10.9 ± 13.9 gold/μm2 with the guinea pig anti-γ2 antibody, Fig. 8J; all values are background subtracted), whereas the other half of the cells had densities either ∼180 gold/μm2 using our guinea pig anti-γ2 antibody or ∼1000 gold/μm2 with the rabbit anti-γ2 antibody. These results provide evidence that the absence or presence of the γ2 subunit can be used to categorize the cells within the injection zone as putative Cre+ or Cre−. Once each cell was categorized as γ2− or γ2+, we investigated the size of GABAergic synapses and the density of NL-2 and GABAAR α1 and β3 subunits in these two cell populations (Figs. 8, 9).
First we examined the density of NL-2 in γ2− and γ2+ cells and found no significant difference regardless of whether NL-2 was labeled on its own (p = 0.517; one-way ANOVA; Fig. 8A–I) or if it was double labeled (p = 0.474; one-way ANOVA) with the β3 subunit (Fig. 9A–I). Immunogold particles for the GABAAR α1 (Fig. 8A–H) and β3 (Fig. 9A–H) subunits were concentrated in NL-2-positive synapses in all but one of the examined cells regardless of whether the synapse was immunopositive or negative for the γ2 subunit, providing direct evidence for the synaptic enrichment of GABAARs without the γ2 subunit. In one cell, all synapses were β3-negative, indicating that the somatic plasma membrane likely belonged to a β3-immunonegative GABAergic IN. Quantitative analysis revealed a slightly reduced labeling density for both the α1 (Fig. 8K) and β3 (Fig. 9K) subunits, but the differences were not statistically significant (p = 0.074 and p = 0.062, respectively; one-way ANOVA). The fact that the area of GABAergic somatic synapses was significantly (p < 0.027; Tukey's post hoc test) smaller in γ2− cells (0.018 ± 0.008 μm2; n = 113 synapses on 21 cells from two mice, pooled across α1 and β3 subunit experiments; cf. Figs. 8L, L) compared with γ2+ cells (0.025 ± 0.014 μm2; n = 239 synapses on 18 cells from two mice, pooled across α1 and β3 subunit experiments; cf. Figs. 8L, 9L) shows that the total number of synaptic NL-2, α1, and β3 subunits is somewhat reduced in 77I Cre+ cells.
Pharmacological examination of the subunit composition of GABAARs in 77I Cre+ cells
So far, we have provided direct evidence that some GABAARs remain localized in somatic GABAergic synapses in 77I Cre+ cortical neurons in the total absence of the γ2 subunit and that these receptors contain at least the α1 and β3 subunits. In the final sets of experiments, we aimed to gain insights into the subunit composition of GABAARs underlying the altered mIPSCs in 77I Cre+ cells using specific pharmacological tools.
First, the lack of the γ2 subunit was tested. It is well known that the γ2 subunit is required for benzodiazepine modulation of GABAARs (Pritchett et al., 1989); a relatively low concentration of benzodiazepine agonist should only affect γ2-subunit-containing receptors. Therefore, we applied 5 μm flurazepam (Fig. 10) to 77I Cre− and Cre+ cells and tested its effect on mIPSCs. This low concentration of flurazepam increased the amplitude (14.9 ± 7.9 vs 17.8 ± 9.4 pA; p = 0.002; Tukey's post hoc test) and prolonged the decay (6.9 ± 1.8 vs 9.2 ± 2.2 ms; p < 0.0002; Tukey's post hoc test) of mIPSCs in Cre− cells (n = 13), consistent with the presence of flurazepam-sensitive γ2 subunits. In contrast, no significant effect was detected on either the amplitude (11.9 ± 3.56 pA vs 12.6 ± 3.7 pA; p = 0.74; Tukey's post hoc test) or the decay (16.8 ± 4.6 ms vs 16.7 ± 4.3 ms; p = 0.92; Tukey's post hoc test) of mIPSCs in 77I Cre+ cells (n = 23), confirming the lack of γ2 subunits in these virus-transfected cells.

Pharmacological properties of mIPSCs recorded from Cre− and Cre+ cells. Representative peak-scaled averaged IPSCs recorded from individual cells before (Cre−, blue; Cre+, red) and after (Cre−, teal; Cre+, dark red) bath application of either ACSF or ACSF containing 5 μm flurazepam, 10 μm Zn2+, 100 nm THDOC, or 10 μm DMCM. Right, Summary of mIPSC peak amplitudes and τw for individual cells and the group averages before and after drug application. Peak amplitudes were only significantly increased by 5 μm flurazepam in Cre− cells (***p = 0.003). All groups showed a significant (p < 0.0001 in all cases) difference in τw between Cre− and Cre+ baseline conditions. Flurazepam (5 μm) significantly slowed τw in Cre− cells (***p = 0.0013). Zn2+ significantly slowed down (***p < 0.0001) and DMCM speeded up (***p < 0.0001) the decay of mIPSCs in Cre+ cells. Data were compared using one-way rm-ANOVA. All significance values were calculated using Tukey's unequal n HSD post hoc test. Triangles indicate PCs, circles indicate INs, squares indicate unidentified cells.
After the removal of the γ2 subunit, probably the simplest conceivable possibility is that the remaining α and β subunits form αβ-only heteropentameric channels. Because such αβ-only receptors are functional in expression systems and have been suggested to occur in neurons in situ (Mortensen and Smart, 2006), we investigated whether such receptors were present by taking advantage of their specific inhibition by low concentrations of Zn2+ (Draguhn et al., 1990; Smart et al., 1991; Krishek et al., 1998). When we added 10 μm ZnCl2 to the ACSF, we observed no change in mean frequencies [p = 0.25; one-way ANOVA with repeated measures (rm-ANOVA) interaction effect] or peak amplitudes (p = 0.28; rm-ANOVA interaction effect) either in Cre− (3.7 ± 2.5 vs 5.0 ± 2.7 Hz; 11.5 ± 5.5 vs 11.6 ± 5.3 pA; n = 11) or Cre+ (1.6 ± 1.0 vs 1.9 ± 1.2 Hz; 7.5 ± 2.4 vs 6.7 ± 2.9 pA; n = 8) cells, arguing against the presence of a significant population of αβ-only postsynaptic GABAARs in the absence of the γ2 subunit. Unexpectedly, however, the mean τw in 77I Cre+ cells was significantly prolonged after Zn2+ application (15.5 ± 2.2 vs 20.4 ± 3.1 ms; p = 0.0002; Tukey's post hoc test), but this effect was not seen in Cre− cells (6.3 ± 1.5 vs 6.2 ± 1.6 ms; p = 0.96; Tukey's post hoc test). Because Zn2+ may be easily chelated in PB solutions, we also repeated these experiments in HEPES-buffered ACSF with 1 μm ZnCl2 and found a similar prolongation of τw but no effect on mIPSC frequency or peak amplitude (data not shown). We could not explain this decay prolongation by Zn2+ based on available published data. However, the important point is that if αβ-only channels were responsible for the slow decay of IPSCs in 77I Cre+ cells, then they should have been blocked by Zn2+ and therefore the mean mIPSC frequency and amplitude should have been reduced. If the remaining synaptic GABAARs are not αβ-only channels, it is possible that a different GABAAR subunit took the place of the γ2 subunit in the pentameric channels.
First, we investigated whether the γ2 subunit was replaced with the δ subunit, which is known to have a higher affinity for GABA and much longer single-channel openings, and could therefore underlie the prolonged τw (Saxena and Macdonald, 1994). However, application of 100 nm THDOC, a δ-subunit-selective positive allosteric modulator (Mihalek et al., 1999; Stell et al., 2003), did not alter τw in either Cre− or Cre+ cells (6.8 ± 1.6 vs 6.6 ± 1.8 ms; n = 6, and 23.3 ± 5.6 vs 23.9 ± 6.8 ms; n = 9; p = 0.33; rm-ANOVA interaction effect; Fig. 10). In addition, no effect was seen for DS2 (Wafford et al., 2009), another modulator specifically acting at δ-subunit-containing GABAAR (data not shown), ruling out the possibility of a γ2/δ swap in synaptic GABAARs after Cre-dependent removal of the γ2 subunit.
Evidence indicates that ε-subunit-containing GABAAR show slow deactivation upon rapid GABA application to outside-out patches (Wagner et al., 2005), similar to δ-subunit-containing receptors, making this subunit another potential candidate. The pyrazolopyridine tracazolate has been shown to inhibit selectively the responses of ε-subunit-containing recombinant receptors to GABA application, potentiating all other combinations, including αβ-only-, γ1-3-, and especially δ-subunit-containing GABAARs (Thompson et al., 2002). Upon application of tracazolate, statistical analysis indicated that mean mIPSC frequencies were unchanged in both Cre− and Cre+ cells (0.6 ± 0.2 vs 1.2 ± 0.9 Hz and 1.8 ± 1.0 vs 2.7 ± 1.4 Hz, respectively; n = 3 for each group; p = 0.61; rm-ANOVA interaction effect). In addition, no significant effect on mean peak amplitudes in either Cre− or Cre+ cells was observed (11.2 ± 3.7 vs 11.1 ± 4.3 pA and 12.1 ± 2.7 vs 11.1 ± 1.1 pA; p = 0.41; rm-ANOVA interaction effect). Furthermore, a modest increase in mean τw was seen in both Cre− (7.7 ± 1.9 vs 8.9 ± 1.7 ms; p = 0.024; Tukey's post hoc test) and Cre+ (11.9 ± 2.0 vs 14.1 ± 1.5 ms; p = 0.003; Tukey's post hoc test) cells, indicating positive allosteric modulation of the receptors underlying the mIPSCs and arguing against the involvement of the ε subunit.
Studies using the β-carboline DMCM in expression systems have shown that receptors containing the γ1 subunit are potentiated by this compound, whereas receptors containing the γ3 subunit, and to a lesser extent the γ2 subunit, are inhibited (Wafford et al., 1993; Ebert et al., 1994; Hadingham et al., 1995). Importantly, the inhibitory effect of DMCM in GABAAR containing the γ277I point mutation is not observed (Ogris et al., 2004; Ramerstorfer et al., 2010), allowing us to distinguish selectively between γ1 and γ3 subunits by potentiation or inhibition, respectively. Upon wash-in of DMCM, we observed no effect on mean frequencies, mean peak amplitudes, or 10–90% rise times in either cell group (p = 0.085, p = 0.34, and p = 0.79, respectively; rm-ANOVA interaction effect). However, mean τw was significantly reduced in Cre+ cells (15.9 ± 5.7 vs 8.6 ± 3.5 ms; n = 8; p < 0.0002; Tukey's post hoc test) but not in Cre− cells (6.5 ± 1.5 vs 6.3 ± 1.4 ms; n = 19; p = 0.66; Tukey's post hoc test). The negative allosteric modulation, rather than potentiation, by DMCM argues against the presence of the γ1 subunit and is consistent with the presence of the γ3 subunit at these synaptic receptors.
Discussion
In this study, we investigated the effects of temporally and spatially restricted Cre-recombinase-mediated deletion of the GABAAR γ2 subunit gene and found that inhibitory synaptic currents remained in Cre+, γ2-subunit-lacking cortical neurons. These currents occurred less frequently, had similar peak amplitudes and rise times but slower decay kinetics compared with those recorded from Cre− and WT γ2-subunit-containing cells. Electron microscopic SDS-FRL experiments provided direct evidence that, despite the removal of the γ2 subunit, the α1 and β3 subunits remained concentrated in inhibitory synapses. Furthermore, our pharmacological experiments indicated that the subunit composition of the synaptic receptors was αβγ3, rather than αβ-only, αβδ, αβε, or αβγ1.
Despite the fact that the γ2 subunit is a component of most synaptic GABAARs in the brain, our data demonstrate that it is not essential for inhibitory synaptic transmission and postsynaptic receptor clustering in nerve cells of the adult somatosensory cortex. Previous reports examining cultured cortical cells derived from γ20/0 animals (Essrich et al., 1998; Sumegi et al., 2012) or from animals engineered with a conditional γ2 deletion (Schweizer et al., 2003) have shown strong reductions in clustered immunofluorescent labeling for the γ2, α1, and α2 subunits and gephyrin, although γ20/0 animals show no change in the overall expression levels of GABAAR α subunits (Günther et al., 1995). Our immunofluorescence data demonstrated a dramatic reduction of the γ2 but no change in α1 and β3 subunit immunolabeling intensity in the virus injection zone. Although we performed our immunofluorescence labeling under conditions that allow the visualization of synaptic receptors (see Materials and Methods), the clustered labeling of the α1 and β3 subunits along the plasma membrane of Cre+ cells does not provide unequivocal evidence that the clusters corresponded to synapses. To show this, we used EM SDS-FRL, a technique that has a high resolution and sensitivity. We used immunolabeling for NL-2, a cell adhesion molecule that is believed to be present exclusively in GABAergic synapses, to molecularly identify postsynaptic membranes. In these molecularly identified postsynaptic membranes of γ2− cells, the densities of the α1 and β3 subunits were comparable to those found in their γ2+ counterparts.
Although the measured densities of the α1 and β3 subunits were not significantly different, their absolute number per synapse was reduced in γ2− compared with γ2+ cells due to the smaller synaptic areas. This is in contrast to the lack of change in mean mIPSC peak amplitude in 77I Cre+ cells. The mean uIPSC peak amplitudes were also not significantly different, indicating a higher postsynaptic receptor occupancy in 77I Cre+ cells. A similarly unexplainable alteration is the reduced connection probability between FSINs and both 77I Cre− and 77I Cre+ PCs in the injection zone. These changes indicate that, even if our virus-mediated deletion of the γ2 gene is confined to a very small part of the neocortex and is induced in an almost fully developed animal, there must be some alterations in network connectivity that go beyond the straightforward removal of the γ2 subunit from the synapses of a subpopulation of cells. This change in network connectivity might be taken as evidence for the enormous plastic capacity of the cortex and should alert investigators that even the slightest genetic manipulation could result in unexpected, potentially compensatory changes in cortical networks.
All previous studies examining the role of γ2 subunits in synaptic receptor localization have reported that some of the γ2-subunit-lacking neurons exhibited IPSCs (Essrich et al., 1998; Baer et al., 1999; Sumegi et al., 2012). “Synaptic-like” currents could, in principle, originate from the rapid, synchronous activation of postsynaptic receptors by synaptically released transmitter or by the activation of extrasynaptic receptors either upon neurotransmitter spillover or after ectopic release. Therefore, the presence of synaptic-like currents cannot be taken as evidence for postsynaptic receptor accumulation. None of the previous studies performed detailed kinetic analysis nor evoked unitary IPSCs from identified presynaptic INs. Our present physiological data argues against a spillover origin of the IPSCs in Cre+ cells. The 10–90% rise time of IPSCs recorded in electrotonically compact cerebellar granule cells is ∼300 μs at temperatures similar to that used in the present study (Brickley et al., 1999). Our rise-time-subselected mIPSCs had average rise times of ∼320 μs in WT and 77I Cre− cells, consistent with their perisomatic and synaptic origin. The slowly decaying mIPSCs in 77I Cre+ cells also had rise times of ∼370 μs, which was not significantly slower than those recorded in WT and Cre− cells, arguing for their perisomatic and synaptic origin. The fact that unitary IPSCs could be evoked by perisomatic-targeting FSINs is also consistent with the presence of functional synapses in perisomatic regions. We believe that these functional data, together with our EM immunogold demonstration of the enrichment of the α1 and β3 subunits in somatic GABAergic synapses, provide unquestionable evidence for the synaptic enrichment of GABAARs without the γ2 subunit in cortical cells.
The decay kinetics of unitary and miniature IPSCs in Cre+ cells are substantially slower than those recorded from control cortical cells. Because of their very fast rise times and because they could be evoked by single action potentials of GABAergic FSINs that target the perisomatic region of their postsynaptic PCs, we concluded that the slow decay cannot be the consequence of dendritic filtering. In other words, not only did the somatically recorded currents have slow decay, but the underlying synaptic conductance was also slower in γ2− than in γ2+ cells. What factors determine the decay kinetics of the synaptic currents? The spatiotemporal profile of GABA at the site of the receptors is a key parameter. Because the rise times of the subselected mIPSCs are similarly fast in Cre− and Cre+ cells, it is unlikely that the GABA concentration profile would be substantially slower in Cre+ cells. If the spatiotemporal profile of GABA is similar, then the binding and gating kinetics of the postsynaptic receptors should be different. It is well known that the microscopic kinetic properties of GABAARs critically depend on their subunit composition. Therefore, we sought to determine the subunit composition of the receptors in Cre+, γ2-subunit-lacking cells. A series of pharmacological experiments indicated that the most likely subunit composition is αβγ3, rather than αβ-only, αβδ, αβε, or αβγ1. This conclusion is consistent with that of Baer et al. (1999), who demonstrated that the transgenic overexpression of the γ3 subunit could rescue the synaptic clustering of the α1 and α2 subunits and gephyrin in γ20/0 mice, although this transgenic overexpression does not alleviate the lethal phenotype. We would like to emphasize that although we detected the α1 and β3 subunits in somatic synapses of γ2− cells, this does not exclude the presence of other α and β subunits (i.e., α2 and β2) likely to be present at these synapses. We must also point out that the direct immunohistochemical demonstration of the γ3 subunit in somatic synapses was unobtainable due to the lack of suitable specific antibody labeling against the γ3 subunit. Unfortunately, there are no available data regarding the deactivation kinetics of γ3-subunit-containing GABAARs after ultra-fast GABA application with a time course comparable to synaptic neurotransmitter release. However, affinity correlates with agonist unbinding rates, and thus receptor deactivation (Jones et al., 1998), and can be used to predict macroscopic synaptic current kinetics. Previous studies indicate that the presence of different variants of the α subunit (Barberis et al., 2007; Picton and Fisher, 2007; Eyre et al., 2012) mainly dictate differences in receptor kinetics. This correlates with the range of GABA affinities of different α-subunit-containing receptors (Böhme et al., 2004), whereas there is only a 2-fold difference between the affinities of receptors with different β subunits (Hadingham et al., 1993). Published data indicate that γ3-subunit-containing receptors have a 3- to 7-fold greater affinity for GABA than γ2-subunit-containing receptors (Ebert et al., 1994; Ducić et al., 1995). Therefore, as the most likely scenario, we suggest that it is the incorporation of the γ3 subunit that is responsible for the 3-fold slowing of the decay of the IPSCs in Cre+, γ2-subunit-lacking cells.
In addition to being a γ2 surrogate under adverse conditions, the γ3 subunit may offer neurons flexibility in the control of their synaptic inhibition under normal circumstances, blending with γ2-subunit-containing receptors to fine-tune inhibitory synaptic kinetics to different requirements. The γ3 subunit is expressed at low levels in the neocortex and hippocampus and more strongly in regions such as the olfactory bulb, basal ganglia, hypothalamus, and brainstem (Herb et al., 1992; Pirker et al., 2000), where longer-duration synaptic inhibition may be a requirement for appropriate synaptic integration or oscillatory dynamics. It is also noteworthy that γ3-subunit-containing receptors are much less modulated by flunitrazepam, diazepam, zolpidem, and flurazepam (Herb et al., 1992; Hadingham et al., 1995; Fig. 10), but other compounds that have higher selectivity for the γ3 subunit might offer opportunities for selective pharmacological intervention in brain structures that express this subunit highly.
Footnotes
M.D.E. is the recipient of a János Bolyai Scholarship from the Hungarian Academy of Sciences. Z.N. is the recipient of Project Grants from the Wellcome Trust (WT094513), a Hungarian Academy of Sciences Momentum Grant (Lendület, LP2012-29), and a European Research Council Advanced Grant. We thank Dóra Rónaszéki, Éva Dobai, and Bence Kókay for excellent technical assistance; Prof. William Wisden and Peer Wulff for providing the GABAARγ277Ilox mice; Profs. Jean-Marc Fritschy and Werner Sieghart for kindly providing GABAAR subunit-specific antibodies; and Prof. Jean-Marc Fritschy for comments on the manuscript.
The authors declare no competing financial interests.
This is an Open Access article distributed under the terms of the Creative Commons Attribution License (http://creativecommons.org/licenses/by/3.0), which permits unrestricted use, distribution and reproduction in any medium provided that the original work is properly attributed.
- Correspondence should be addressed to Zoltan Nusser or Mark D. Eyre, Laboratory of Cellular Neurophysiology, Institute of Experimental Medicine, Szigony str. 43, Budapest 1083, Hungary, nusser{at}koki.hu or eyre{at}koki.hu
This article is freely available online through the J Neurosci Author Open Choice option.


