

Abstract
Impulsive personality traits are complex heritable traits that are governed by frontal-subcortical circuits and are associated with numerous neuropsychiatric disorders, particularly drug abuse and attention-deficit/hyperactivity disorder (ADHD). In collaboration with the genetics company 23andMe, we performed 10 genome-wide association studies on measures of impulsive personality traits [the short version of the UPPS-P Impulsive Behavior Scale, and the Barratt Impulsiveness Scale (BIS-11)] and drug experimentation (the number of drug classes an individual had tried in their lifetime) in up to 22,861 male and female adult human research participants of European ancestry. Impulsive personality traits and drug experimentation showed single nucleotide polymorphism heritabilities that ranged from 5 to 11%. Genetic variants in the CADM2 locus were significantly associated with UPPS-P Sensation Seeking (p = 8.3 × 10⁻⁹, rs139528938) and showed a suggestive association with Drug Experimentation (p = 3.0 × 10⁻⁷, rs2163971; r2 = 0.68 with rs139528938). Furthermore, genetic variants in the CACNA1I locus were significantly associated with UPPS-P Negative Urgency (p = 3.8 × 10⁻⁸; rs199694726). The role of these genes was supported by single variant, gene- and transcriptome-based analyses. Multiple subscales from both UPPS-P and BIS showed strong genetic correlations (>0.5) with Drug Experimentation and other substance use traits measured in independent cohorts, including smoking initiation, and lifetime cannabis use. Several UPPS-P and BIS subscales were genetically correlated with ADHD (rg = 0.30–0.51), supporting their validity as endophenotypes. Our findings demonstrate a role for common genetic contributions to individual differences in impulsivity. Furthermore, our study is the first to provide a genetic dissection of the relationship between different types of impulsive personality traits and various psychiatric disorders.
SIGNIFICANCE STATEMENT Impulsive personality traits (IPTs) are heritable traits that are governed by frontal-subcortical circuits and are associated with neuropsychiatric disorders, particularly substance use disorders. We have performed genome-wide association studies of IPTs to identify regions and genes that account for this heritable variation. IPTs and drug experimentation were modestly heritable (5–11%). We identified an association between single nucleotide polymorphisms in CADM2 and both sensation seeking and drug experimentation; and between variants in CACNA1I and negative urgency. The role of these genes was supported by single variant, gene- and transcriptome-based analyses. This study provides evidence that impulsivity can be genetically separated into distinct components. We showed that IPT are genetically associated with substance use and ADHD, suggesting impulsivity is an endophenotype contributing to these psychiatric conditions.
Introduction
Impulsive personality traits (IPTs) are complex, multidimensional traits (Evenden, 1999; Nigg, 2000; Friedman and Miyake, 2004; Winstanley, 2007; Bari and Robbins, 2013; Jentsch et al., 2014; Dalley and Robbins, 2017) that are associated with the risk for several major neuropsychiatric disorders, including substance use disorders. In addition, IPTs influence temporally distinct stages of drug abuse, from experimentation to dependence (Verdejo-García et al., 2008; de Wit, 2009).
Self-report questionnaires are commonly used to quantify IPTs in normal adults and patient populations. The Impulsive Behavior Scale, UPPS-P (Whiteside and Lynam, 2001; Cyders et al., 2014), and the Barratt Impulsiveness scale, BIS-11 (Patton et al., 1995), are arguably the two most common questionnaires. Despite evidence from twin and family studies showing that IPTs are moderately heritable (40–60%; Pedersen et al., 1988; Hur and Bouchard, 1997; Seroczynski et al., 1999; Bezdjian et al., 2011; Gustavson et al., 2014), it has proven difficult to identify specific genes that influence impulsivity (Bevilacqua and Goldman, 2013; Fineberg et al., 2018). Candidate gene studies have reported various associations between polymorphisms in specific genes and measures of IPT including UPPS-P and BIS (for a list of previously associated a priori loci, see Gray et al., 2018), but those results have generally failed to replicate. The largest prior study of the genetic basis of the trait impulsivity in the UPPS-P and BIS used 983 healthy young individuals of European ancestry (Gray et al., 2018) and was thus underpowered.
In collaboration with the personal genetics company 23andMe, we performed the largest genome-wide association study (GWAS) of IPTs to date using scores from the UPPS-P and BIS-11 questionnaires in up to 22,861 research participants. IPTs, although conceptually related, are believed to be independent constructs (Reynolds et al., 2006; MacKillop et al., 2016), with distinct underlying neurobiological and neurochemical substrates (Dalley et al., 2011; Dalley and Robbins, 2017). Therefore, we hypothesized that different facets of impulsivity among the UPPS-P and BIS-11 would show both a modest overlap and distinct genetic architecture. Furthermore, different IPT dimensions may have a different role in various forms of psychopathology. For example, different facets of impulsivity may influence different stages of drug abuse, including experimentation, acquisition of regular drug use, progression to addiction, failure to quit, and risk of relapse (Verdejo-García et al., 2008; de Wit, 2009; Ersche et al., 2010, 2013; Winstanley et al., 2010). To directly examine differential genetic influences on impulsivity that may contribute to early stages of drug use initiation, we also performed a GWAS on level of drug experimentation, which quantifies the number of drug classes that an individual has tried in their lifetime. These GWASs were then extended with gene- and transcriptome-based analyses. Finally, we examined the genetic correlation among the IPTs and drug experimentation, as well as genetic correlations with related phenotypes in archival datasets.
Materials and Methods
Sample.
All participants included in the analyses were drawn from the customer base of 23andMe, a consumer genetics company. Participants provided informed consent and answered surveys online under a protocol approved by Ethical and Independent Review Services, an independent AAHRPP-accredited institutional review board (http://www.eandireview.com). We restricted our analysis to unrelated participants of European ancestry (>97% as determined through an analysis of local ancestry; Durand et al., 2014; see Extended Data for additional details) for whom UPPS-P, BIS, and drug experimentation data were available. The final number of research participants included in the analyses range from 21,495 to 22,861. Recruitment occurred over an ∼4 month period in 2015. This sample has been extensively described previously (Sanchez-Roige et al., 2018, 2019b). Sociodemographic details are described in Table 1.
Demographic characteristics of the 23andMe cohort
Self-reported impulsivity traits.
To measure IPTs we used four subscales from the 20-item UPPS-P Impulsive Behavior Scale (brief version; Whiteside and Lynam, 2001; Cyders et al., 2014): (lack of) Premeditation, (lack of) Perseverance, Positive Urgency and Negative Urgency, and Sensation Seeking. Each subscale includes four items and yields integer scores from 4 to 16. We also administered the BIS-11 (Patton et al., 1995), a 30-item measure that gives a total impulsivity score and three subscores of Attentional, Motor, and Nonplanning impulsiveness. We used UPPS-P and BIS because they represent the most commonly used multifaceted measures of IPTs. Because the scores were not normally distributed across these measures (by visual inspection; Table 1-1), we used a quantile normalization before GWAS analyses.
Drug experimentation.
The measure of Drug Experimentation quantifies the number of 11 different classes of drugs an individual has used [tobacco (cigarettes, cigars, chewing tobacco), alcohol, marijuana, cocaine, methamphetamine, LSD/magic mushrooms, ecstasy, prescription stimulants (taken not as prescribed; e.g., Ritalin, Adderall, Strattera), prescription painkillers (taken not as prescribed; e.g., Vicodin, OxyContin), heroin, opium]; this measure yields scores from 0 to 11, and was adapted from the PhenX toolkit (https://www.phenxtoolkit.org/; VanderBroek et al., 2016). We used quantile normalization because scores were not normally distributed (by visual inspection; Table 1-1).
Genotyping, quality control, and imputation.
We have previously reported a full description of these methods (Sanchez-Roige et al., 2018). DNA extraction and genotyping were performed on saliva samples by CLIA-certified and CAP-accredited clinical laboratories of Laboratory Corporation of America. Samples were genotyped on 23andMe custom genotyping array platforms (Illumina HumanHap550+ Bead chip V1 V2, OmniExpress+ Bead chip V3, Custom array V4). Quality control of genetic variants and imputation were performed by 23andMe (see Fig. 1-20).
SNP heritability using LD score regression.
We used Linkage Disequilibrium Score Regression Coefficient (LDSC; Bulik-Sullivan et al., 2015) to measure single nucleotide polymorphism (SNP) heritability. To standardize the input file (GWAS summary statistics), we followed quality controls as implemented by the LDSC python software package. We used pre-calculated LD scores [“eur_w_ld_chr/” files (Finucane et al., 2015); MHC region excluded] for each SNP using individuals of European ancestry from the 1000 Genomes project, suitable for LD score analysis in European populations. We restricted the analysis to well imputed SNPs: the SNPs were filtered to HapMap3 SNPs (International HapMap 3 Consortium et al., 2010), and were required to have a minor allele frequency (MAF) >1%. InDels, structural variants, strand-ambiguous SNPs, and SNPs with extremely large effect sizes (χ2 > 80) were removed. One of the advantages of using LDSC is that it allowed us to distinguish between genomic inflation attributed to polygenic architecture, from confounding biases such as population stratification (Bulik-Sullivan et al., 2015). As expected under polygenicity, we observed inflation of the test statistic (mean χ2 < 1.05), and adjusted for a genomic control inflation factor λ (the ratio of the observed median χ2 to that expected by chance). LD score intercepts of <1.01 (SE = 0.01) suggested that deviation from the null was because of a polygenic structure rather than inflation because of population structure biases (see Fig. 1-21).
Genome-wide association analyses.
GWAS analyses were performed using the 23andMe internal pipeline, which we have previously described (Sanchez-Roige et al., 2018). We performed 10 association tests by linear regression (additive model). We included age (inverse-normal transformed), sex, the first five principal components of genotype, and indicator variables for genotype platforms as covariates (see Fig. 1-22). Additional details can be found in the Extended Data.
Gene-based and transcriptome-based analyses.
We performed MAGMA (Watanabe et al., 2017) competitive gene-set and pathway analyses using the summary statistics from the GWAS of UPPS and BIS subscales, and Drug Experimentation using FUMA v1.2.8 (Watanabe et al., 2017). SNPs were mapped to 18,133 protein-coding genes from Ensembl build 85. Gene-sets were obtained from Msigdb v5.2 (“Curated gene sets”, “GO terms”).
We also used S-PrediXcan (Gamazon et al., 2015) to predict gene expression levels in 10 brain tissues, and to test whether the predicted gene expression correlates with GWAS of UPPS-P, BIS, and Drug Experimentation. We used precomputed tissue weights from the Genotype-Tissue Expression (GTEx v6) project database (https://www.gtexportal.org/) as the reference transcriptome dataset. Further details were provided previously (Sanchez-Roige et al., 2018).
Phenotypic and genetic correlation analyses.
We used bivariate correlations (r) to examine the direct phenotypic correlations between UPPS-P, BIS, Drug Experimentation, and several variables of interest (age, gender, race, education, annual household), and to identify significant covariates for inclusion in GWAS analysis. In addition, we also performed bivariate correlations to examine inter-correlations among the UPPS-P, BIS, and Drug Experimentation traits (see Figs. 1-22, and 4-1 to 4-3).
Using LDSC, we calculated genetic correlations (rg) between the 5 UPPS-P subscales, 4 BIS traits and Drug Experimentation, and 45 other complex traits or diseases that have been previously associated with IPTs, for which we had access to summary statistics. All results were expressed as false discovery rate (FDR; Benjamini and Hochberg, 1995). References for the datasets used are identified in Figs. 3-2 to 3-11. Files were standardized using the steps described in the section SNP-heritability using LD score regression. We did not constrain the intercepts in our analysis because the degree of sample overlap was unknown.
Results
Demographics
Demographic data are shown in Table 1. Mean age was 53.8 years (SD = 16.1), and 55.3% were women. The annual household income ranged from <$14,999 (13.5%) to >$75,000 (21.5%), and the mean years of education completed was 16.8 (SD = 2.6), which is the equivalent of completing a bachelor degree. Approximately half of the participants (49.3%) were married/partnered. Participants exhibited low to moderate alcohol and drug use (Table 1).
Self-reported impulsivity and Drug Experimentation scores
Self-reported impulsivity and Drug Experimentation scores are shown in the Table 1-1.
Chip-heritability estimates
We used LDSC to estimate chip-heritability, which demonstrated that 4.5–11.2% of the variation of UPPS-P, BIS, and Drug Experimentation can be explained by SNPs. Full results are shown in the Fig. 1-21.
Genome-wide association analyses of UPPS-P, BIS, and Drug Experimentation
We performed a total of 10 GWAS (5 for UPPS-P, 4 for BIS, and 1 for Drug Experimentation). The Manhattan and quantile-quantile (Q-Q) plots for UPPS-P Sensation Seeking are shown in Figure 1 and Fig. 1-1. We detected one genome-wide significant hit on chromosome 3 (p = 8.3 × 10⁻⁹; rs139528938; Fig. 1-23), located in the gene CADM2 (cell adhesion molecule 2), which encodes a member of the synaptic cell adhesion molecule 1 (SynCAM) family and belongs to the Ig superfamily. CADM2 has been recently associated with other risk-related phenotypes including risk-taking personality (Boutwell et al., 2017; Linnér et al., 2018) and risky behavior (Day et al., 2016), alcohol consumption (Clarke et al., 2017; Sanchez-Roige et al., 2019a), and cannabis use (Stringer et al., 2016; Pasman et al., 2018), as well as being associated with information speed processing (Ibrahim-Verbaas et al., 2016), physical activity (Klimentidis et al., 2018), and body mass index (BMI) variation (Speliotes et al., 2010; Locke et al., 2015). We used FUMA to functionally annotate all 467 SNPs in the credible set (Fig. 1-24). All SNPs were intronic. Furthermore, 18 SNPs showed CADD scores >12.37, which is the suggested threshold to be considered deleterious (Kircher et al., 2014). Four SNPs had RegulomeDB scores of 1a–1f, showing evidence of potential regulatory effects, and 59.7% of the SNPs were in open chromatin regions (minimum chromatin state 1–7).

Manhattan plot of GWAS results indicating the strongest associations between the 22 autosomes, X chromosome, and Sensation Seeking (a) and Drug Experimentation (b). Line denotes genome-wide significance (p < 5 × 10⁻⁸). The results have been adjusted for a genomic control inflation factor λ = 1.029 and λ = 1.031 (sample size = 22,745 and 22,572, respectively). For the Q-Q plots, see Figure 1-1, and Figure 1-9; for the regional association plots, see Figure 1-10, and Figure 1-18; and for the Manhattan plots of the MAGMA gene-based analyses, see Figure 1-19. See Figure 1-18 for the Manhattan and Q-Q plots and regional association plots for all UPPS-P and BIS subscales; and Figures 1-19 to 1-42 for additional analyses. See Figures 1-43 to 1-51, for the summary statistics for the top 10,000 SNPs.
In addition, we detected a suggestive association between Drug Experimentation and an intronic variant of CADM2 (p = 3.0 × 10⁻⁷; rs2163971; Fig. 1). We also identified a novel association between genetic variants in the CACNA1I locus and the UPPS-P Negative Urgency subscale (p = 3.8 × 10⁻⁸; rs199694726); the most associated SNP in this locus, rs4522708 (p = 8.22 × 10⁻⁸), is in LD (r2 = 0.64) with rs5995756, which has been previously associated with schizophrenia (Fig. 2; Schizophrenia Working Group of the Psychiatric Genomics Consortium, 2014). We did not identify any associations that exceeded 5 × 10⁻⁸ for any of the other UPPS-P and BIS subscales (Figs. 1-1 to 1-8, for Manhattan and Q-Q plots; Fig. 1-23, and Figs. 1-10 to 1-18, for the list of genetic variants and regional plots with strongest associations).

Manhattan plot of GWAS results indicating the strongest associations between the 22 autosomes, X chromosome, and UPPS-P negative urgency. The results have been adjusted for a genomic control inflation factor λ = 1.030 (sample size = 22,795). For the Q-Q plot, see Figure 2-1; and for the regional association plots, see Figure 2-2. For additional analyses, see Figure 2-3, and Figure 2-4; and the summary statistics for the top 10,000 SNPs, see Figure 2-5.
Gene- and transcriptome-based analyses
Similar to the GWAS results, MAGMA also identified the gene CADM2 as being significantly associated with Sensation Seeking (p = 1.7 × 10⁻⁹; Bonferroni threshold: p = 0.05/18,909 = 2.6 × 10⁻⁶; Fig. 1-19a) and Drug Experimentation (p = 1.7 × 10⁻⁷; Fig. 1-19a). CACNA1I was associated with Positive and Negative Urgency (p = 3.4 × 10⁻⁷, p = 1.5 × 10⁻⁷; Fig. 1-28 and Fig. 2-3). The gene MSRA was associated with Negative Urgency [p = 1.3 × 10⁻⁶; Fig. 2-3; (49)]. MAGMA did not identify any canonical pathways that were significantly associated with any of the other IPTs studied (data not shown).
Similar to the GWAS and MAGMA results, S-PrediXcan also identified a positive correlation (p = 3.8 × 10⁻⁶; FDR 20%) between Sensation Seeking and CADM2 expression in the putamen (basal ganglia; Fig. 1-34). S-PrediXcan did not detect any other significant association for other UPPS-P and BIS subscales, or Drug Experimentation (Figs. 1-35 to 1-42).
Phenotypic and genetic correlations
A phenotypic correlation matrix of the impulsive personality subscales and Drug Experimentation is shown in Fig. 4-1 to 4-4. All subscales exhibited adequate internal reliability (Table 1). BIS, UPPS-P, and Drug Experimentation scores were associated with demographic variables (age, sex, BMI, household income, and years of education); male and younger research participants were more impulsive across all of the UPPS-P and BIS subscales, and showed higher Drug Experimentation scores than female and older participants. Research participants with higher BMI and lower household income and years of education showed greater impulsivity scores as measured by UPPS-P and BIS; such participants also showed higher scores for Drug Experimentation.
Consistent with recent observations (MacKillop et al., 2016; Gray et al., 2018), phenotypic intercorrelations for UPPS-P and BIS subscales were high and positive (except between UPPS-P Sensation Seeking and UPPS-P Perseverance; Fig. 4-1). Across impulsivity questionnaires, phenotypic correlations between UPPS-P and BIS subscales were also high and positive, except between UPPS-P Sensation Seeking and BIS Nonplanning (r = −0.01, p = 5.3 × 10⁻²). Phenotypic correlations between Sensation Seeking and other impulsivity traits, although significantly different from zero, were modest (r < 0.2). This is consistent with recent phenotypic modeling of latent interrelationships among indicators of impulsivity (MacKillop et al., 2016).
Figure 3 shows a genetic correlation matrix of the impulsive personality subscales and several other phenotypes (full results shown in Fig. 3). Phenotypic and genetic correlations between impulsive subscales exhibited substantial variability (Fig. 4). The genetic correlations reported below use FDR 5% (full results are shown in Fig. 3). All BIS subscales were highly genetically intercorrelated (rg = 0.59–1, p values < 5.0 × 10⁻⁹). With regard to UPPS-P subscales, Positive Urgency showed a highly positive genetic correlation with Negative Urgency (rg = 0.74, p = 1.60 × 10⁻⁹) and Premeditation (rg = 0.62, p = 2.10 × 10⁻³), but the remaining three UPPS-P subscales did not show any significant genetic associations. Consistent with the observed phenotypic correlations, we did not find any significant genetic correlations between Sensation Seeking and other UPPS-P or BIS subscales (rg = −0.03–0.42, p < 7.85 × 10⁻²), suggesting that this trait may represent a relatively different construct, as previously suggested (MacKillop et al., 2016).
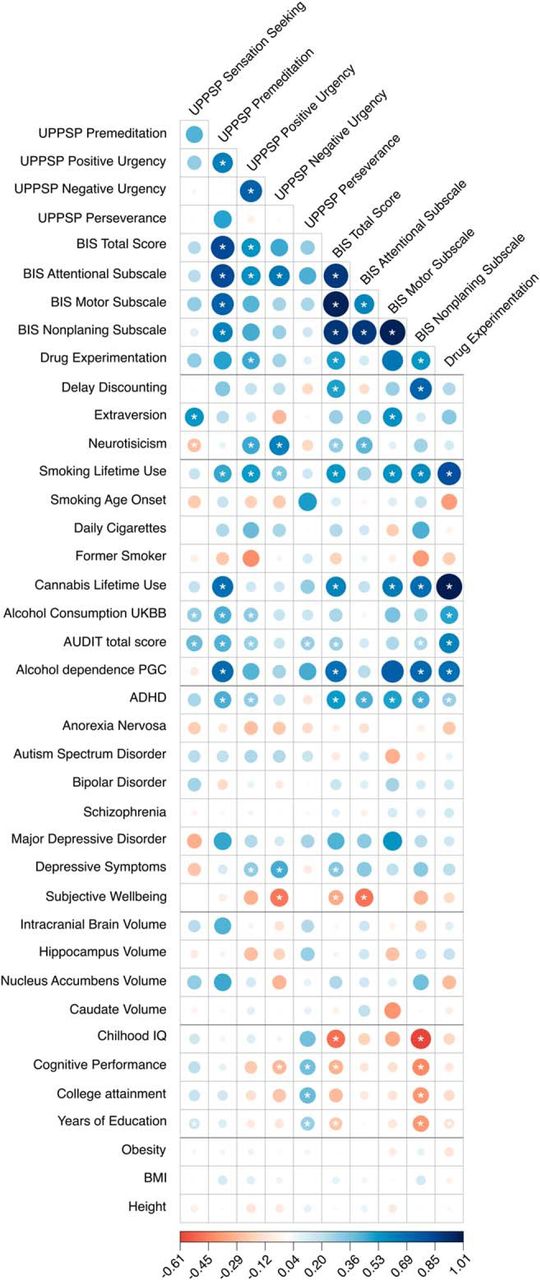
Genetic correlations between UPPS-P, BIS, and Drug Experimentation and several traits: other impulsive and personality traits, substance use phenotypes, neuropsychiatric, brain volume, cognition, anthropomorphic (Figures 3-2 to 3-11). For a hierarchical clustering analysis of these data, see Figure 3-1.

Phenotypic (r; green) and genetic (rg; blue) correlations between UPPS-P and BIS subscales; corresponding correlation estimates and p values are shown in Figures 4-1 to 4-5. The width and color gradient of the circles indicate the strength of the correlation.
With regard to other putatively distinct measures of impulsivity, only impulsivity as quantified by BIS (Total Score and the Nonplanning subscale) showed a positive genetic correlation with delay discounting (i.e., a measure of capacity to delay gratification; rg = 0.49 and 0.72, p < 1.59 × 10⁻²), further emphasizing that impulsivity has multiple distinct facets. Delay discounting was measured in this same cohort, as reported by Sanchez-Roige et al. (2018).
IPTs have been established as important contributors to drug use vulnerability (de Wit, 2009). Using multiple independent cohorts, we found modest genetic correlations between IPTs and substance use traits (Figs. 3-2 to 3-11). Similarly, BIS (Total Score, Motor, Nonplanning) and UPPS-P (Positive Urgency only) showed positive genetic correlations with our measure of Drug Experimentation (rg = 0.50–0.65, p < 1.09 × 10⁻²; Fig. 3-11). UPPS-P subscales (Premeditation, Positive Urgency) and all BIS subscales (except Attention) showed positive genetic correlations with lifetime cannabis and tobacco use (rg = 0.46–0.69, p = 1.22 × 10⁻³), suggesting that IPTs and drug use share a common genetic basis.
With regard to alcohol use phenotypes, we observed a positive genetic correlation between UPPS-P subscales (Sensation Seeking, Premeditation, and Positive Urgency) and alcohol consumption (rg = 0.30–0.44, p = 8.50 × 10⁻³), and between UPPS-P Premeditation and alcohol dependence (rg = 0.69, p < 1.25 × 10⁻²). Intriguingly, neither Sensation Seeking nor Positive Urgency were genetically correlated with DSM-IV diagnosis of alcohol dependence (Walters et al., 2018), suggesting a distinction between frequency of use and problem use. Conversely, measures from BIS (Total Score, Nonplanning) showed a positive genetic correlation with alcohol dependence (rg = 0.67 and 0.70, p < 2.00 × 10⁻³) but not alcohol consumption (rg = 0.25, p < 3.65 × 10⁻²). Furthermore, we observed positive genetic correlations between all Alcohol Use Disorders Identification Test (AUDIT) scores (AUDIT Total Score, and the domains pertaining to alcohol consumption and problematic alcohol use: AUDIT-C, AUDIT-P) and several measures from the UPPS-P questionnaire, including Sensation Seeking (rg = 0.40–0.52, p < 6.80 × 10⁻⁵), Premeditation (rg = 0.44–0.59, p < 5.33 × 10⁻³), and Positive Urgency (rg = 0.26–0.54, p < 1.32 × 10⁻²). Surprisingly, only AUDIT-P (but not AUDIT-C or AUDIT Total Score) showed a significant positive genetic correlation with UPPS-P Negative Urgency (rg = 0.34, p = 3.22 × 10⁻³). On the contrary, AUDIT-total and AUDIT-C (but not AUDIT-P) showed a positive correlation with the UPPS-P Perseverance subscale (rg = 0.29, p < 3.14 × 10⁻³). Similarly, all AUDIT dimensions showed positive genetic correlations with the BIS Nonplanning subscale (rg = 0.28 and 0.49, p < 1.74 × 10⁻²), whereas only BIS Total Score and BIS Attentional subscales showed positive genetic correlations with AUDIT-P (rg = 0.34 and 0.48, p = 1.05 × 10⁻²). Overall, the genetic correlations with alcohol consumption and dependence could suggest that different facets of IPT influence different temporal stages on the path from alcohol consumption to dependence.
With regard to other personality measures, UPPS-P Sensation Seeking and BIS Motor subscales showed a positive genetic correlation with extraversion (rg = 0.53–0.56, p < 8.36 × 10⁻³). In addition, UPPS-P Sensation Seeking showed a negative genetic correlation with neuroticism (rg = −0.30, p = 1.87 × 10⁻³), whereas UPPS-P (Positive and Negative Urgency) and BIS (Total Score, Attentional) showed positive genetic correlations with neuroticism (rg = 0.30–0.60, p < 1.02 × 10⁻²).
Considering our measure of Drug Experimentation, we found positive genetic correlations with other substance use phenotypes, including alcohol consumption (rg = 0.48, p = 6.15 × 10⁻⁷), AUDIT scores (AUDIT Total Score, AUDIT-C, AUDIT-P; rg = 0.55–0.59, p < 4.03 × 10⁻⁷), alcohol dependence (rg = 0.68, p = 3.02 × 10⁻⁵), lifetime tobacco (rg = 0.82, p = 1.61 × 10⁻¹²), and cannabis smoking (rg = 1.02, p = 7.65 × 10⁻¹²).
Impulsivity is a core symptom of ADHD (Dalley and Robbins, 2017). We found that UPPS-P Premeditation and Positive Urgency and all BIS subscales showed positive genetic correlations with ADHD (rg = 0.43 and 0.30, p < 8.69 × 10⁻³; rg = 0.44–0.51, p < 9.37 × 10⁻³). We also identified a positive genetic correlation between Drug Experimentation and ADHD (rg = 0.28, p = 1.23 × 10⁻³).
Impulsivity may also play a role in other psychiatric disorders (Dalley and Robbins, 2017). For example, we found that, BIS Total Score and UPPS-P Positive and Negative Urgency showed a positive genetic correlation with depressive symptoms (rg = 0.33 and 0.30 and 0.45, p < 7.90 × 10⁻³). Similarly, BIS Total Score, BIS Attention, and UPPS-P Negative Urgency showed negative genetic correlations with subjective well-being (rg = −0.33, −0.49, −0.48, respectively, p < 1.72 × 10⁻²).
Last, BIS (Total Score, Nonplanning) and UPPS-P Negative Urgency showed negative genetic correlations with educational variables (rg = −0.30–0.50, −0.39, −0.29, respectively, p < 1.37 × 10⁻²), whereas UPPS-P Sensation Seeking and UPPS-P Perseverance showed positive genetic correlations with educational measures (rg = 0.16–0.39, p < 6.43 × 10⁻³). Drug Experimentation showed a negative genetic correlation with years of education (rg = −0.14, p = 1.39 × 10⁻²).
Discussion
We have performed the largest GWAS of self-reported IPTs to date. We identified an association between SNPs in CADM2 and Sensation Seeking and Drug Experimentation via single variant, gene- and transcriptome-based analyses; CADM2 has been previously implicated in numerous traits related to risk taking. In addition, we identified an association between variants in CACNA1I and Negative Urgency via single-variant and gene-based analyses; CACNA1I has been previously implicated in schizophrenia. IPTs and Drug Experimentation were modestly heritable (5–11%). This study provides strong evidence that the construct of impulsivity can be genetically separated into distinct components. We showed that IPTs are genetically correlated with both substance use involvement and ADHD, suggesting impulsivity is an endophenotype contributing to these psychiatric conditions.
High impulsivity depends on a neural network that includes the ventral striatum (subsuming the nucleus accumbens) with top-down control from prefrontal cortical regions, and is modulated by monoamine neurotransmitters including dopamine and serotonin (Dalley and Roiser, 2012). Notably, we did not replicate (at our threshold of p < 5 × 10⁻⁸) numerous prior “candidate gene” studies that have implicated genes related to monoamine neurotransmitters in impulsivity (Taylor et al., 2017; Gray et al., 2018). Instead, we identified an association within the gene for CADM2 (aka SynCAM2), which encodes a mediator of synaptic signaling. Independent GWASs have previously identified significant associations between multiple loci in CADM2 and risky behaviors [risk-taking (Boutwell et al., 2017), risk-tolerance, automobile speeding propensity, number of sexual partners (Linnér et al., 2018)]. Loci within CADM2 have also been previously associated with high alcohol consumption (Clarke et al., 2017), high AUDIT scores (Sanchez-Roige et al., 2019a), and cannabis lifetime use (Pasman et al., 2018), suggesting that this gene may influence drug use in a substance independent manner. Many of these variants are also expression quantitative trait loci (eQTL) in multiple tissues, including several brain regions (i.e., basal ganglia, cerebellum, hippocampus; Fig. 1-2). The SNP most strongly associated with Sensation Seeking (rs139528938) and the SNP most strongly associated with Drug Experimentation (rs2163971), are highly correlated with one another (r2 = 0.68, r2 = 0.57), which is consistent with the possibility that the two associations reflect a common underlying functional genetic variant. Furthermore, the SNP most strongly associated with Sensation Seeking (rs139528938) is also highly correlated (r2 = 0.57) with the SNP in CADM2 (rs57401290) that was previously associated with self-reported risk-taking propensity (rs57401290: p = 5.3 × 10⁻⁹; Linnér et al., 2018); that same SNP also showed nominal associations with number of sexual partners (rs57401290: p = 6.0 × 10⁻⁷) and number of children (rs57401290: p = 6.2 × 10⁻⁷) using data from the UK Biobank (Linnér et al., 2018). CADM2 is expressed throughout the brain, and modulates synapse assembly (Biederer et al., 2002). CADM2 encodes an Ig-domain-containing adhesion protein that spans the synaptic cleft and induces excitatory synapses. CADMs are highly expressed in cholinergic interneurons in the striatum, whose arborization may affect striatal circuits (Sakurai, 2017). Intriguingly, a closely related synapse-organizing protein, CADM1, has been implicated in drug addiction (Giza et al., 2013; Sakurai, 2017) and appetitive behaviors characterized by elevated impulsivity (i.e., food intake, obesity; Fall and Ingelsson, 2014), for which subcortical circuits are essential.
Impulsivity is increasingly recognized as a phenotypically heterogeneous construct, and our LDSC genetic correlation analyses provide novel genetic evidence to support this view (Niv et al., 2012; Caswell et al., 2016). The current data support the idea that the diverse impulsivity traits (measured by BIS, UPPS-P, delay discounting questionnaires) may be governed by both overlapping and distinct genetic substrates (Figs. 2, 3). Particularly, Sensation Seeking did not exhibit genetic associations with UPPS-P or BIS dimensions. Although Sensation Seeking is considered an impulsivity-related trait within the UPPS measure, these data suggest that the preference for highly stimulating experiences is genetically distinct from all the other BIS and UPPS-P subscales, and it is consistent with earlier phenotypic observations (MacKillop et al., 2016).
Other personality traits, such as extraversion and neuroticism (Bachorowski and Newman, 1985; Lange et al., 2017), have sometimes been considered closely related to IPTs (Whiteside and Lynam, 2001). Our genetic correlation analyses provide more evidence for some of these associations; Sensation Seeking scores showed a positive genetic correlation with extraversion and a negative genetic correlation with neuroticism, whereas UPPS-P (Positive and Negative Urgency) and BIS (Total, Attention) showed positive genetic correlations with neuroticism as measured by Lo et al. (2017).
We examined the relevance of UPPS-P and BIS as surrogates for substance use disorders. Epidemiological studies have also shown that impulsivity is elevated in drug users; however, such studies are based on phenotypic correlations and cannot therefore identify causality mechanisms (i.e., impulsivity could either precede or result from drug use). By studying impulsivity in research participants with low rates of drug use we were able to study normal variation in IPTs without the confounding influence of drug use. We found that impulsivity and substance use have a common genetic etiology (Fig. 3), demonstrating that forms of impulsivity meet the first criteria necessary to be considered an endophenotype for substance use disorders (Gottesman and Gould, 2003; Flint and Munafò, 2007).
We have also shown that different facets of IPTs may mediate use of specific drug types, as has been found in phenotypic correlations between motor impulsivity and stimulant abuse (Verdejo-García et al., 2007; Ersche et al., 2010), cognitive impulsivity for cocaine and heroin use (Rodríguez-Cintas et al., 2016), and different UPPS measures predicting different aspects of alcohol use (alcohol consumption, misuse and dependence; Coskunpinar et al., 2013). For example, we have shown that some UPPS-P (lack of Premeditation) and BIS (Total Score, Nonplanning) measures were genetically correlated with DSM-IV diagnosis of alcohol dependence, whereas some UPPS-P measures (lack of Premeditation, Positive Urgency, Sensation Seeking) correlated with alcohol consumption and AUDIT Total Score but not alcohol dependence.
Our study identifies a genetic correlation between Sensation Seeking and Drug Experimentation. Drug experimentation is a necessary precursor for drug abuse and constitutes one of the earliest stages at which an individual's genotype can influence their risk toward drug abuse. Future studies will be needed to determine the role of genetic influences on sensation seeking and other aspects of IPT beyond the initial stages of drug use and abuse.
Similarly, other studies have reported that individuals with ADHD exhibit elevated IPTs (Stanford et al., 2009; Coskunpinar et al., 2013). Here we showed that all BIS measures and some UPPS-P subscales (lack of Premeditation, Positive Urgency) showed positive genetic correlations with ADHD, suggesting that impulsivity is an endophenotype for ADHD (Robbins et al., 2012). Finally, we identified positive genetic correlations between BIS total and UPPS Positive and Negative Urgency and depressive symptoms. These observations illustrate the role of impulsivity in multiple psychiatric diagnoses, consistent with the NIMH Research Domain Criteria (RDoC) approach (Insel, 2014).
Our study is not without limitations. Although we have several lines of evidence that implicated the genes CADM2 and CACNA1I, the proximity of the genes to the most strongly associated SNPs should not afford too much weight; in some cases, more distant genes may be regulated by transcriptional elements located within the exons of neighboring genes (Smemo et al., 2014). Therefore, the corroborating evidence from the single, gene- and transcriptome-based analyses is important for implicating these genes. Furthermore, our research participants showed generally low levels of IPT scores in absolute terms. Most studies of impulsivity use teenaged or young adult subjects; in contrast, the average age of our cohort was 54 years old. Although there is empirical support for impulsivity being a stable trait (Niv et al., 2012), our findings may not generalize to younger populations. As previously reviewed in a meta-analysis, total genetic effects across various impulsivity traits were found to be important for all ages, but appeared to be strongest in children (Bezdjian et al., 2011; Moustafa et al., 2017). Furthermore, this cohort does not represent the general population is several ways: they are more educated, have higher socioeconomic status, voluntarily joined 23andMe, and then agreed to participate in this study. All of these factors would be expected to constrain the variability in IPTs observed, which could limit the generalizability of our findings to other populations. In addition, this population showed low levels of drug use, which was an advantage because it minimized the chance that prolonged drug use increased impulsivity (Balodis et al., 2009; Fineberg et al., 2014). Another limitation is that we measured self-reported impulsive personality, but did not include objective behavioral measures (Malle and Neubauer, 1991; Lane et al., 2003; Meda et al., 2009; Dick et al., 2010; Broos et al., 2012; Havik et al., 2012). Self-report measures can provide evidence of “trait” impulsivity (stable personality characteristic), whereas performance-based tests may measure aspects of “state” impulsivity (influenced by environmental variables). Self-report measures may be influenced by subjective bias [e.g., less insight of the inhibitory control deficits in drug abusers (Helmers et al., 1995) or by the subject's current state (Wingrove and Bond, 1997)]. Last, consistent with the long-standing conventions (The Wellcome Trust Case Control Consortium, 2007) and recent studies using UKBiobank data, our GWAS analyses do not correct for the number of traits examined (partially because the traits being analyzed are highly correlated). Although the main GWAS hits will still need to be replicated in cohorts measuring the same traits, our results are themselves replications of previous associations between CADM2 and measures of risky behavior, and between CACNA1I and schizophrenia.
Our results indicate that IPTs are influenced by numerous genetic variants. The genetic dissection of impulsivity will likely benefit from studies with even larger sample sizes. Variants in the CADM2 gene, implicated in recent GWAS of risk-associated traits, are associated with Sensation Seeking, and nominally with Drug Experimentation. We are currently establishing Cadm2 knock-out mice, which will allow a molecular exploration of the events that underlie these traits. Altogether, this study is the first to demonstrate a common genetic basis for individual differences in IPTs. Furthermore, this study shows genetic overlap between various measures of impulsivity and several psychiatric conditions, including substance use disorders and ADHD. More broadly, our approach shows how genetic studies of IPTs can provide unique insights into the fundamental biology of neuropsychiatric diseases.
Footnotes
This work was supported by the Peter Boris Chair in Addictions Research to J.M.; by Grant DA02812 to H.d.W.; by the Frontiers of Innovation Scholars Program (3-P3029), the Interdisciplinary Research Fellowship in NeuroAIDS (MH081482), and a pilot Award from DA037844 to S.S.-R.; and by the California Tobacco-Related Disease Research Program (Grant 28IR-0070) to S.S.-R. and A.A.P. We thank the 23andMe research participants and employees for making this work possible. We thank Jazlene Mallari for her work establishing the Cadm2 mouse line.
J.M. discloses that he is a principal in BEAM Diagnostics. Pierre Fontanillas, Sarah L. Elson, and members of the 23andMe Research Team are employees of 23andMe Collaborator List for the 23andMe Research Team: Michelle Agee, Babak Alipanahi, Adam Auton, Robert K. Bell, Katarzyna Bryc, Sarah L. Elson, Pierre Fontanillas, Nicholas A. Furlotte, David A. Hinds, Karen E. Huber, Aaron Kleinman, Nadia K. Litterman, Jennifer C. McCreight, Matthew H. McIntyre, Joanna L. Mountain, Elizabeth S. Noblin, Carrie A.M. Northover, Steven J. Pitts, J. Fah Sathirapongsasuti, Olga V. Sazonova, Janie F. Shelton, Suyash Shringarpure, Chao Tian, Joyce Y. Tung, Vladimir Vacic, and Catherine H. The remaining authors declare no competing financial interests. J.C.G. would like to disclose that the opinions and assertions expressed herein are those of the author(s) and do not necessarily reflect the official policy or position of the Uniformed Services University or the Department of Defense.
We have provided summary statistics for the top 10,000 SNPs (Figs. 1.43–1.51). The full GWAS summary statistics may be made available through 23andMe to qualified researchers under an agreement that protects participant privacy. Interested researchers should visit https://research.23andme.com/collaborate/#publication to learn more and to apply to access the data.
Extended Data is available at https://www.jneurosci.org/content/39/13/2562/tab-figures-data#figdata-supplementary-materials.
- Correspondence should be addressed to Abraham A. Palmer at aap{at}ucsd.edu


