

Abstract
Studies using drugs that increase or decrease GABAergic transmission suggest that GABA in the pontine reticular formation (PRF) promotes wakefulness and inhibits rapid eye movement (REM) sleep. Cholinergic transmission in the PRF promotes REM sleep, and levels of endogenous acetylcholine (ACh) in the PRF are significantly greater during REM sleep than during wakefulness or non-REM (NREM) sleep. No previous studies have determined whether levels of endogenous GABA in the PRF vary as a function of sleep and wakefulness. This study tested the hypothesis that GABA levels in cat PRF are greatest during wakefulness and lowest during REM sleep. Extracellular GABA levels were measured during wakefulness, NREM sleep, REM sleep, and the REM sleep-like state (REMNeo) caused by microinjecting neostigmine into the PRF. GABA levels varied significantly as a function of sleep and wakefulness, and decreased significantly below waking levels during REM sleep (−42%) and REMNeo (−63%). The decrease in GABA levels during NREM sleep (22% below waking levels) was not statistically significant. Compared with NREM sleep, GABA levels decreased significantly during REM sleep (−27%) and REMNeo (−52%). Comparisons of REM sleep and REMNeo revealed no differences in GABA levels or cortical EEG power. GABA levels did not vary significantly as a function of dialysis site within the PRF. The inverse relationship between changes in PRF levels of GABA and ACh during REM sleep indicates that low GABAergic tone combined with high cholinergic tone in the PRF contributes to the generation of REM sleep.
Introduction
GABAergic transmission in the pontine reticular formation participates in the regulation of sleep and wakefulness. Direct administration into the pontine reticular formation of GABAA receptor agonists or drugs that increase extracellular GABA levels causes an increase in the time spent in wakefulness and a decrease in sleep (Camacho-Arroyo et al., 1991; Xi et al., 1999; Sanford et al., 2003; Watson et al., 2008; Flint et al., 2010). Similarly, GABAA receptor antagonists or drugs that inhibit the synthesis of GABA increase sleep and decrease wakefulness when administered to the pontine reticular formation (Camacho-Arroyo et al., 1991; Xi et al., 1999; Sanford et al., 2003; Marks et al., 2008; Watson et al., 2008; Flint et al., 2010). Considered together, these pharmacological data support the interpretation that GABAergic transmission at GABAA receptors in the pontine reticular formation promotes wakefulness and inhibits rapid eye movement (REM) sleep.
Levels of endogenous GABA in cat pontine reticular formation are significantly decreased below waking levels during the loss of consciousness induced by the general anesthetic isoflurane (Vanini et al., 2008). No previous studies have determined whether endogenous GABA levels in the pontine reticular formation vary as a function of states of sleep and wakefulness. Therefore, the present study was designed to test the hypothesis that extracellular GABA levels in cat pontine reticular formation are greatest during wakefulness and lowest during REM sleep. To test the causal nature of the relationship between GABA levels in the pontine reticular formation and REM sleep generation, GABA was measured while an increase in REM sleep was caused pharmacologically.
REM sleep is increased by microinjecting cholinomimetics into the pontine reticular formation, and acetylcholine (ACh) release in the pontine reticular formation is significantly greater during REM sleep than during wakefulness or non-REM (NREM) sleep (for review, see Lydic and Baghdoyan, 2008). Blocking transmission at GABAA receptors in the pontine reticular formation increases ACh release (Vazquez and Baghdoyan, 2004) and increases REM sleep (Xi et al., 1999; Sanford et al., 2003; Marks et al., 2008; Flint et al., 2010). The increase in REM sleep caused by the GABAA receptor antagonist gabazine is blocked by pretreatment with the muscarinic antagonist atropine (Marks et al., 2008). These findings suggest that REM sleep occurs, in part, because of an interaction between cholinergic and GABAergic transmission in the pontine reticular formation. Therefore, the final part of this study quantified for the first time the ratio of state-dependent changes in levels of ACh/GABA in the pontine reticular formation.
Materials and Methods
Animals, chemicals, and drugs.
All procedures using animals were approved by the University of Michigan Committee on Use and Care of Animals and were conducted in accordance with the Guide for the Care and Use of Laboratory Animals (National Academies, 1996) and the Guidelines for the Care and Use of Mammals in Neuroscience and Behavioral Research (National Academies, 2003). Adult, male cats (n = 6) that were bred for research were purchased from Harlan Laboratories. The advantages of using cat for in vivo studies that aim to quantify changes in endogenous neurotransmitters as a function of sleep and wakefulness have been discussed in detail previously (Vazquez and Baghdoyan, 2003; Vanini et al., 2008). Briefly, accurate and reliable behavioral-state-specific measures of GABA require long-lasting and consolidated episodes of sleep and wakefulness. Compared with rodent, cat has long duration episodes of NREM sleep and REM sleep. Thus, the cat provides an optimal species for overcoming the temporal limitations of microdialysis coupled to HPLC for testing the hypothesis that GABA levels in the pontine reticular formation change as a function of sleep state.
Chemicals for Ringer's solution, o-phosphoric acid, sodium phosphate dibasic, sucrose, and formalin were purchased from Thermo Fisher Scientific. HPLC-grade methanol, acetonitrile, sodium tetraborate decahydrate, β-mercaptoethanol, GABA, and neostigmine bromide were obtained from Sigma-Aldrich. o-phthaldialdehyde was purchased from Mallinckrodt. Solutions for microinjections were made immediately before use.
In vivo microdialysis and microinjection studies.
Cats were instrumented in a sterile operating suite as described previously (Vazquez and Baghdoyan, 2003; Vanini et al., 2008). Briefly, cats were anesthetized with isoflurane and placed in a stereotaxic frame (David Kopf Instruments). Standard recording electrodes for objective assessment of sleep and wakefulness (Ursin and Sterman, 1981) were implanted, and a craniotomy was created over the cerebellum to provide access for stereotaxic placement of a microdialysis probe in the pontine reticular formation. The recording electrodes and a pair of parallel stainless-steel tubes custom designed to accommodate the Kopf 880 head holder were cemented to the skull with dental acrylic. These tubes and the Kopf 880 holder were used during subsequent experiments to place the head in stereotaxic position without the need for anesthesia. This procedure permitted collection of microdialysis samples during states of sleep and wakefulness. Cats were allowed to recover from surgery and were conditioned to sleep in the laboratory for 3–4 weeks before experiments began.
All experiments were conducted at the same time of day. Microdialysis sample collection began between 10:30 A.M. and 12:00 P.M., and experiments lasted 4–6 h. For each experiment, a custom-made microdialysis probe (CMA/10 or 12; CMA/Microdialysis) with a shaft length of 70 mm and polycarbonate or PAES membrane (20 kDa cutoff, 2 mm length, 0.5 mm diameter) was inserted into a stainless-steel guide tube that was aimed stereotaxically for the pontine reticular formation. Stereotaxic coordinates for dialysis aim sites ranged from 1.0 to 3.0 mm posterior to zero, 1.0 to 2.5 mm lateral to the midline, and 4.0 to 6.0 mm below zero (Berman, 1968). Each dialysis site was used once. Dialysis aim sites were separated from each other by at least 1 mm in the anterior–posterior and mediolateral planes. Microdialysis probes were perfused continuously with Ringer's solution (147.0 mm NaCl, 2.4 mm CaCl2, 4.0 mm KCl, 1.0 mm MgSO4, pH 6.0) at a flow rate of 3.0 μl/min using a CMA/400 syringe pump.
Figure 1 illustrates the time course for data collection and the within-subjects study design used for measuring GABA during electrographically and behaviorally identified states of sleep and wakefulness. Samples collected during the first 120 min of dialysis (Fig. 1A, phase 1) were used to ensure that detectable and stable levels of GABA were obtained from the pontine reticular formation (Vanini et al., 2008). Samples collected during minutes 120–170 of dialysis (Fig. 1A, phase 2) provided control levels of GABA. During phases 1 and 2, cats were kept awake most of the time (Fig. 1B,C) by auditory stimulation and gentle handling. Thereafter (Fig. 1A, phase 3), cats were allowed to sleep ad libitum, and additional dialysis samples were collected during objectively confirmed states of wakefulness, NREM sleep, and REM sleep (Fig. 1B,C).
Microinjection of cholinomimetics into the pontine reticular formation causes the rapid onset of a REM sleep-like state. This approach has been used productively to study REM sleep physiology (Baghdoyan et al., 1984; Morales et al., 1987; Datta et al., 1993; Garzón et al., 1997; Kubin, 2001; Lydic and Baghdoyan, 2005; Márquez-Ruiz and Escudero, 2009) and confers the advantage of producing long-duration episodes of REM sleep (Fig. 1C). Thus, GABA levels were also measured during the REM sleep-like state (REMNeo) caused by microinjecting the acetylcholinesterase inhibitor neostigmine (6 μg/0.25 μl; 20 nmol) into the pontine reticular formation. The purpose of these experiments was to determine whether causing REM sleep to occur would cause a significant decrease in GABA levels. Stereotaxic coordinates used to deliver neostigmine to the pontine reticular formation were 3.0–3.5 mm posterior to zero, 2.0 mm lateral, and 4.0 mm below zero (Berman, 1968). Figure 1C illustrates that unilateral microinjections were made contralateral to the dialysis site during NREM sleep and that dialysis samples were collected during REMNeo after the collection of dialysis samples during spontaneously occurring sleep and wakefulness.
At the end of each experiment, the dialysis probe was removed from the brain and a microinjector was inserted into the guide cannula to deliver nontransportable, colored fluorescent microspheres (0.1 μl; FluoSpheres; Invitrogen). The object of this procedure was to uniquely label each dialysis site to determine whether GABA levels vary along the anterior-to-posterior, medial-to-lateral, and dorsal-to-ventral extent of the rostral pontine reticular formation. After the microspheres were delivered, the microinjector and guide cannula were removed from the brain, the craniotomy was sealed with bone wax, and the animal was returned to its home cage in the Unit for Laboratory Animal Medicine.
The percentage of GABA recovered by the dialysis membrane in vitro was determined before and after each experiment. Mean ± SEM recovery of GABA by all dialysis membranes was 7.7 ± 0.4%. Experiments were excluded from the group data if in vitro recovery of GABA changed significantly in the same direction as the change observed in the levels of brain GABA. This exclusion criterion insured that changes in GABA levels were not an artifact of dialysis membrane dynamics.
Quantification of GABA.
Detection and quantification of GABA in microdialysis samples obtained from the pontine reticular formation have been described in detail (Watson et al., 2007, 2008; Vanini et al., 2008) and are overviewed here. An aliquot (12.5 μl) of each dialysis sample was loaded into an autosampler and mixed with 6.0 μl of a derivatization solution [5.0 mm o-phthaldialdehyde, 1.8 mm β-mercaptoethanol, 97.1 mm borate buffer, 2.5% (v/v) methanol, pH 9.3]. A portion (10 μl) of the derivatized solution was injected into a Shiseido CAPCELL PAK C-18 separation column (JM Science), and the derivatized samples were carried through the HPLC system (ESA) in a mobile phase [100 mm sodium phosphate buffer, 25% (v/v) methanol, and 3% (v/v) acetonitrile, pH 6.75] at a flow rate of 0.6 μl/min. Automation of the HPLC system and analysis of GABA peaks (see Fig. 2C) were performed with EZChrom Elite chromatography data system (Scientific Software). The amount of GABA in each dialysis sample was calculated by comparison with a standard curve, which was generated by nine known concentrations of GABA ranging from 0.0055 (detection limit) to 0.913 pmol/10 μl.
Electrophysiological recordings of sleep and wakefulness and power spectral analysis.
The electroencephalogram (EEG) (Fig. 1B, inset), electrooculogram, and dorsal neck electromyogram were recorded during microdialysis sample collection. Behavioral observations also were obtained. These measures made it possible to objectively assess states of sleep and wakefulness in real time. The physiological signals were recorded using a Grass model 7D polygraph (Grass Instruments). Signals were digitized and analyzed using a Power CED1401 data acquisition unit and Spike2 software (Cambridge Electronic Design). EEG power spectral analyses were performed to determine whether the cortical EEG recorded during REMNeo differed from the EEG recorded during spontaneous REM sleep. Frontal EEG power spectra were generated by averaging artifact-free, 10 s epochs from spontaneous REM sleep and REMNeo episodes in 1 Hz increments ranging from 0.5 to 60 Hz. The mean EEG power during REM sleep and REMNeo was normalized and statistically compared in the frequency bands of 0.5–4 (delta), 5–8 (theta), 9–16 (sigma), 17–29 (beta), and 30–60 (gamma) Hz.
Histological localization of dialysis sites.
After the last dialysis experiment, cats were deeply anesthetized with isoflurane, injected with pentobarbital (35–40 mg/kg, i.v.), and perfused transcardially with cold saline (0.9%) followed by formalin (10%). Brains were removed and fixed in formalin (10%) for 3–4 weeks. Thereafter, the brainstem block was transferred for cryoprotection to sucrose (30%) in formalin (10%) for 7 d. Serial, sagittal sections (40 μm thick) of the brainstem were cut on a sliding microtome and float-mounted onto chrom-alum-coated glass slides. Alternate sections were stained with cresyl violet and coverslipped using Permount (Thermo Fisher Scientific). All sections containing microdialysis sites were digitized, and the stereotaxic coordinates of the dialysis sites were assigned by comparison with an atlas of the cat brainstem (Berman, 1968). The midpoint of the 2-mm-long dialysis membrane was used to assign stereotaxic coordinates in the anterior–posterior and dorsoventral planes. Alternate, nonstained sections were coverslipped with Gel/Mount (Biomeda) and used to localize fluorescent beads that marked the microdialysis sites. These microspheres contained blue, red, or yellow-green dyes with excitation and emission wavelengths of 365/415, 580/605, and 505/515 nm, respectively. Digital photographs of brain sections containing fluorescent beads were obtained with a DP70 camera attached to an Olympus BH-2 microscope (Olympus America).
Data analysis.
Statistical tests were performed in consultation with the University of Michigan Center for Statistical Consultation and Research using programs developed by Statistical Analysis System, version 9.1.3 (SAS Institute); GBStat, version 6.5.6 (Dynamic Microsystems); and Prism, version 5.0a for Mac OS X (GraphPad Software). The data distribution for measures of GABA levels did not meet the assumptions of the general linear model. Thus, to test whether there was an effect of arousal state or dialysis site on GABA levels, the data were analyzed by fitting a linear mixed model. This model included variance components for animal and for experiments nested within animal, to capture the extra variance introduced by these two factors. Within-groups degrees of freedom were conservatively constrained to 10 based on a between-within design, with cat being the subject in the analysis. The post hoc Tukey–Kramer procedure, adjusted for multiple comparisons, was used to evaluate differences in GABA levels between arousal states. EEG power-by-frequency during REM sleep and REMNeo was compared by t test with Bonferroni's correction. Data are reported as mean ± SEM, and a value of p < 0.05 was considered statistically significant.
Results
GABA levels in cat pontine reticular formation were lowest during REM sleep and REMNeo
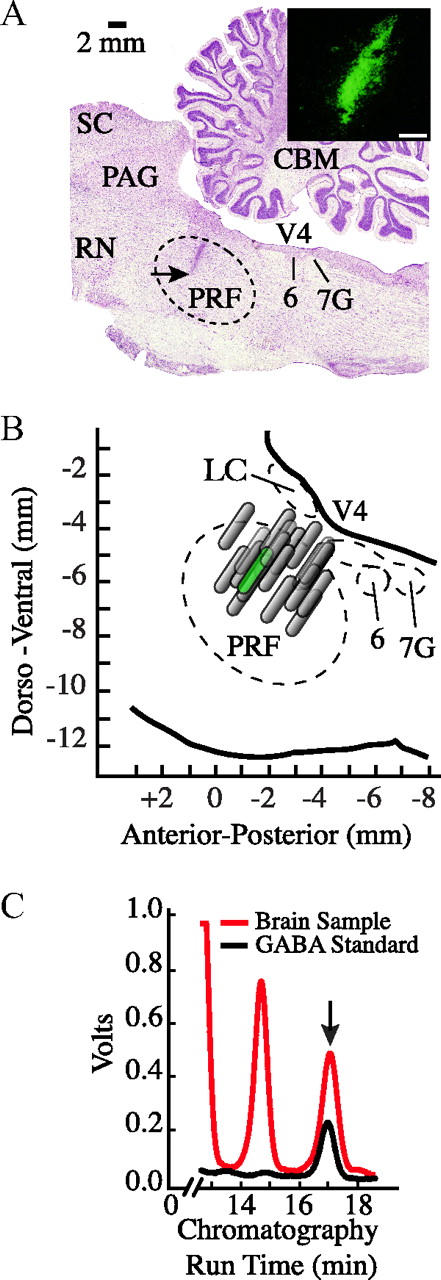
The design used for these experiments yielded measures of GABA obtained during prolonged wakefulness (Fig. 1A, phase 2) and during wakefulness that followed recovery sleep (Fig. 1A, phase 3). There was no significant difference between GABA levels measured in these two groups of samples; thus, the values were pooled to calculate average GABA levels during wakefulness. Histological analysis (Fig. 2) confirmed that all measures of GABA were obtained from the pontine reticular formation. Each dialysis site was labeled using nontransportable fluorescent beads (Fig. 2A). The portion of the pontine reticular formation sampled by microdialysis for all experiments is shown in Figure 2B. Dialysis sites were localized to the rostral part of the pontine reticular formation and spanned from 1 to 3 mm posterior to stereotaxic zero, 0.6 to 2.7 mm lateral to the midline, and 4.5 to 7.0 mm below stereotaxic zero (Berman, 1968). Figure 2C shows representative chromatograms used to quantify GABA. Levels of endogenous GABA did not vary significantly as a function of dialysis site.

Design of microdialysis experiments. A, Timeline for data collection. Cats spent most of phase 1 in wakefulness, during which time GABA levels stabilized after dialysis probe insertion (time 0) into the pontine reticular formation (PRF). During phase 2, cats also were kept awake to obtain baseline measures of GABA. In phase 3, cats were allowed to sleep ad libitum and dialysis samples were collected during NREM sleep, REM sleep, and wakefulness. B, The temporal organization of sleep and wakefulness during a representative experiment is indicated by the height of the black bars. Lowest, intermediate, and highest bars represent the occurrence and duration of wakefulness, NREM sleep, and REM sleep, respectively. The sagittal drawing of the cat brain schematizes a dialysis probe in the pontine reticular formation and indicates that electrodes for recording the EEG were placed over the frontal cortex. The arrows indicate that the dialysis probe was perfused continuously with Ringer's via the inlet tubing and that Ringer's containing GABA was collected from the outlet tubing. EEG recordings (inset) and dialysis sample collection occurred simultaneously. GABA in the dialysis samples was quantified off-line. C, The inset shows a coronal drawing of cat brainstem at 3 mm posterior to stereotaxic zero (adapted from Berman, 1968). A dialysis probe for collecting endogenous GABA is shown in the left pontine reticular formation. A microinjector for delivering neostigmine (Neo) is shown in the right pontine reticular formation. The hatched portion at the tip of the probe represents the dialysis membrane and is drawn to scale. The black bars indicate the temporal distribution of wakefulness, NREM sleep, and REM sleep before and after a microinjection of neostigmine into the pontine reticular formation (straight arrow). In all cases, neostigmine was microinjected during NREM sleep and caused a long-lasting REM sleep episode.

Histological localization of dialysis sites and GABA chromatography. A, Digitized, sagittal section of cat brainstem showing a representative microdialysis site. The arrow indicates the deepest part of the 2-mm-long microdialysis membrane and confirms that measures of GABA were obtained from the pontine reticular formation. Stereotaxic coordinates for this dialysis site are 1.5 mm posterior to stereotaxic zero, 1.6 mm lateral to the midline, and 5.5 mm below zero (Berman, 1968). Photomicrograph at the top right side of the cresyl violet-stained section shows green fluorescent microspheres used to mark the dialysis site. The photograph was taken from the area marked by the arrow. The white calibration bar at the bottom right of the photomicrograph indicates 250 μm. B, Schematic sagittal view of the pontine portion of cat brainstem at the same lateral plane as in A shows the anatomical distribution of all dialysis sites (n = 20) within the pontine reticular formation. The profiles of the microdialysis membranes are drawn to scale. The schematic membrane that is colored green indicates the location of the dialysis site in A. C, A chromatogram from a representative microdialysis sample (red trace) collected during wakefulness is superimposed on a chromatogram from a known concentration of GABA (0.457 pmol/10 μl; black trace). The arrow indicates that chromatographic peaks corresponding to GABA had an HPLC elution time of 17 min (abscissa). The chromatograms demonstrate an excellent signal-to-noise ratio for detection of GABA in brain dialysis samples. Abbreviations: LC, Locus ceruleus; CBM, medial nucleus of the cerebellum; PAG, periaqueductal gray; PRF, pontine reticular formation; RN, red nucleus; SC, superior colliculus; V4, fourth ventricle; 6, abducens nucleus; 7G, genu of facial nerve.
Figure 3A plots group data from 20 experiments in six cats. There was a significant effect of behavioral state on GABA levels (F = 31.4; df = 3, 10; p < 0.0001). Post hoc analyses identified differences in GABA levels between states. Relative to wakefulness, GABA levels decreased significantly during REM sleep (p = 0.0002) and REMNeo (p = 0.0002). Relative to NREM sleep, GABA levels were significantly lower during REM sleep and REMNeo (p = 0.0018 and 0.0017, respectively). No significant differences in GABA levels were found between REM sleep and REMNeo, or between wakefulness and NREM sleep. GABA levels (in pmol/10 μl; mean ± SEM) were 0.466 ± 0.046 during wakefulness, 0.365 ± 0.046 during NREM sleep, 0.268 ± 0.050 during spontaneous REM sleep, and 0.174 ± 0.025 during REMNeo.

GABA levels in cat pontine reticular formation varied as a function of sleep and wakefulness. A, Relative to wakefulness, GABA levels were significantly lower during spontaneous REM sleep and the REM sleep-like state caused by neostigmine (REMNeo). The asterisks indicate a significant decrease compared with wake. The pound symbols indicate a significant decrease relative to NREM sleep. B, C, Electrographic characteristics were similar between spontaneous REM sleep and the REM sleep-like state (REMNeo) caused by microinjecting neostigmine into the pontine reticular formation. D, Normalized EEG power spectra were calculated from recordings obtained during spontaneous REM sleep (black trace) and REMNeo (gray trace). The data for mean power during spontaneous REM sleep and REMNeo are from 10 experiments.
Representative electrographic recordings show that microinjecting neostigmine into the pontine reticular formation caused a REM sleep-like state characterized by the same electrographic traits as REM sleep (Fig. 3B,C). Figure 3D provides the first demonstration that spontaneous REM sleep and REMNeo have indistinguishable EEG power spectra. No significant differences in frontal EEG power during REM sleep and REMNeo were found in any frequency band ranging from 0.5 to 60 Hz.
GABA levels and ACh release in cat pontine reticular formation change in opposite directions during REM sleep
Figure 4 plots the percentage change in GABA levels and ACh release in the pontine reticular formation during sleep and wakefulness. Transmitter levels measured during wakefulness were set at 100%, and percentage change was calculated for each transmitter from its mean value during wakefulness. The ACh/GABA ratio was 1 during wakefulness, 1.2 during NREM sleep, and 3.5 during REM sleep. Percentage change values for GABA levels were calculated from the data shown in Figure 3A. Percentage change values for ACh levels were calculated from the data shown in the study by Leonard and Lydic (1997), their Figure 2. Methods for measuring ACh levels in cat pontine reticular formation during sleep and wakefulness have been described in detail (Leonard and Lydic, 1997; Vazquez and Baghdoyan, 2004; Lydic et al., 2006).

Extracellular levels of GABA and ACh in cat pontine reticular formation (PRF) show an inverse relationship during REM sleep. Data for GABA are from Figure 3A. Data points for ACh were calculated from Figure 2 in the study by Leonard and Lydic (1997).
Discussion
This study showed for the first time that endogenous GABA levels in cat pontine reticular formation are significantly lower during REM sleep than during wakefulness and NREM sleep. The results also demonstrated a significant decrease in GABA levels during the REM sleep-like state caused by microinjecting neostigmine into the contralateral pontine reticular formation. REM sleep and REMNeo were indistinguishable based on GABA levels and EEG power spectra. Histological analysis revealed that GABA levels did not vary significantly within the region of the pontine reticular formation tested in this study. Last, the results demonstrate that during REM sleep there is an inverse relationship between levels of endogenous GABA and ACh in the pontine reticular formation.
Endogenous GABA in the pontine reticular formation promotes wakefulness and inhibits REM sleep
Multiple, independent studies have suggested that GABA acts in the pontine reticular formation to promote wakefulness. GABA-containing neurons, terminals (de la Roza and Reinoso-Suárez, 2006; Rodrigo-Angulo et al., 2008; Liang and Marks, 2009), and GABAA receptors (Pirker et al., 2000; Heldt and Ressler, 2007) are present within the pontine reticular formation. When administered directly into the pontine reticular formation, GABAA receptor agonists or drugs that increase extracellular GABA levels cause an increase in wakefulness and a decrease in sleep (Camacho-Arroyo et al., 1991; Xi et al., 1999, 2001; Watson et al., 2008; Flint et al., 2010). In contrast, wakefulness is decreased and REM sleep is increased by pontine microinjection of GABA receptor antagonists or drugs that decrease GABA levels (Camacho-Arroyo et al., 1991; Xi et al., 1999, 2001; Sanford et al., 2003; Marks et al., 2008; Watson et al., 2008; Flint et al., 2010). Additionally, the increase in wakefulness caused by microinjecting hypocretin-1 into rat pontine reticular formation is blocked by coadministering the GABAA receptor antagonist bicuculline (Brevig et al., 2010). This finding supports the conclusion that, in the pontine reticular formation, hypocretin-1 causes an increase in wakefulness by increasing GABAergic transmission (Watson et al., 2008). In agreement with the wakefulness-promoting role of GABA within the pontine reticular formation, the general anesthetic isoflurane significantly decreases GABA levels in the pontine reticular formation (Vanini et al., 2008). Furthermore, pharmacologically increasing or decreasing GABA levels in the pontine reticular formation prolongs or reduces, respectively, the time needed to induce anesthesia with isoflurane (Vanini et al., 2008). The present results (Fig. 3A) show for the first time that endogenous GABA levels in the pontine reticular formation are significantly greater during wakefulness than during REM sleep. This finding is in contrast to data from the locus ceruleus (Nitz and Siegel, 1997a) and the dorsal raphe nucleus (Nitz and Siegel, 1997b), where GABA levels are significantly greater during REM sleep than during NREM sleep and wakefulness. Thus, there are regional differences in the pattern of changes in GABA levels across the sleep–wakefulness cycle within brainstem nuclei that regulate sleep. The results of Figure 3A are consistent with the interpretation that GABA in the pontine reticular formation promotes wakefulness and inhibits REM sleep. However, this interpretation is limited because of the correlational nature of changes in GABA levels across the sleep–wakefulness cycle. Therefore, this study next measured GABA levels in the pontine reticular formation while causing an increase in REM sleep.
GABA levels are decreased during cholinergically induced REM sleep
Administering cholinergic agonists or acetylcholinesterase inhibitors to a restricted region of the pontine reticular formation causes a REM sleep-like state in cat (Baghdoyan et al., 1984), rat (Bourgin et al., 1995), and mouse (Lydic et al., 2002). These data are consistent with long-standing evidence that cholinomimetics enhance REM sleep in humans (Sitaram et al., 1976, 1978). To further explore the relationship between endogenous GABA in the pontine reticular formation and REM sleep, additional experiments determined whether increasing REM sleep pharmacologically would cause a decrease in GABA levels. Neostigmine increased REM sleep (Fig. 1C) and decreased levels of GABA in the pontine reticular formation (Fig. 3A). These data suggest a causal relationship between decreased GABA in the pontine reticular formation and increased REM sleep. An additional novel finding to emerge from these studies was that spontaneous REM sleep and the REM sleep-like state caused by neostigmine showed indistinguishable electrographic phenotypes (Fig. 3B,C). Consistent with previous studies that used carbachol to increase REM sleep (Garzón et al., 1997), there was no significant difference in EEG power when comparing spontaneous REM sleep and REMNeo (Fig. 3D).
By what mechanism might causing an increase in ACh release by delivering neostigmine to one side of the pontine reticular formation cause a decrease in GABA levels in the contralateral pontine reticular formation? The portion of the pontine reticular formation studied here (Fig. 2) contains no clusters of cholinergic neurons. Cholinergic neurons in the laterodorsal and pedunculopontine tegmental nuclei (LDT and PPT) send projections to the pontine reticular formation (Mitani et al., 1988), where they release ACh (Lydic and Baghdoyan, 1993). Activation of muscarinic type 2 (M2) cholinergic receptors in the pontine reticular formation increases REM sleep (Baghdoyan and Lydic, 1999). Muscarinic receptor activation inhibits the discharge of some GABAergic neurons in the pontine reticular formation (Brown et al., 2008). M2 muscarinic receptors are localized to GABAergic neurons in the pontine reticular formation (Brischoux et al., 2008) and to dorsal subceruleus neurons that contribute to REM sleep generation (Heister et al., 2009). The present results support the interpretation that the increase in ACh caused by neostigmine activates M2 muscarinic receptors on GABAergic neurons in the pontine reticular formation, and that those neurons project to the contralateral pontine reticular formation where GABA levels were found to be decreased (Fig. 3A). Thus, the measured decrease in GABA levels likely reflects M2 muscarinic receptor-mediated inhibition of GABAergic cell bodies (Brown et al., 2008) that project to the contralateral pontine reticular formation.
GABA levels and ACh release within the pontine reticular formation show inverse changes during REM sleep
No single neurotransmitter or brain region regulates the complex constellation of traits that characterize sleep (Keifer et al., 1996; Steriade and McCarley, 2005; Datta, 2010). States of sleep and wakefulness result from an integrated balance of excitatory and inhibitory neurotransmission. The ACh/GABA ratio (Fig. 4) provides an innovative proportionality index of neurochemical excitation and inhibition. ACh release in the pontine reticular formation increases significantly during REM sleep relative to wakefulness and NREM sleep (Leonard and Lydic, 1997). Furthermore, causing an increase in ACh levels in the pontine reticular formation causes an increase in REM sleep (Baghdoyan et al., 1984; Lydic and Baghdoyan, 1993; Thakkar et al., 1996). Conversely, during REM sleep GABA levels in the pontine reticular formation decrease significantly below waking and NREM sleep levels (Fig. 3A). The inverse relationship between measured levels of ACh and GABA in cat pontine reticular formation during REM sleep (Fig. 4) provides strong support for the interpretation that low GABAergic tone and high cholinergic tone in the pontine reticular formation interact to generate REM sleep.
REM sleep is also regulated by a cholinergic–GABAergic interaction within the LDT and PPT. The LDT and PPT contain cells referred to as REM-on neurons because these cells fire at low rates during wakefulness and NREM sleep, and increase their firing rates before and during REM sleep (Steriade et al., 1990). REM-on neurons are cholinergic (Datta et al., 2009) and release ACh into the pontine reticular formation (Lydic and Baghdoyan, 1993) to generate REM sleep. Microinjection of the GABAB receptor agonist baclofen into rat PPT suppresses the firing rate of REM-on neurons and decreases the amount of REM sleep (Ulloor et al., 2004; Datta, 2007). These data support the interpretation that GABAergic transmission at GABAB receptors within the PPT inhibits REM sleep, in part, by decreasing ACh release in the pontine reticular formation. Interestingly, GABAergic neurons within cat PPT express Fos during cholinergically induced REM sleep (Torterolo et al., 2001), suggesting that these GABAergic neurons are also active during spontaneous REM sleep. Furthermore, microinjecting the GABAA receptor agonist muscimol into cat PPT increases REM sleep and decreases wakefulness (Torterolo et al., 2002), and blocking GABAA receptors in rat PPT decreases REM sleep and increases wakefulness (Pal and Mallick, 2004). A mechanism by which GABAergic inhibition at GABAA receptors within the LDT and/or PPT could promote REM sleep has not been identified. In vitro studies have shown that GABAergic drugs alter the excitability of cholinergic LDT neurons in mouse brain slices by activating GABAA, GABAB, and GABAC receptors (Kohlmeier and Kristiansen, 2010). These data from different laboratories, using various approaches and several species, suggest that GABAA and GABAB receptors within the LDT and PPT may play opposite roles in regulating REM sleep and may have opposite effects on ACh release. Sleep-dependent changes in the ACh/GABA ratio within the LDT and PPT remain to be quantified.
Limitations and conclusions
GABAergic signaling is regulated by an interaction between astrocytes, presynaptic terminals, and postsynaptic neurons (Perea et al., 2009). The complexity of neurochemical communication in the tripartite synapse is a limitation for efforts to determine the source of extracellular GABA sampled by microdialysis (Watson et al., 2006, 2008; Westerink et al., 2007; Vanini et al., 2008). Another complexity that limits the interpretation of results from microdialysis studies of GABA is that GABAA receptor-mediated inhibition can be phasic and/or tonic. Rapid, phasic inhibition is mediated by synaptic receptors that are activated by a transient release of GABA from presynaptic terminals. Tonic inhibitory control is mediated by extrasynaptic GABAA receptors that are activated by lower ambient concentrations of extracellular GABA that originates from both neuronal and glial sources. Extrasynaptic GABAA receptors mediate volume transmission that can modulate the excitability of widely distributed networks (Mody, 2001; Belelli et al., 2005; Harrison, 2007). The spatial resolution of microdialysis cannot distinguish between synaptic and extrasynaptic sources of GABA.
In conclusion, this study provides two novel lines of evidence showing that endogenous GABA promotes wakefulness and inhibits the REM phase of sleep. First, REM sleep always was associated with a significant decrease in GABA levels. Second, causing an increase in the amount of time spent in REM sleep always caused a decrease in GABA levels. Thus, at least part of the extracellular pool of endogenous GABA in the pontine reticular formation functions to generate wakefulness and inhibit REM sleep. This finding is directly relevant for efforts to understand the neurochemical mechanisms by which sedative/hypnotic (Hambrecht-Wiedbusch et al., 2010) and anesthetic (Vanini et al., 2008) molecules eliminate wakefulness.
Footnotes
This work was supported by National Institutes of Health Grants MH45361, HL40881, and HL65272, and by the Department of Anesthesiology, University of Michigan (Ann Arbor, MI). We thank Dr. C. J. Watson for consultation on the measurement of GABA, L. A. Bouchard, S. Jiang, M. A. Norat, and H. Soto-Calderon for expert assistance, and K. Welch of the University of Michigan Center for Statistical Consultation and Research for help with statistical analyses.
- Correspondence should be addressed to Dr. Helen A. Baghdoyan, Department of Anesthesiology, University of Michigan, 7433 Medical Science Building I, 1150 West Medical Center Drive, Ann Arbor, MI 48109-5615. helenb{at}umich.edu


