

Abstract
Major depressive disorder is the most common mental illness. Mounting evidence indicates that astrocytes play a crucial role in the pathophysiology of depression; however, the underlying molecular mechanisms remain elusive. Compared with other neuronal cell types, astrocytes are enriched for arachidonic acid metabolism. Herein, we observed brain-region-specific alterations of epoxyeicosatrienoic acid (EET) signaling, which is an arachidonic acid metabolic pathway, in both a mouse model of depression and postmortem samples from patients with depression. The enzymatic activity of soluble epoxide hydrolase (sEH), the key enzyme in EET signaling, was selectively increased in the mPFC of susceptible mice after chronic social defeated stress and was negatively correlated with the social interaction ratio, which is an indicator of depressive-like behavior. The specific deletion of Ephx2 (encode sEH) in adult astrocytes induced resilience to stress, whereas the impaired EET signaling in the mPFC evoked depressive-like behaviors in response to stress. sEH was mainly expressed on lysosomes of astrocytes. Using pharmacological and genetic approaches performed on C57BL/6J background adult male mice, we found that EET signaling modulated astrocytic ATP release in vitro and in vivo. Moreover, astrocytic ATP release was required for the antidepressant-like effect of Ephx2 deletion in adult astrocytes. In addition, sEH inhibitors produced rapid antidepressant-like effects in multiple animal models of depression, including chronic social defeated stress and chronic mild stress. Together, our results highlight that EET signaling in astrocytes in the mPFC is essential for behavioral adaptation in response to psychiatric stress.
SIGNIFICANCE STATEMENT Astrocytes, the most abundant glial cells of the brain, play a vital role in the pathophysiology of depression. Astrocytes secrete adenosine ATP, which modulates depressive-like behaviors. Notably, astrocytes are enriched for arachidonic acid metabolism. In the present study, we explored the hypothesis that epoxyeicosatrienoic acid signaling, an arachidonic acid metabolic pathway, modulates astrocytic ATP release and the expression of depressive-like behaviors. Our work demonstrated that epoxyeicosatrienoic acid signaling in astrocytes in the mPFC is essential for behavioral homeostatic adaptation in response to stress, and the extent of astrocyte functioning is greater than expected based on earlier reports.
- ATP
- astrocytes
- depression
- epoxyeicosatrienoic acid signaling
- medial prefrontal cortex
- soluble epoxide hydrolase
Introduction
Major depressive disorder (MDD) is a devastating mental illness that affects at least 350 million people worldwide and is associated with a serious suicide risk and socioeconomic consequences (World Health Organization, 2017). Despite significant progress in the development of therapeutic agents, fewer than half of all patients respond to the currently prescribed antidepressant medications, emphasizing the pressing need to investigate the biological mechanisms underlying MDD and antidepressant responses.
Astrocytes, which are at least as abundant as neurons in the CNS, are crucial for sustaining nearly all aspects of brain functions, including ion and neurotransmitter homeostasis, neural circuit formation, synaptic plasticity, and function as well as neurovascular coupling (Allen and Eroglu, 2017). Accumulated evidence supports the notion that a dysfunction of astrocytes in frontolimbic regions is involved in the pathophysiology of MDD (Banasr et al., 2011; Torres-Platas et al., 2016). Morphological and numerical changes in glia have been observed in the prefrontal area in postmortem studies as well as animal models of depression (Ongür et al., 1998; Miguel-Hidalgo et al., 2000). Pharmacologic glial ablation in the mPFC induces depressive-like behaviors, indicating that glial dysfunction might represent a cause-effect for depression (Banasr and Duman, 2008). Astrocytes are known to release multiple signaling molecules, including adenosine ATP, adenosine, d-serine, and glutamate, which are vital in the induction of depressive symptoms and antidepressant responses (Banasr et al., 2010; Cao et al., 2013; Hines et al., 2013). However, the mechanisms underlying astrocyte dysfunction in depression remain largely unknown.
Previous studies have shown that the brain is highly enriched with polyunsaturated fatty acids, especially arachidonic acid (ARA) (Bazinet and Layé, 2014). Compared with other neuronal cell types, astrocytes exhibit increased fatty acid metabolism (Cahoy et al., 2008). Eicosanoids, locally acting bioactive signaling lipids, arise from ARA and related polyunsaturated fatty acids mainly through lipoxygenase (LOX), cyclooxygenase (COX), and cytochrome P450 (CYP) enzymes. CYP enzymes in the eicosanoid pathway comprise two distinct enzymatic activities: ω-hydroxylases generate hydroxyeicosatetraenoic acids (n-HETEs) and the epoxygenases convert ARA into epoxyeicosatrienoic acids (EETs) (Morisseau and Hammock, 2013; Bazinet and Layé, 2014). By adding water across the epoxide to produce the corresponding less active dihydroxyeicosatrienoic acids (DHETs), soluble epoxide hydrolase (sEH) mediates the dominant pathway among a variety of EET metabolic pathways in many tissues (EET signaling hereafter) (Fig. 1A). sEH is mainly expressed in astrocytes (Marowsky et al., 2009; Zhang et al., 2014), and clinical and observational studies suggest that polyunsaturated fatty acid metabolism might be involved in the pathophysiology of MDD (Hibbeln, 1998; Bazinet and Layé, 2014; Liu et al., 2015). In this context, we investigated whether and how eicosanoid signaling plays a role in depression. Here we found that EET signaling regulates ATP release from astrocytes, and we present evidence showing that EET signaling in astrocytes in the mPFC is essential for the expression of depressive-like behaviors.
Materials and Methods
Mouse models.
Four or five mice were housed in a ventilated closed-system exhaust cage at 24 ± 1°C. The mice were raised under standard laboratory conditions [12 h light/dark cycle (lights on from 7:00 A.M. to 7:00 P.M.) with free access to food and water]. All experiments were conducted in accordance with the Chinese Council on Animal Care Guidelines. All mice were handled twice per day for 3–4 d before the behavioral experiments, and the double-blind behavioral tests were performed between 1:00 P.M. and 4:00 P.M. Male C57BL/6J mice (aged 10–12 weeks) were obtained from the Southern Medical University Animal Center (No: SCXK-2016–0041, Guangzhou, China).
The loxp-flanked Ephx2 mouse line was generated by Shanghai Biomodel Organism Science and Technology Development. Briefly, a targeting vector was designed to insert loxp sites and an FRT-flanked neomycin-selection cassette (Neo) around exon 2 of Ephx2. The construct was electroporated into C57BL/6J*129S3-derived embryonic stem cells. Through several rounds of G418 and Ganciclovir selection, 130 colonies were isolated and rescreened using genomic PCR genotyping with the following primers: 5p: CCCGATAACCTTGGCAGACAGAATA; Neo-reverse: GGCCTACCCGCTTCCATTGCTC; Neo-forward: CCGTGCCTTCCTTGACCCTGG; and 3p: AGTGTATATTATCTGGAGGTGGAGGCTTT. According to the results of the DNA sequencing and sequence alignment, three correctly targeted clones were identified and chosen for blastocyst injection. Six resulting chimeras were bred to C57BL/6J mice. The F1 pups from male chimeras were screened for mice carrying the correct mutant allele using the prior genomic PCR genotyping. The chimeric mice were crossed with C57BL/6J mice to generate Ephx2+/flox-neo mice, which were bred with Act-FLP transgenic mice (The Jackson Laboratory, catalog #003800, RRID:IMSR_JAX:003800) to remove the FRT-flanked-neo cassette; then Ephx2+/loxp mice were backcrossed with C57BL/6J mice for at least 10 generations. The Ephx2loxp allele was genotyped with primer pair 5′-ATGACTCTCTCCTTGGCTTGAG-3′ and 5′-GAATTTGCAGCTGTGAATACCA-3′. The expected PCR products were 1143 bp for the WT allele and 1287 bp for the floxed allele.
The Fgfr3-iCreERT2 mice (C57BL/6J background) were generously provided by William D. Richardson (University College London, London). The Fgfr3-Ephx2−/− mice were generated by crossing Ephx2loxp/loxp mice with Fgfr3-iCreERT2 mice. To excise the loxp sites with Cre recombination, 2-month-old male mice were intraperitoneally injected with tamoxifen (TAM) (Sigma-Aldrich, catalog #T5648) once a day (100 mg/kg) for 5 d. TAM was dissolved in corn oil (Sigma-Aldrich, catalog #C8267) at a final concentration of 10 mg/ml. Littermate Ephx2loxp/loxp mice injected with TAM were used as controls (Fgfr3-Ephx2+/+). Behavioral tests were conducted on the 3-month-old male mice studied 30 d after the first TAM injection.
The Ephx2−/− (The Jackson Laboratory, catalog #004165, RRID:IMSR_JAX:004165) and Cre-dependent ROSA26 tdTomato reporter (The Jackson Laboratory, catalog #007909, RRID:IMSR_JAX:007909) mouse lines were purchased from The Jackson Laboratory. The Fgfr3-tdTomato mice were generated by crossing Fgfr3-iCreERT2 mice with ROSA26-tdTomato mice. All mice had the C57BL/6J genetic background.
Human subjects.
Ethics approval for this study was obtained from the research ethics board at Southern Medical University (Guangzhou, China). Postmortem brain samples from depressed suicide subjects, and matched accidental or natural death controls were provided by the Suicide Section of the Douglas-Bell Canada Brain Bank (http://www.douglas.qc.ca/page/brain-bank). All psychiatric subjects died by suicide in the context of an MDD, whereas all control subjects died suddenly and had no psychiatric, neurological, or inflammatory illnesses. All tissue samples were dissected from Brodmann areas 24 (BA24) and 47 (BA47) and stored at −80°C until use. The groups were matched according to age, tissue pH, and postmortem interval. All subjects were white. Detailed information for the human subjects is listed in Table 1.
Complete demographic information for postmortem subjectsa
qRT-PCR.
Total RNA was extracted from the mPFC of adult C57BL/6J mice and human brain tissues with RNAiso Plus (Takara) according to the manufacturer's instructions. cDNA was synthesized using the PrimeScriptTM RT Reagent Kit (Takara). The amplified products were used to derive standard curves for qRT-PCR. The Stratagene Mx3005P System (Agilent Technologies) was used for the real-time PCR with SYBR Premix Ex TaqTM (Takara). The reactions were run in triplicate, and ribosomal protein S18 levels were used as an endogenous control for normalization with the ΔΔCt method. The qPCR primers are listed in Fig. 1-1).
Western blot analysis.
Mice were rapidly decapitated, and the tissues were prepared from the mPFC, hippocampus, cerebral cortex, and striatum. Samples from human and mouse brain tissues were sonicated in a detergent-based lysis buffer (50 mm Tris, pH 7.4, 150 mm NaCl, 1% Triton X-100, 1% sodium deoxycholate, 0.1% SDS, and PMSF). After centrifugation at 16,000 × g for 30 min, the supernatant was collected and quantified using the BCA Protein Assay Kit (Thermo Fisher Scientific). Equal amounts of protein sample were separated by 10% SDS-PAGE and transferred to PVDF membranes (PerkinElmer). Blots were incubated in the appropriate primary antibody: sEH (1:1000, kindly gifted by Bruce D. Hammock, University of California at Davis); COX-1 (1:1000, Cayman Chemical, catalog #160110, RRID:AB_10078135); COX-2 (1:1000, Cayman Chemical, catalog #160116, RRID:AB_10104644); CYP2J2 (1:1000, Abcam, catalog #ab69651, RRID:AB_1268430); CYP4A11/22 (1:1000, Abcam, catalog #ab152000);CYP2C (1:1000, Abnova, catalog #CJ36131); 5-LOX (1:1000, Cayman Chemical, catalog #160402, RRID:AB_327982); 12-LOX (1:1000, Santa Cruz Biotechnology, catalog #K1609, RRID:AB_2289570); 15-LOX (1:1000, Santa Cruz Biotechnology, catalog #E2014, RRID:AB_2137289); GAPDH (1:1000, Good Here, catalog #AB-P-R001); GFAP (1:1000, Santa Cruz Biotechnology, catalog #sc-6170, RRID:AB_641021); and NeuN (1:1000, Millipore, catalog #MAB377, RRID:AB_2298772). Antibody binding was detected using the following secondary antibodies: peroxidase-conjugated AffiniPure goat anti-rabbit IgG (H+L) and goat anti-mouse IgG (H+L) (1:5000, ZSGB-Bio). For analysis, protein levels were normalized to GAPDH on the same gel. All quantifications were performed with AlphaEase FC software (Alpha Innotech).
Protein cross-linking.
A protein cross-linking assay was performed as described in a previous report (Zhang et al., 2011). Briefly, samples from patients with MDD and matched controls or mouse brain samples were homogenized in ice-cold PBS (0.1 m phosphate, 0.15 m NaCl, pH 7.2. Protein supernatants were collected after centrifugation (4°C, 9000 rpm, 15 min), and the protein concentration was assayed. An equal amount of protein sample was cross-linked in 5 mm Sulfo-EGS (Thermo Fisher Scientific, catalog #21566) on ice for 2 h. The cross-linking reaction was terminated by adding a final concentration of 10 mm Tris. Then, the samples were subjected to 10% SDS-PAGE and transferred to PVDF membranes for Western blot analysis.
sEH activity assay.
The sEH enzyme activity was measured using an ELISA kit (R&D Systems, catalog #SH1) according to the manufacturer's instructions. Mice were rapidly decapitated 24 h after the chronic social defeated stress (CSDS) paradigm, and samples were collected from the mPFC or hippocampal tissues. Samples were lysed by Dounce homogenization in 0.1 m PBS at 4°C, followed by centrifugation at 9000 rpm for 10 min. Hydrolase enzymatic reactions were initiated by addition of 14,15-EET (1 μm) and incubation in a shaking water bath at 37°C for 1 h; then the concentration of 14,15-DHET was measured.
EET measurements.
Ultra performance liquid chromatography-tandem mass spectrometry (UPLC-MS/MS) analysis was performed to determine EET levels in brain tissue samples as in our previous report (Zhang et al., 2018). The UPLC-MS/MS system consisted of a Prelude HPLC System with TurboFlow (TX) mode and TSQ Quantiva (Thermo Fisher Scientific). For sample extraction and chromatographic separation, the TurboFlow-LC system was equipped with TurboFlow Cyclone P columns (0.5 × 50 mm, Thermo Fisher Scientific), and reversed-phase separation was performed on an Acquity UPLC BEH C18 column (2.1 × 100 mm, 1.7 μm, Waters). The internal standard 11,12-EET d11 and other standards, 5,6-EET, 8,9-EET, 11,12-EET, and 14,15-EET, were purchased from Cayman Chemical. HPLC-grade water (pure distilled) was obtained from Watsons Water; acetonitrile, methanol, and 2-propanol were from Merck KGaA; and acetic acid was from Thermo Fisher Scientific. A simple protein precipitation was used for the preparation of samples. Briefly, the brain tissue samples collected from the mPFC, NAc, striatum, cerebral cortex (without the PFC), and hippocampus were added to 10-fold PBS, pH 7.4, and then homogenized for 1 min (4°C, 6500 rpm) (Bertin Precellys 24-Dual, Bertin Technologies). The suspension, containing 800 nm trans-4-{4-[3-(4-trifluoromethoxy-phenyl)-ureido]-cyclohexyloxy}-benzoic acid (TUCB), was added to an equal volume of a mixture of methanol and acetonitrile (50/50, v/v), containing internal standard (20 ng/ml), and vortexed for 10 min. The mixture was centrifuged at 5000 rpm (4°C) for 1 min, precipitated for 1.5 h (−20°C), and centrifuged at 14,000 rpm (4°C) for 10 min. The supernatant (200 μl) was collected for UPLC-MS/MS analysis.
The mobile phase consisted of (1) 0.02% acetic acid in water, (2) acetonitrile, and (3) acetonitrile/2-propanol (50:50, v/v). A 20 μl aliquot of each sample was injected into the column. The autosamplers were kept at 4°C and the column at 40°C. The total analysis time for each sample was 10 min. Data were manipulated with TraceFinder 3.3 software (Thermo Fisher Scientific).
Immunofluorescence.
The brain tissue preparation and immunohistochemistry were performed according to a protocol that is used in our laboratory. Mice were deeply anesthetized with pentobarbital (80 mg/kg, i.p.) and perfused with PBS followed by 4% PFA. Brains were dissected out, postfixed, rinsed, and immersed in 30% sucrose solution. Coronal sections (40 μm) containing mPFC or hippocampus were collected on a freezing microtome (Leica, CM1850). The sections were blocked in 10% normal goat serum and 0.3% Triton X-100 for 2 h and then stained with one or two primary antibodies overnight at 4°C, followed by washout and secondary antibody incubation for 2 h. The sections were mounted with a Vectashield mounting medium containing DAPI (Vector Laboratories).
For cell culturing, astrocytes growing on coverslip were fixed with 4% PFA for 15 min, and subsequent staining was performed as described for the brain sections. In some experiments, astrocytes were loaded with LysoTracker (Invitrogen, L7528) for 45 min or MitoTracker (Invitrogen, M7512) for 20 min at 37°C, and then washed with PBS for 5 min before fixation for staining. Fluorescence images were obtained using an A1R confocal microscope (Nikon Instruments). Colocalization between sEH and organelle markers was quantified using Pearson's correlation coefficient with NIS Elements version 4.5 (Nikon Instruments), and the data represent the means of > 30 cells from three independent experiments.
Imaging and analysis of the structured illumination microscopy (SIM) were performed with an N-SIM system (Nikon Instruments). The setup consisted of a Ti-E stand with Perfect Focus, 100 × 1.49 NA TIRF objective lens, LU5 laser bed (Nikon Instruments, 405, 488, 561, and 640 nm laser lines), 3D SIM grating, and Andor DU897 EMCCD camera. Images were processed using NIS Elements version 4.5 (Nikon Instruments).
The antibodies used were mouse anti-GFAP (1:300, Cell Signaling Technology, catalog #3670P, RRID:AB_561049), rabbit anti-sEH (1:300, a kind gift from Bruce D. Hammock), rat anti-LAMP1 (1:100, DSHB, catalog #1D4B, RRID:AB_2134500), mouse anti-GM130 (1:300, BD Bioscience, catalog #610822, RRID:AB_398141), AlexaFluor-488 goat anti-rabbit IgG (1:500, Invitrogen, catalog #A11034), AlexaFluor-594 goat anti-rabbit IgG (1:500, Invitrogen, catalog #A11037), AlexaFluor-594 goat anti-mouse IgG (1:500, Invitrogen, catalog #A11032, RRID:AB_141672), AlexaFluor-568 goat anti-rat IgG (1:500, Invitrogen, catalog #A11077, RRID:AB_141874), AlexaFluor-488 donkey anti-rat IgG (1:500, Invitrogen, catalog #A21208, RRID:AB_141709), and AlexaFluor-647 donkey anti-mouse IgG (1:500, Invitrogen).
Cell culture.
Tissues isolated from the hippocampus or cerebral cortex of postnatal day 1 mice were washed in ice-cold PBS and transferred to a 50 ml Falcon tube containing 0.5 ml PBS for dissociation using a pair of sterile operating scissors. They were then incubated with 0.25% trypsin (Invitrogen) in 0.5 mm EDTA at 37°C for 10 min. Culture medium was added to inhibit the trypsin, and the cell suspension was transferred into 15 ml tubes and centrifuged at 9000 × g for 6 min. The pellet was resuspended in 10 ml of culture medium (for neurons, Start Medium: Neurobasal Medium-A 500 ml + B27 10 ml + Glutamax-100X 5 ml + Glutamate 25 μm; Culture Medium: Neurobasal Medium-A 500 ml + B27 10 ml + Glutamax 100X 5 ml; for astrocytes, DMEM F12 500 ml + FBS 50 ml). The cells were placed in a culture flask at a density of 5 × 10⁶ cells per 5 ml and incubated in a humidified incubator containing O2/5% CO2/95% air at 37°C.
Electron microscopy.
Primary astrocytes were fixed with 4% PFA and 0.1% glutaraldehyde in PBS, pH 7.4, for 2 h. Fixed cells were rinsed in PBS, embedded in 12% gelatin, infiltrated with 2.3 m sucrose, and frozen and stored in liquid nitrogen until use. Ultrathin cryosections (70 nm thick) were cut with an ultramicrotome (Leica Microsystems, FC7) and transferred to formvar-coated grids. For immunolabeling, the cryosections were blocked with 5% normal goat serum and labeled with primary antibody (rat anti-LAMP1) and secondary antibody (10 nm colloid gold-conjugated goat anti-rat antibody; Sigma-Aldrich, catalog #G7035, RRID:AB_259949). The gold-labeled cryosections were postfixed in 2.5% glutaraldehyde for 5 min before being rinsed with PBS. After the first labeling, all the steps from blocking to postfixation were repeated, but with a different primary antibody (rabbit anti-sEH) and a different secondary antibody (5 nm colloid gold-conjugated goat anti-rabbit antibody; Sigma-Aldrich, catalog #G7277, RRID:AB_259951). The sections were stained with uranyl acetate/methyl cellulose to increase contrast. Images were captured using a transmission electron microscope (FEI) at 100 kV.
Viral constructs and packing.
The lentivirus used in this study was produced by Obio Technology. Briefly, the Ephx2 shRNAs, hEPHX2, Lys55Arg, or EGFP alone as well as package helper plasmid (pspax2, pMD2G) were subcloned into the pLenti-UbiC-EGFP vector and transfected into HEK293T cells for 72 h. After transfection, the supernatant was collected and purified by an ultracentrifugation method. The titer of the lentivirus reached 1.5 × 10⁹ IU/ml. The concentrated lentivirus was aliquoted and stored at −80°C. To construct the hEPHX2 expression vector, the human EPHX2 coding sequence (NM_001979) was amplified with the following primers: EPHX2 forward, 5′-ATCCCCGGGTACCGGAATTCGCCACCATGGTGAGCAAGGGCGAGGAG-3′, and EPHX2 reverse, 5′-CTTGATATCGAATTACCGGTTTACATCTTTGAGACCACCGGTG-3′. It was then linked to the 3′ end of EGFP from the pLenti-UbiC-EGFP vector by interchanging recombination. The sEH mutant contained the amino acid polymorphism Lys55Arg. To construct shRNAs, oligonucleotides containing the 21-base sense and antisense sequences were connected with a hairpin loop followed by a poly(T) termination signal. The sequences targeting Ephx2 (NM_007940) used in the experiments were (1) 5′-GAGCCAATCTACCTGAGAATT-3′ and (2) 5′-GCAGCTGATTGGAGAGTAA-3′. The scrambled sequence for the control shRNA was TTCTCCGAACGTGTCACGT.
AAV-P2rx2-shRNA and control shRNA have been previously described (Cao et al., 2013). The sequence targeting P2rx2 (NM_153400) that was used in the experiments was 5′-CCAAAGGTTTGGCCCAACTTT-3′, and the sequence of the control shRNA was 5′-TTCTCCGAACGTGTCACGT-3′.
Extracellular ATP measurements.
ATP levels were quantified using a bioluminescent ATP assay kit (Promega, catalog #G7571) and measured with a Victor 3 luminometer (PerkinElmer) according to the manufacturer's instructions. Ectonucleotidase inhibitor (ARL 67156 trisodium salt, Sigma-Aldrich, catalog #A265, 50 μm) was added to the testing medium to block ATP hydrolysis. A calibration curve was established based on standard ATP samples, and normal medium was used as the ATP level of the background. For the pharmacological experiments, astrocytes were treated with vehicle (0 μm) or sEH inhibitors (sEHIs) (1-trifluoromethoxyphenyl-3-(1-propionylpiperidin-4-yl) urea [TPPU] or TUCB, kindly gifted by Bruce D. Hammock, at 10, 20, 50, 100, and 200 μm, respectively), 14,15-EET (0.25, 0.5, 1.0, 2.0, 5.0, 10, and 20 μm, respectively), 5,6-EET (1, 5 μm), 8,9-EET (1, 5 μm), or 11,12-EET (1, 5 μm) for 5 min. Then, the culture medium was collected and centrifuged for the ATP assay. To block the effects of sEHIs or 14,15-EET, astrocytes were pretreated with 14,15-EEZE (an antagonist of 14,15-EET, Cayman Chemical, catalog #10004946, 10 μm) for 60 min, and then 14,15-EET (1 μm) or sEHIs (TPPU 100 μm, TUCB 50 μm) were applied. The medium was collected 5 min later for the ATP assay. For the in vitro Ephx2 knockdown experiments, the medium was collected for the ATP assay 96 h after transfection. For the overexpression experiments, astrocytes were transduced with pLenti-hEPHX2, Lys55Arg, or EGFP, and the medium was collected 72 h after infection.
For ex vivo detection of Ephx2−/− mice, acute brain slices (300 μm × 2) containing the mPFC (briefly, PFC slices) or hippocampal slices were cut and incubated in oxygenized ACSF with ectonucleotidase inhibitor (10 μm) at 37°C, and the medium was collected 12 min later for the ATP assay. For quantification, ATP levels were normalized to the total protein in each sample.
Microdialysis.
To exclude the possible effect of circadian rhythms on ATP levels, we prepared two setups and extracted samples from Fgfr3-Ephx2−/− mice and control littermates during the same time window. Briefly, under deep anesthesia with isoflurane (3% induction, 1.5% maintenance), a mouse was mounted on the stereotaxic apparatus (Stoelting) and implanted with a guide cannula (CMA, CMA/7) directed toward the right mPFC (anteroposterior = 1.9 mm; mediolateral = 0.3 mm; dorsoventral = 1.3 mm). An implanted probe (CMA/7, membrane length: 1–2 mm, molecular weight cutoff: 6000 Da, outer diameter: 0.24 mm) was perfused with ACSF using a syringe pump (CMA 402) at a flow rate of 1 μl/min. One hour after probe insertion, two dialysate samples were automatically collected every 60 min from each mouse using the microfraction collector (CMA 142). The ectonucleotidase inhibitor was added to each sample collection to decrease ATP hydrolysis, and ATP levels were measured immediately.
Stereotaxic microinjection, implantation of a cannula and osmotic minipump.
Mice were anesthetized with isoflurane (3% induction, 1.5% maintenance) and placed in a stereotaxic apparatus. For in vivo lentivirus injection, mice were bilaterally injected with a total of 2 μl virus into the mPFC (1 μl for each side) at a controlled rate of 0.1 μl/min using a 5 μl Hamilton microsyringe fitted with a 33-gauge needle and a microsyringe pump (Stoelting). The needle was first lowered into one side of the mPFC (anteroposterior = 1.9 mm; mediolateral = 0.3 mm; dorsoventral = 2.7 mm), and 0.5 μl of virus was injected over 5 min. Following a 5 min delay, the needle was pulled up 0.3 mm, and an additional 0.5 μl of the virus was injected. The needle was slowly withdrawn 5 min after the second injection. The same procedure was performed on the other side of the mPFC. For AAV-P2rx2-shRNA injection, the mice were bilaterally injected with a total of 1 μl virus into the mPFC (0.5 μl for each side). Experiments were conducted 2 weeks after the injection. The location of the viral infection was confirmed by examining EGFP expression at the end of the tests.
For pharmacological experiments, a guide cannula was unilaterally implanted into the right cerebral ventricle (anteroposterior = −0.6 mm; mediolateral = 1.5 mm; dorsoventral = 2.0 mm), the mPFC (anteroposterior = 1.9 mm; mediolateral = 0.3 mm; dorsoventral = 2.5 mm), or the hippocampus (anteroposterior = −2.0 mm; mediolateral = 1.2 mm; dorsoventral = 2.0 mm). The mice were allowed to recover for 1 week after implantation. All behavioral tests were performed 30 min after the infusion. TPPU (0.2, 1.0, 10 μm), TUCB (0.2, 1.0, 10 μm), 14,15-EET (0.1, 0.25, 1.0, 4.0 μg), 5,6-, 8,9-, or 11,12-EET (1 μg), 14,15-EEZE (10, 25, 50 ng/μl), isopyridoxal-phosphate-6-azophenyl-2′,4′-disulfonate (PPADS, 50 μm, Sigma-Aldrich, catalog #P178), and 8-cyclopentyltheophylline (CPT, 5 μm, Sigma-Aldrich, catalog #C102) were delivered using an automatic injector (Stoelting, 53311).
The osmotic pump implantation was conducted in mice that underwent chronic social defeat stress. Following 3 d of recovery, the mice were implanted with an osmotic pump (Alzet, model 1007D) in the right lateral cerebral ventricle (anteroposterior = −0.6 mm; mediolateral = 1.5 mm; dorsoventral = 2.0 mm). The pumps were filled with vehicle or TPPU (final concentration: 1 μm) that was delivered at a rate of 0.5 μl/h. Social avoidance behavior was assessed 7 d after pump implantation.
CSDS.
An experimental mouse underwent 10 min of physical attack daily with a different aggressive CD1 mouse for 10 consecutive days. Following the daily defeat, the experimental mouse and the aggressor were separated by a perforated translucent plastic divider. The control mice were housed in pairs separated by a divider and rotated daily but never exposed to the CD1 aggressors. Social avoidance behavior was assessed 24 h after the last defeat. The procedure consisted of two phases of 2.5 min each. The mouse was allowed to explore freely in the first 2.5 min (no target) in a novel arena containing a small animal cage placed on one side of the arena. Then, during the second 2.5 min, the mouse was reintroduced back into the arena in the presence of a novel caged CD1 mouse. The duration of time that the mouse spent in the interaction zone was tracked using Ethovision 7.0 software (Noldus). The social interaction (SI) ratio was defined as the (interaction time, target)/(interaction time, no target) × 100. Susceptible and resilient mice were separated by the SI ratio: scores <100 were considered susceptible, and those with scores ≥100 were considered resilient. For the pharmacologic approaches, mice were singly housed following the CSDS paradigm, and the behavior test was performed 24 h after the treatments. Drugs [vehicle, imipramine (IMI, 15 mg/kg), TPPU (1 mg/kg), and TUCB (1 mg/kg)] were injected daily (i.p.) beginning at the end of CSDS, for 3, 7, or 28 d, respectively.
For the subthreshold social defeat procedure, a mouse was exposed to a different CD1 aggressor for 10 min defeat bouts once a day for 2 d and maintained in sensory contact for 24 h using a divider. Avoidance behavior was assessed 24 h after the last defeat. Social defeat stress was induced between 4:00 P.M. and 5:00 P.M.
Forced swimming test (FST).
Mice were gently placed in a transparent glass cylinder (height 45 cm, diameter 19 cm) of water (22°C-25°C, 23 cm in height). The immobility time was recorded during the last 4 min of a 6 min test session by an observer who was blinded to the animal treatments or genotypes. The same batch of mice would be tested in the open field test 7 d later for locomotor activity analysis.
Open field test.
Mice were placed in an open chamber (Accuscan Instruments) with transparent, plastic walls and allowed to explore freely for 5 min. The total distance traveled across a session was analyzed using Versmax analyzer software.
Elevated plus maze.
The elevated plus maze consisted of two opposite open arms (30 × 5 × 0.5 cm), two opposite closed arms (30 × 5 × 15 cm), and a central platform (5 × 5 cm). The mice were gently placed in the central platform to explore the plus maze for 5 min. A video tracking system (EthoVision, Noldus) was used to track the duration, distance in open arms, and entries into open arms.
Light-dark box test.
For the light-dark box test, the chamber (Accuscan Instruments) was partitioned into two equally sized compartments, one light and one dark, with a hole in the partition wall that allowed free passage between the compartments. The mice were placed in the center of the light compartment facing away from the hole and tested for 5 min. The duration spent in the dark compartment and the number of transitions between the two compartments were analyzed using Versmax analyzer software.
Chronic mild stress (CMS) and sucrose preference test.
The CMS paradigm was performed according to our previous work (Cao et al., 2013). Briefly, mice were singly caged and habituated to a 1% sucrose solution. The sucrose preference of each mouse was measured weekly. The coat score was evaluated by seven body parts: head, neck, dorsal coat, ventral coat, tail, forepaws, and hindpaws. After 2 or 3 weeks of acclimatization, the mice were assigned to different experimental groups according to their sucrose preference and coat score. Then, the mice were exposed to a variable series of mild and unpredictable stressors. The stressors consisted of restraint (3 h), forced swimming in ice-cold water (5 min), food and water deprivation (24 h), cage tilting (45 angle, three times, 12 h each), reversal of the light-dark cycle (once), strobe light (12 h), and wet bedding (twice, 14 h each). For the pharmacological treatments, vehicle, IMI (15 mg/kg), TPPU (1 mg/kg), or TUCB (1 mg/kg) was injected daily (i.p.) beginning at the fourth week, for 28 d. The stressors lasted until the end of the treatment. The nonstressed control mice were housed in the adjacent room.
Experimental design and statistical analyses.
All data were analyzed using SPSS 20.0 (IBM) or Prism 7 (GraphPad Software). Data are mean ± SEM. Two-tailed Student's t tests (for two-group comparisons) and one-way ANOVA (for multiple-group comparisons) followed by the least significant difference test when equal variances were assumed or Dunnett's T3 test when equal variances were not assumed for post hoc comparisons (SPSS 20.0, IBM) were performed. Two-way ANOVA following Bonferroni's multiple-comparisons test was used for repeated measures (GraphPad, Prism 7). Differences were considered to be significant if p < 0.05.
Results
Impaired EET signaling in human depression and mouse CSDS
To examine the role of ARA metabolism in depression, we first screened 44 genes selected from the ARA KEGG pathway in the mPFC, a candidate site for impaired function in depression, of mice subjected to CSDS (Fig. 1B), a validated mouse model of depression (Krishnan et al., 2007; Ferenczi et al., 2016). We found that 9 of the 18 genes selected for the epoxygenase pathway showed significant or trending altered mRNA expression in susceptible mice, whereas 3 of the 26 genes were in the phospholipase A2 (PLA2), LOX, COX, and ω-hydroxylase pathways (Fig. 1C; Fig. 1-1; G4a, F(2,9) = 0.340, p = 0.720; G4b, F(2,9) = 0.594, p = 0.572; G4c, F(2,9) = 18.453, p = 0.001; G6, F(2,9) = 1.389, p = 0.980; G2a, F(2,9) = 1.937, p = 0.200; G2b, F(2,9) = 0.034, p = 0.082; G2e, F(2,9) = 0.453, p = 0.649; G10, F(2,9) = 1.845, p = 0.213; G16, F(2,9) = 2.507, p = 0.136; 5-lox, F(2,19) = 1.298, p = 0.296; 12-lox, F(2,9) = 0.259, p = 0.778; 12b-lox, F(2,9) = 0.462, p = 0.644; 12e-lox, F(2,9) = 1.420, p = 0.291; 15-lox, F(2,9) = 0.026, p = 0.975; 15b-lox, F(2,9) = 2.490, p = 0.138; Cox1, F(2,9) = 0.658, p = 0.541; Cox2, F(2,19) = 7.807, p = 0.003; Cyp1a1, F(2,9) = 0.395, p = 0.685; Cyp2e1, F(2,9) = 0.227, p = 0.801; Cyp4a10, F(2,19) = 2.520, p = 0.107; Cyp4a12, F(2,9) = 0.571, p = 0.584; Cyp4a14, F(2,18) = 1.537, p = 0.242; Cyp4b1, F(2,9) = 8.601, p = 0.008; Cyp4f13, F(2,9) = 0.482, p = 0.633; Cyp4f14, F(2,9) = 2.407, p = 0.145; Cyp4f15, F(2,9) = 0.824, p = 0.469; Cyp2u1, F(2,9) = 1.515, p = 0.271; Cyp4x1, F(2,9) = 5.181, p = 0.032; Cyp1a2, F(2,9) = 2.569, p = 0.131; Cyp2b9, F(2,19) = 2.523, p = 0.112; Cyp2b19, F(2,19) = 5.140, p = 0.016; Cyp2c39, F(2,9) = 0.005, p = 0.995; Cyp2c40, F(2,9) = 0.020, p = 0.980; Cyp2c44, F(2,9) = 0.462, p = 0.644; Cyp2c50, F(2,19) = 14.140, p = 0.000; Cyp2c55, F(2,19) = 4.085, p = 0.034; Cyp2c65, F(2,9) = 0.072, p = 0.931; Cyp2c66, F(2,9) = 0.161, p = 0.854; Cyp2c68, F(2,19) = 1.312, p = 0.293; Cyp2c70, F(2,19) = 2.976, p = 0.075; Cyp2j5, F(2,17) = 3.976, p = 0.038; Cyp2j6, F(2,9) = 1.265, p = 0.328; Cyp2j9, F(2,9) = 2.862, p = 0.109; Ephx2, F(2,18) = 4.543, p = 0.025, one-way ANOVA), suggesting that EET signaling might be altered by the CSDS paradigm.

ARA metabolic pathways in the mouse model and patients with MDD. A, Schematic representation of the ARA metabolic pathway. PLA2 enzymes are crucial for transferring esterified ARA to free ARA for metabolism. Three members of the PLA2 superfamily have been implicated most strongly in eicosanoid production, including cytosolic calcium-dependent PLAs [group (G) 4a–c], cytosolic calcium-independent PLA2 (G6), and secreted PLA2 (G2a, b, e and G10). Adipose-specific PLA2 is G16. The free ARA can be converted to eicosanoids via three pathways: the LOX, COX, and CYP. B, Identification of susceptible and resilient mice following the CSDS paradigm. Mice were divided into different groups by the SI ratio. Cont., Control; Sus., susceptible; Res., resilient. C, mRNA levels (relative to the control, red dashed line) of gene profiles related to the ARA KEGG pathway in the mPFC of adult C57BL/6J mice after CSDS. For qPCR primers, see Figure 1-1. D, E, Western blots and quantification of LOXs, COXs, and CYPs in the BA24 of subjects with MDD and matched controls. Data are mean ± SEM. *p < 0.05, **p < 0.01, ***p < 0.001.
Figure 1-1
To assess the relevance of the EET pathway for MDD, we examined the expression levels of ARA metabolism-related enzymes in postmortem samples of the anterior cingulate cortex (BA24), an area related to emotional responses and implicated in depression. No trends were observed for the LOXs (5-LOX, 12-LOX, 15-LOX), COXs (COX1, COX2), and CYPs (CYP2C, CYP2J2, CYP4A11) (Fig. 1D,E; 5-LOX, t(12) = 1.642, p = 0.126; 12-LOX, t(12) = 0.032, p = 0.975; 15-LOX, t(10) = −1.073, p = 0.309; COX1, t(11) = −1.729, p = 0.112; COX2, t(12) = 2.098, p = 0.058; CYP2C, t(12) = 1.287, p = 0.222; CYP2J2, t(12) = 1.287, p = 0.222; CYP4A11, t(12) = 0.650, p = 0.528, unpaired t test). sEH is the key enzyme in EET signaling, and oligomerization is required for its enzymatic activity (Nelson et al., 2013). A recent study showed that deletion of Ephx2 induced stress resilience (Ren et al., 2016). Therefore, we used a protein cross-linking strategy to examine the expression of sEH in the brain. While sEH monomer levels were unchanged, the levels of oligomer sEH, the functional form of sEH, were increased in BA24 of patients with MDD compared with controls. There were no changes in sEH monomer and oligomer levels in BA47 (Fig. 2A,B; BA24 monomer, t(14) = −0.842, p = 0.414; BA24 oligomer, t(14) = −2.431, p = 0.024; BA47 monomer, t(14) = 0.728, p = 0.479; BA47 oligomer, t(14) = −0.272, p = 0.790, unpaired t test), a part of the orbitofrontal cortex that is involved in decision-making, indicating that the increased enzymatic activity of sEH in patients with MDD was brain region-specific.

Dysfunction of EET signaling in human depression and mouse CSDS. A, Western blots showing the expression of sEH monomer and oligomer in the BA24 of patients with MDD and matched controls. B, Quantification of the Western blot results in BA24 and BA47. Hollow circle represents male. Solid circle represents female. C, Western blot analyses of sEH in the mPFC and hippocampus (Hipp.) after CSDS. D, E, Quantifications of sEH monomer and oligomer in the mPFC and hippocampus after CSDS. F, Measurement of the levels of 14,15-DHET hydrolyzed by sEH in the mPFC and hippocampus after CSDS. Cont., Control; Sus., susceptible; Res., resilient. Data are mean ± SEM. *p < 0.05, **p < 0.01, ***p < 0.001.
We then considered whether the increased sEH oligomerization in response to stress is conserved between mice and humans. Consistently, after CSDS, levels of sEH oligomer were increased in the mPFC of susceptible mice but not in resilient mice, whereas sEH monomer levels appeared unchanged compared with controls (Fig. 2C,D; monomer, F(2,9) = 2.315, p = 0.174; oligomer, F(2,33) = 4.355, p = 0.174, one-way ANOVA). To directly detect whether sEH activity was altered after CSDS, we performed sEH enzymatic activity assays and found that 14,15-DHET levels hydrolyzed by sEH in the mPFC acutely isolated from susceptible mice were increased; the same was not observed in resilient mice (Fig. 2F; mPFC, F(2,22) = 10.809, p = 0.001, one-way ANOVA). We did not observe any change in sEH expression levels and enzymatic activity in the hippocampus of either susceptible or resilient animals (Fig. 2E,F; sEH protein level: monomer, F(2,21) = 2.474, p = 0.108; oligomer, F(2,42) = 0.022, p = 0.979; sEH activity: hippocampus, F(2,22) = 0.256, p = 0.776, one-way ANOVA), indicating a brain region-specific effect of EET signaling. Finally, we measured the levels of EETs in different brain regions, including the mPFC, hippocampus, nucleus accumbens, striatum, and cerebral cortex (without the PFC), of mice after CSDS using LC-MS, and we found that the levels of total EETs, especially 14,15-EET, were specifically decreased in the mPFC of susceptible (but not resilient) mice (Table 2). Together, these results strongly suggest that EET signaling in the mPFC is impaired in depression.
Brain-regional EET levels in CSDS paradigma
Enhancement of EET signaling in the mPFC produces antidepressant-like effects
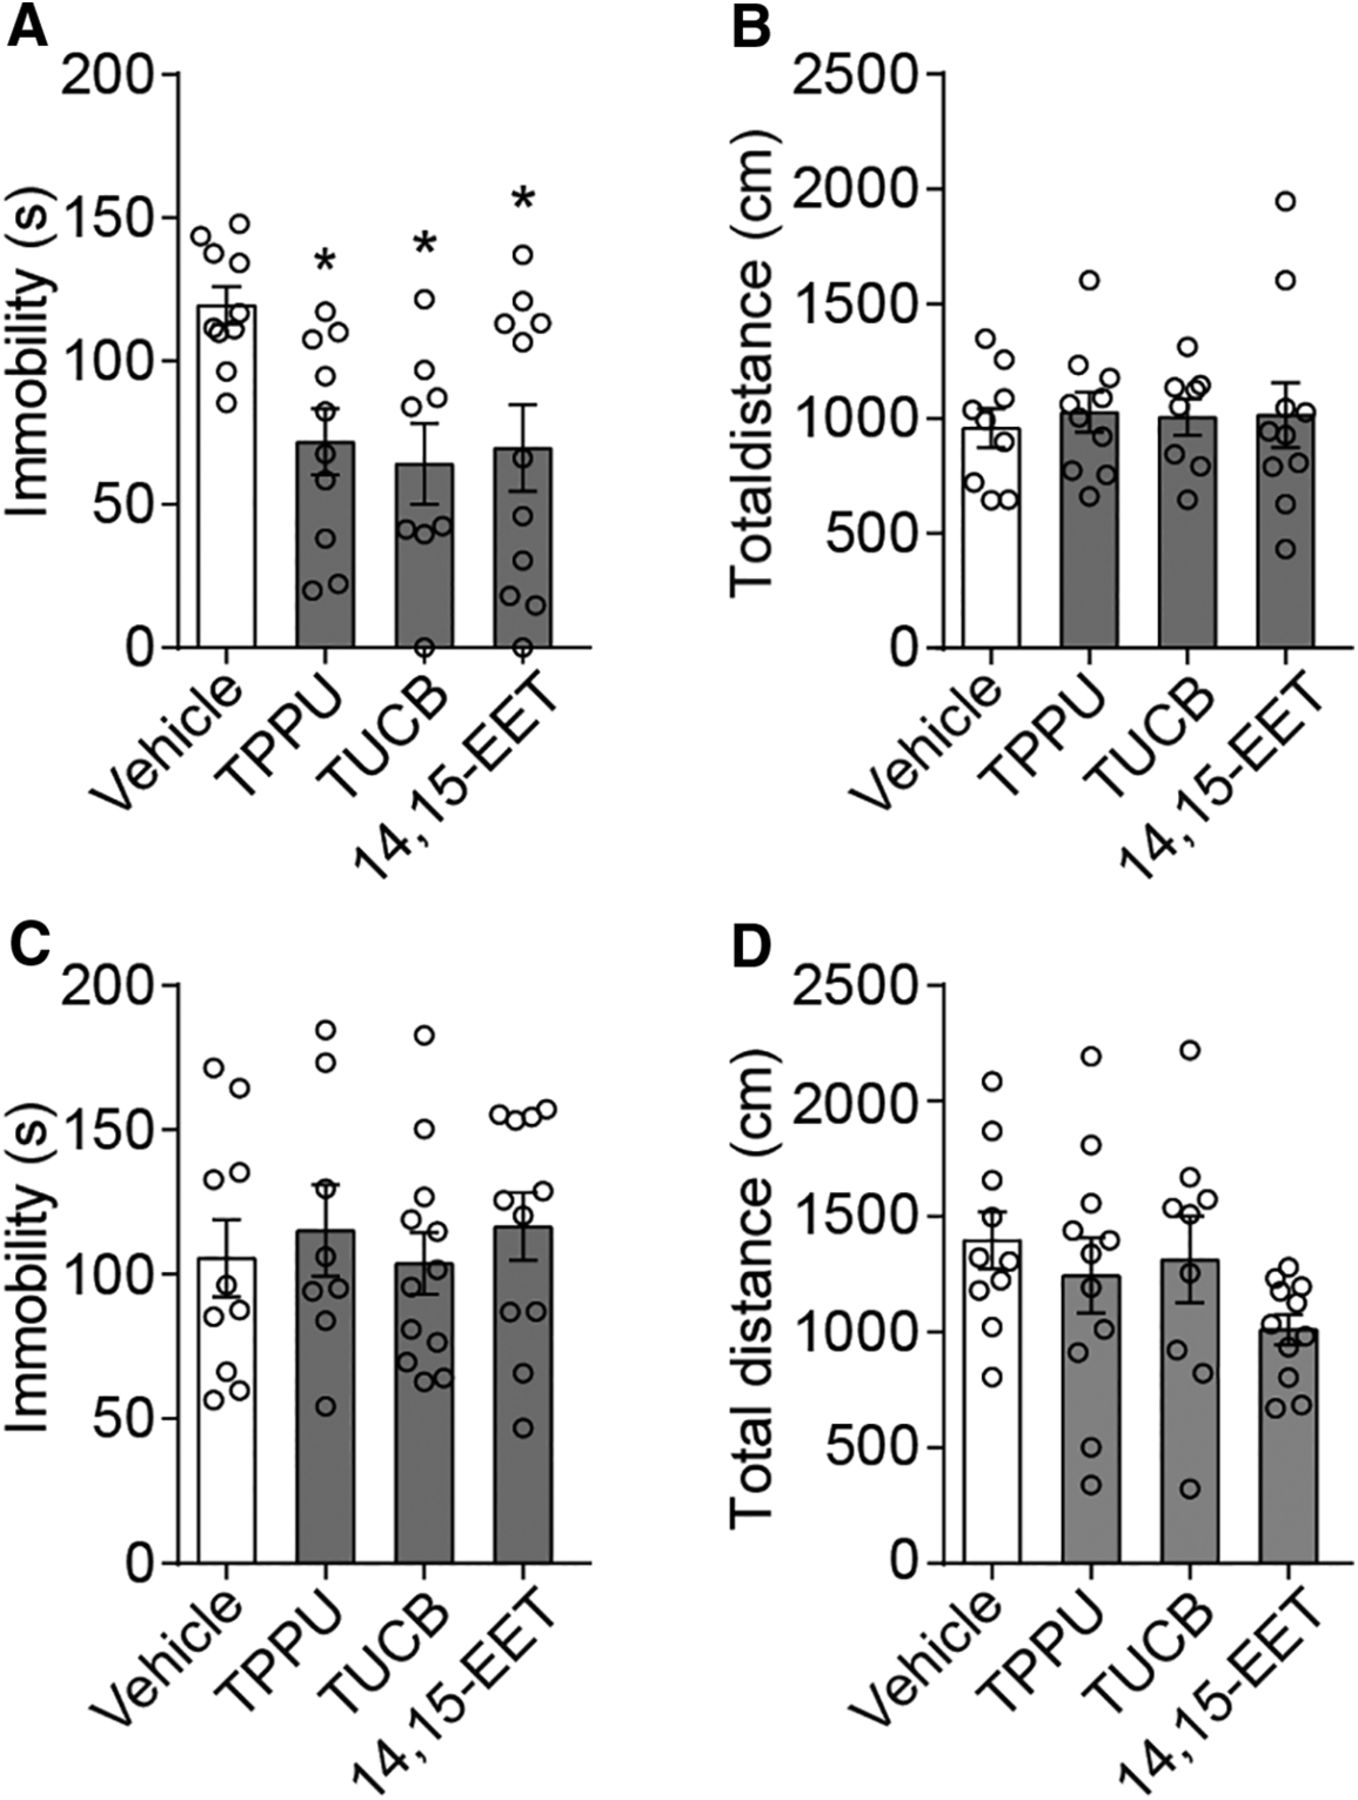
To investigate the novel role of EET signaling in the pathophysiology of depression, we first used intracerebroventricular infusion of sEHIs, TPPU and TUCB, which can increase cellular levels of EETs (Kodani and Hammock, 2015). To achieve this goal, a cannula was implanted in the right ventricle of adult C57BL/6J mice, and behavioral tests were conducted 7 d later (Fig. 3A). Both TPPU and TUCB, at optimal concentrations, decreased the duration of immobility in the FST, without affecting locomotion, compared with the controls (Fig. 3B,C; FST, F(6,56) = 3.795, p = 0.003; open field test, F(6,50) = 1.008, p = 0.431, one-way ANOVA). We then directly infused EETs and found that infusion of 14,15-EET, but not 5,6-EET, 8,9-EET, or 11,12-EET, produced an antidepressant-like effect (Fig. 3D–G; 14,15-EET: FST, F(4,53) = 3.184, p = 0.020; open field test, F(4,50) = 0.638, p = 0.638; other EETs: FST, F(3,36) = 0.434, p = 0.730; open field test, F(3,36) = 0.708, p = 0.553, one-way ANOVA). These results were verified by a parallel experiment in the CSDS: while vehicle-treated mice spent 50% less time in the interaction zone when a caged aggressor was introduced relative to the control group, intracerebroventricular application of TPPU for 7 d completely reversed this depressive-like phenotype (Fig. 3H; interaction, F(1,32) = 3.537, p = 0.069; treatments, F(1,32) = 4.661, p = 0.039; stress, F(1,32) = 3.872, p = 0.058, two-way ANOVA). The mPFC and hippocampus are two major important brain structures that are well known to be involved in depressive disorder (Cao et al., 2013). Therefore, to investigate the brain region-specific effect of EET signaling, we directly implanted a cannula into the mPFC or hippocampus, and behavioral tests were conducted 7 d later. The mPFC infusion of sEHIs or 14,15-EET decreased the duration of immobility in the FST compared with the controls (Fig. 4A; F(3,35) = 4.345, p = 0.011, one-way ANOVA). No difference was found after hippocampal infusion, and none of the manipulations had an effect on locomotion (Fig. 4B–D; mPFC: open field test, F(3,33) = 0.083, p = 0.969; hippocampus: FST, F(3,37) = 0.273, p = 0.845; open field test, F(3,37) = 1.481, p = 0.236, one-way ANOVA). Together, these results indicate that enhancement of EET signaling in the mPFC produces an antidepressant-like effect in adult mice.

Antidepressant-like effects are induced by enhancement of EET signaling. A, Schematic representation of the experimental design for intracerebroventricular injections. B, Immobility of adult C57BL/6J mice injected with different dosages of TPPU, TUCB, or vehicle in the FST. C, No effect on spontaneous locomotor activity was observed following an intracerebroventricular infusion of different dosages of TPPU, TUCB, or vehicle. D, Immobility of adult C57BL/6J mice injected with different dosages of 14,15-EET in the FST. E, Infusions of 14,15-EET had no effect on locomotion. F, G, The intracerebroventricular infusions of 5,6-, 8,9-, or 11,12-EET did not produce antidepressant-like effects in the FST. H, Schematic paradigm and the antidepressant-like effect of TPPU (intracerebroventricular) in the CSDS model. Data are mean ± SEM. *p < 0.05, ***p < 0.001. N.S., not significant.
Enhancement of EET signaling in the mPFC produces antidepressant-like effects. A, Effect of mPFC infusion of TPPU (1 μm), TUCB (0.1 μm), 14,15-EET (1 μg), or vehicle on immobility in the FST. B, mPFC infusions of TPPU (1 μm), TUCB (0.1 μm), or 14,15-EET (1 μg) did not affect locomotor activity compared with the controls. C, D, Hippocampal infusions of TPPU (1 μm), TUCB (0.1 μm), or 14,15-EET (1 μg) could not induce antidepressant-like effects in the FST. Data are mean ± SEM. *p < 0.05.
Deletion of Ephx2 in adult astrocytes induces resilience to stress
To investigate the distribution of sEH, we first immunolabeled brain sections from Fgfr3-tdTomato mice using antibodies raised against sEH (Fig. 5A) and GFAP, an astrocyte-specific marker. We observed a marked colocalization of sEH and GFAP in the mPFC (Fig. 5B), indicating that sEH was mainly expressed in astrocytes, consistent with previous studies (Marowsky et al., 2009; Zhang et al., 2014). Fibroblast growth factor receptor 3 (Fgfr3) is also a marker for astrocytes (Young et al., 2010; Zhang et al., 2014); and consistently, we found that, in the mPFC, most Fgfr3-tdTomato-positive cells were costained with GFAP and sEH (Fig. 5C). Therefore, to detect whether deletion of Ephx2 in astrocytes indeed produces antidepressant-like effects, we crossed mice with the Ephx2 allele in which loxp sites flank exon 2 (Fig. 6A,B) with Fgfr3-iCreERT2 mice to generate a new double-transgenic mouse model, Fgfr3-Ephx2−/− mice, in which Ephx2 was selectively deleted in astrocytes via TAM-inducible Cre recombination driven by the Fgfr3 promoter (Young et al., 2010). To examine the efficiency and specificity of Ephx2 deletion in astrocytes, brain tissues were collected from adult mice and studied 30 d after the first TAM injection. Immunostaining showed that sEH was absent from the majority of GFAP-positive cells in the mPFC of Fgfr3-Ephx2−/− mice (Fig. 6C). Western blot analysis indicated that sEH levels were dramatically reduced in all brain regions that were examined, including the PFC, hippocampus, cerebral cortex (without the PFC), and striatum of Fgfr3-Ephx2−/− mice, compared with the control littermates (Fgfr3-Ephx2+/+ mice). No significant difference was found in the levels of GFAP or NeuN (Fig. 6D,E; PFC-sEH, t(6) = 13.560, p = 0.000; PFC-GFAP, t(6) = 1.488, p = 0.187; PFC-NeuN, t(6) = 0.579, p = 0.583; hippocampus-sEH, t(6) = 13.396, p = 0.000; hippocampus-GFAP, t(6) = 1.477, p = 0.190; hippocampus-NeuN, t(6) = −0.694, p = 0.514; cerebral cortex-sEH, t(6) = 6.836, p = 0.000; cerebral cortex-GFAP, t(6) = 0.874, p = 0.416; cerebral cortex-NeuN, t(6) = 1.206, p = 0.273; striatum-sEH, t(6) = 24.687, p = 0.000; striatum-GFAP, t(6) = 0.655, p = 0.537; striatum-NeuN, t(6) = 2.444, p = 0.050, unpaired t test). These data demonstrated a specific loss of sEH in astrocytes at the adult stage. Additionally, Fgfr3-Ephx2−/− mice grew well, to normal size, and deletion of Ephx2 did not lead to gross anatomical changes of the brain or the densities of astrocytes and neurons (Fig. 6F–I).

sEH is mainly expressed in astrocytes in the mPFC. A, Western blot analysis of sEH in the brain of Ephx2−/− and control littermates. B, Brain slices (40 μm) were prepared from adult Fgfr3-tdTomato mice and stained with anti-sEH (green) and anti-GFAP (magenta). Scale bar, 20 μm. C, The statistical analysis indicates that >80% of tdTomato-positive cells in the mPFC colocalized with GFAP and most GFAP-positive cells were tdTomato-positive cells in the mPFC.

Generation of Fgfr3-Ephx2−/− mice. A, Schematic diagram of Ephx2loxp/loxp allele generation: the conditional Ephx2 allele has loxp sites flanking exon 2 and generates an out-of-frame mutation after Cre-mediated recombination. B, PCR genotyping of Ephx2loxp/loxp mice. C, Representative confocal images showing coexpression of sEH (green) in GFAP-positive astrocytes (red) in the mPFC of adult Fgfr3-Ephx2−/− mice and littermate controls. Scale bar, 20 μm. D, E, Western blot analysis of the levels of sEH, GFAP, and NeuN in the PFC, hippocampus (Hipp.), cerebral cortex (Cort.), and striatum of adult Fgfr3-Ephx2−/− mice and littermate controls. The levels of sEH were decreased in the PFC, hippocampus, cerebral cortex, and striatum by 66%, 58%, 57%, and 72%, respectively. F, Representative images of adult Fgfr3-Ephx2−/− and littermate control animals. G, Gross appearance of the brain of Fgfr3-Ephx2−/− and littermate control mice. H, H&E-stained coronal sections around the PFC (top) and hippocampus (bottom) of the brains of Fgfr3-Ephx2−/− and littermate control mice. Scale bar, 500 μm. I, Immunofluorescence for GFAP (green) in the hippocampus and NeuN (green) in the mPFC of Fgfr3-Ephx2−/− and littermate control mice. Scale bar, 20 μm. **p < 0.01, ***p < 0.001.
Next, we investigated the behavioral response following specific deletion of Ephx2 in adult astrocytes. Fgfr3-Ephx2−/− mice showed an antidepressant-like phenotype (Fig. 7A; t(24) = 2.949, p = 0.007, unpaired t test), with shorter durations of immobility in the FST and less social avoidance after CSDS (Fig. 7C; interaction, F(1,67) = 2.086, p = 0.153; genotype, F(1,67) = 13.250, p = 0.001; stress, F(1,67) = 6.313, p = 0.014, two-way ANOVA) compared with the littermate control animals. However, no behavioral differences were observed between Fgfr3-Ephx2−/− mice and control littermates in the open field test (Fig. 7B; t(22) = 1.148, p = 0.263, unpaired t test), the elevated plus maze test (Fig. 7D–G; total distance, t(25) = 1.806, p = 0.083; percentage distance in open arms, t(25) = 0.623, p = 0.539; percentage time in open arms, t(25) = 0.884, p = 0.385; entries into open arms, t(25) = 0.876, p = 0.389, unpaired t test), and the light-dark box test (Fig. 7H,I; duration in dark, t(18) = 0.546, p = 0.592; number of entries, t(18) = 1.283, p = 0.216, unpaired t test), suggesting that deletion of Ephx2 in adult astrocytes has little effect on locomotion and anxiety.

Deletion of Ephx2 in adult astrocytes induces resilience to stress. A, Antidepressant-like effect of Ephx2 deletion in adult astrocytes in the FST. B, Fgfr3-Ephx2−/− and littermate control mice were detected in the open field test. C, Fgfr3-Ephx2−/− mice were less susceptible to social defeat stress. D–G, Behavioral responses of Fgfr3-Ephx2−/− mice and littermate controls in the elevated plus maze test. H, I, Animals were examined in the light-dark box test. Data are mean ± SEM. *p < 0.05, **p < 0.01.
We then detected the effect of knocking down Ephx2 in astrocytes in the mPFC, using a lentivirus approach, which infects mostly astrocytes in adult brain (An et al., 2016). To test the efficiency of pLenti-Ephx2-shRNAs silencing Ephx2 in vivo, we bilaterally injected viral particles into the mPFC of adult Fgfr3-tdTomato mice and killed the animals 14 d later (Fig. 8A). Confocal images showed that a majority (84.9 ± 4.0%) of EGFP-positive cells were colabeled with astrocytes (Fig. 8B). Western blot analysis indicated that the protein levels of sEH were downregulated by pLenti-Ephx2-shRNAs infusion into the mPFC (Fig. 8C; F(2,9) = 22.945, p = 0.000, one-way ANOVA). Behavioral analyses showed that, 14 d after the viral injection, mice that received a bilateral mPFC infusion of pLenti-Ephx2-shRNAs exhibited antidepressant-like behaviors in the FST (Fig. 8D,E; FST, F(2,27) = 3.746, p = 0.037; open field test, F(2,27) = 2.373, p = 0.1, one-way ANOVA). These results suggest that EET signaling in astrocytes in the mPFC is essential to behavioral adaptation in response to stress.

Enhancement of EET signaling in adult astrocytes in the mPFC produces antidepressant-like effects. A, Experimental timeline (left) and bilateral injection sites in the mPFC (middle) with an image of EGFP expression 2 weeks after injection (right). Scale bar, 0.5 mm. B, Confocal images of the mPFC of adult Fgfr3-tdTomato mice 14 d after viral injection. Green represents pLenti-EGFP. Red represents tdTomato. Blue represents DAPI. Scale bar, 20 μm. C, Levels of sEH in the mPFC of adult C57BL/6J mice injected with pLenti-shRNAs. D, Immobility of adult C57BL/6J mice injected with pLenti-Ephx2-shRNAs or control shRNA. E, Spontaneous locomotor activity of mice with bilateral mPFC infusions of pLenti-shRNAs. Data are mean ± SEM. *p < 0.05, ***p < 0.001.
Impaired EET signaling in the mPFC induces a depressive phenotype
To further establish the critical role of EET signaling in depression, we sought to determine whether impaired EET signaling induces a depressive phenotype. To achieve this goal, we first infused 14,15-EEZE into the mPFC and found that the maximal increasing effect on immobility in the FST was achieved at 25 ng/μl (Fig. 9A; F(3,37) = 3.426, p = 0.027, one-way ANOVA). This manipulation had no effect on locomotion (Fig. 9B; F(3,37) = 1.091, p = 0.365, one-way ANOVA), indicating that the blockage of endogenous EET induced depressive-like behaviors. Then, we bilaterally microinjected pLenti-EGFP, pLenti-hEPHX2, or pLenti-Lys55Arg virus into the mPFC of adult C57BL/6J mice. To validate the efficiency of hEPHX2 overexpression in vivo, the mice were killed 14 d after viral infection, and the mPFC was isolated for Western blot analysis. Both pLenti-hEPHX2 and pLenti-Lys55Arg injections induced increases in sEH monomer and oligomer levels (Fig. 9C,D; monomer, F(2,6) = 6.136, p = 0.035; oligomer, F(2,15) = 4.823, p = 0.025, one-way ANOVA). Behavioral analysis showed that overexpression of hEPHX2 or Lys55Arg increased the duration of immobility in the FST at 14 d after viral injection, without affecting locomotion, compared with the mice injected with pLenti-EGFP (control mice) (Fig. 9E,F; FST, F(2,30) = 4.200, p = 0.025; open field test, F(2,27) = 2.123, p = 0.139, one-way ANOVA). In parallel experiments, we used a subthreshold defeat procedure. While mice injected with pLenti-EGFP showed no behavioral deficits after a 2 d defeat phase, overexpression of hEPHX2 induced greater social avoidance (Fig. 9G; F = 4.799, p = 0.038, repeated measures).

Impaired EET signaling in the mPFC induces a depressive-like phenotype. A, mPFC infusion of 14,15-EEZE increased the duration of immobility in the FST at the optimal concentrations. B, mPFC infusions of 14,15-EEZE had no effect on locomotion. C, D, Western blots and quantification of sEH monomer and oligomer in the mPFC of mice injected with pLenti-EGFP (control), pLenti-hEPHX2 (hEPHX2), or pLenti-Lys55Arg (Lys55Arg). E, F, Immobility of adult C57BL/6J mice injected with pLenti-hEPHX2, pLenti-Lys55Arg, or control virus in the FST. G, Schematic of the overexpression of hEPHX2 or control EGFP followed by subthreshold defeat (top), and behavioral analyses were conducted before (Pre-defeat) and after (Post-defeat) subthreshold defeat (bottom). H, Schematic of TAM-induced Ephx2 deletion in astrocytes, followed by overexpression of hEPHX2 or control EGFP in the mPFC in the FST. I, J, Immobility time (I) and total distance (J) of Fgfr3-Ephx2−/− mice and littermate controls injected with pLenti-hEPHX2 or control virus. K, Schematic of Ephx2 deletion followed by hEPHX2 overexpression in the mPFC in the CSDS paradigm (top), and social interaction measured before and after CSDS (bottom). Data are mean ± SEM. *p < 0.05, **p < 0.01, ***p < 0.001.
To further assess whether the enhancement of EET signaling in mPFC astrocytes is essential for the antidepressant-like effect, we bilaterally microinjected pLenti-EGFP or pLenti-hEPHX2 virus into the mPFC of Fgfr3-Ephx2−/− mice and littermate controls. In Fgfr3-Ephx2+/+ mice, pLenti-hEPHX2 injection increased immobility in the FST after 14 d, consistent with the results observed in adult C57BL/6J mice (Fig. 9H). Interestingly, in Fgfr3-Ephx2−/− mice, the decrease in immobility was reversed by overexpression of hEPHX2 (Fig. 9I,J; FST, F(3,57) = 12.058, p = 0.000; open field test, F(3,57) = 3.391, p = 0.024; one-way ANOVA). Moreover, in the 10 d CSDS paradigm, whereas control mice showed no behavioral deficits, the pLenti-hEPHX2-injected animals developed social avoidance behavior (Fig. 9K; F = 4.733, p = 0.040, repeated measures). Together, these results indicate that dysfunction of EET signaling in the mPFC is sufficient to evoke a depressive-like phenotype in response to stress.
sEH is located on lysosomes in astrocytes
To explore the mechanism underlying EET signaling modulating depressive-like behaviors, we attempted to investigate the subcellular location of sEH. We found that nearly half of these sEH-immunofluorescent (IF) puncta were also IF for LAMP1, a lysosome-specific protein, and colabeled with the lysosomal tracer LysoTracker. In contrast, few sEH puncta colocalized with the mitochondrial tracer MitoTracker or with the Golgi complex marker GM130 (Fig. 10A). SIM imaging revealed that ∼44% of LAMP1 IF puncta expressed sEH (Fig. 10B). Using transmission electron microscopy (TEM) and immuno-TEM, we found that sEH was localized on LAMP1-immunoreactive vesicles, but not on mitochondria (Fig. 10C). Finally, SIM imaging of triple-immunostained brain sections revealed that sEH colocalized with LAMP1-positive puncta in astrocytes in the mPFC (Fig. 10D). Together, these results support the notion that sEH is present on astrocytic lysosomes.

sEH is mainly located on lysosomes in astrocytes. A, Confocal images of astrocytes showing sEH (green) colabeling with different organelle markers (red). Scale bar, 10 μm. PCC, Pearson's correlation coefficient. B, SIM images showing coexpression of sEH (green) and LAMP1 (red) in cultured astrocytes. Scale bar, 0.5 μm. C, Immuno-TEM image showing coexpression of sEH (5 nm gold, feint arrows) and LAMP1 (10 nm gold, solid arrows) in cultured astrocytes. Scale bar, 0.5 μm. Lyso., Lysosome; Mito., mitochondria. D, Triple-IF staining of brain slices of adult C57BL/6J mice. SIM images showing coexpression of sEH (red) and LAMP1 (green) in astrocytes (white) in the mPFC. Scale bars: Top right, 0.5 μm; Bottom, 5 μm.
Astrocytic ATP release mediates the antidepressant-like effects of EET signaling
Lysosomes in astrocytes contain abundant ATP (Zhang et al., 2007), and our previous data have shown that the astrocytic ATP release plays a vital role in depression (Cao et al., 2013). Therefore, we investigated whether EET signaling regulates ATP release from astrocytes. Both TPPU and TUCB applications dose-dependently increased ATP accumulation in the medium collected from cultured astrocytes 5 min after the treatment (Fig. 11A; TPPU, F(5,102) = 9.575, p = 0.000; TUCB, F(5,102) = 45.660, p = 0.000, one-way ANOVA). In parallel, cultured astrocytes were treated directly with EETs. As shown in Figure 11B, the maximal effect of 14,15-EET on increasing ATP release was achieved at 2 μm (Fig. 11B; F(7,104) = 17.562, p = 0.000, one-way ANOVA). Higher doses of 14,15-EET had no obvious effect on astrocytic ATP release, possibly due to off-target effects in vitro (Morisseau and Hammock, 2013). No effect was found after treatment with 5,6-EET, 8,9-EET, or 11,12-EET (Fig. 11C; F(6,118) = 2.586, p = 0.022, one-way ANOVA). Moreover, the effects of sEHIs and 14,15-EET were attenuated by pretreatment with 14,15-epoxyeicosa-5(Z)-enoic acid (14,15-EEZE), a selective EET antagonist (Gross et al., 2008) (Fig. 11D; F(7,100) = 20.588, p = 0.000, one-way ANOVA). Next, we modulated sEH activity using lentivirus approaches. Knocking down Ephx2 with lentivirus-encoded (pLenti-) Ephx2-shRNAs increased ATP levels in the medium of cultured astrocytes (Fig. 11E,F; F(2,51) = 19.487, p = 0.000, one-way ANOVA). In contrast, overexpression of human EPHX2 (hEPHX2) or Lys55Arg, a human variant of sEH with increased enzymatic activity (Koerner et al., 2007) that increases levels of sEH oligomer, reduced ATP accumulation in the medium of cultured astrocytes (Fig. 11G,H; sEH oligomer, F(2,6) = 5.029, p = 0.052; ATP, F(2,42) = 15.934, p = 0.000, one-way ANOVA).

EET signaling modulates astrocytic ATP release. A, ATP measurements showing ATP levels in the medium of cultured astrocytes 5 min after treatment with different dosages of TPPU and TUCB. B, ATP levels in the medium of cultured astrocytes after 14,15-EET treatments. C, Five-minute treatments with 5,6-, 8,9-, and 11,12-EET (1 μm) had no effect on ATP release from cultured astrocytes. D, Effects of 14,15-EET (1 μm), TPPU (100 μm), and TUCB (50 μm) on astrocytic ATP release were attenuated by pretreatment with 14,15-EEZE. E, Schematic of the lentiviral vector encoding shRNA (top) and an image of EGFP expression (bottom left; scale bar, 10 μm) with Western blot analysis of sEH expression in cultured astrocytes (bottom right). LTR, Lentiviral long terminal repeat; U6, U6 promoter; UbC, ubiquitin C promoter; WPRE, woodchuck hepatitis post-transcriptional regulatory element. F, ATP levels in the medium of cultured astrocytes transfected with pLenti-shRNAs. G, Schematic of the lentiviral vector encoding hEPHX2 (top). Western blot and quantification showing levels of sEH oligomer in cultured astrocytes after overexpression of hEPHX2 and Lys55Arg. H, Amount of ATP in the medium of cultured astrocytes overexpressing pLenti-EGFP, hEPHX2, or Lys55Arg 72 h after transfection. I, ATP levels in the ACSF medium incubated with slices of the PFC or hippocampus (Hipp.) isolated from adult Ephx2−/− mice and littermate controls. J, ATP levels in the medium of cultured astrocytes or neurons isolated from neonatal Ephx2−/− mice and control animals. K, In vivo microdialysis assay showing ATP levels in the interstitial fluid (ISF) in the mPFC of adult Fgfr3-Ephx2−/− and control animals. All in vitro studies were repeated two or three times. Data are mean ± SEM. *p < 0.05, **p < 0.01, ***p < 0.001.
Next, we used Ephx2−/− mice to detect whether the deletion of Ephx2 can promote astrocytic ATP release ex vivo and found that the concentration of ATP was higher in the ACSF incubated with the PFC slices derived from Ephx2−/− mice, compared with the ACSF used for slices from littermate controls. No difference between the mice was found for the ACSF incubated with hippocampal slices (Fig. 11I; PFC, t(28) = −6.626, p = 0.000; hippocampus, t(28) = −0.401, p = 0.692, unpaired t test). In addition, ATP accumulation was markedly increased in the medium of cultured astrocytes isolated from the brain of adult Ephx2−/− mice, whereas deletion of Ephx2 had no effect on neuronal ATP release (Fig. 11J; astrocytes, t(8) = −14.961, p = 0.000; neurons, t(28) = 1.887, p = 0.070, unpaired t test). Notably, in in vivo microdialysis experiments, we found that ATP accumulation in the interstitial fluid was higher in the mPFC of Fgfr3-Ephx2−/− mice than control littermates (Fig. 11K; t(7) = −4.705, p = 0.002, paired t test). These data indicated that EET signaling in astrocytes regulates ATP release.
The purinergic receptor P2X2 in the mPFC mediates the antidepressant-like effect of astrocyte-derived ATP (Cao et al., 2013). Therefore, to determine whether increased astrocytic ATP mediates the effect of Ephx2 deletion in adult astrocytes, we infused PPADS, an antagonist of P2X receptors, into the mPFC of Fgfr3-Ephx2−/− mice and littermate controls, and we found that PPADS infusion attenuated the antidepressant-like effect induced by the Ephx2 deletion in adult astrocytes in the FST. Infusion of CPT, an antagonist of adenosine A1 receptors, had no such effect (Fig. 12A; F(5,60) = 3.332, p = 0.010, one-way ANOVA), indicating the potential involvement of P2X2 receptors. We then bilaterally infused AAV-P2rx2-shRNA, which infects most neurons and knocks down the protein level of P2X2 receptors (Cao et al., 2013), or control virus, into the mPFC of Fgfr3-Ephx2−/− mice and littermate controls. While injection of AAV-P2rx2-shRNA could not induce depressive-like behaviors in the FST, it attenuated the antidepressant-like effect induced by the deletion of Ephx2 in adult astrocytes (Fig. 12C,D; F(3,35) = 5.332, p = 0.004, one-way ANOVA). None of these manipulations had any effect on locomotion (Fig. 12B,E; PPADS/CPT, F(5,60) = 0.690, p = 0.633; AAV-P2rx2-shRNA, F(3,35) = 0.917, p = 0.443, one-way ANOVA). Together, these results provide compelling evidence for the notion that deletion of Ephx2 in adult astrocytes promotes ATP release and thus induces an antidepressant-like phenotype.

P2X2 receptors in the mPFC mediate the antidepressant-like effect induced by Ephx2 deletion in adult astrocytes. A, Effects of mPFC infusions of PPADS or CPT on the antidepressant phenotype observed in Fgfr3-Ephx2−/− mice. B, mPFC infusions of PPADS or CPT had no effect on locomotion. C, Top, Experimental time schedule. Bottom, Bilateral injection sites in the mPFC with an image of EGFP expression. Scale bars: Left, 1 mm; Right, 100 μm. D, Effects of mPFC microinjection with AAV-P2rx2-shRNA on the antidepressant phenotype observed in Fgfr3-Ephx2−/− mice. E, mPFC microinjection with AAV-P2rx2-shRNA had no effect on locomotion. Data are mean ± SEM. *p < 0.05, **p < 0.01.
sEHIs produce rapid antidepressant-like effects
Finally, we examined whether sEHIs produce antidepressant-like effects through intraperitoneal injection because classic antidepressants are generally administered to animal models of depression through intraperitoneal injection. We found that sEHIs (1 mg/kg) decreased immobility in the FST in adult C57BL/6J mice without affecting locomotion (Fig. 13A,B; FST, F(2,37) = 4.315, p = 0.021; open field test, F(2,32) = 1.686, p = 0.201, one-way ANOVA). To determine whether sEHI treatments produce a rapid antidepressant-like effect, we used CSDS and CMS paradigms, and IMI was used as a positive control. In the CSDS paradigm, although a 7 d treatment was needed for TUCB to rescue social avoidance, a 3 d treatment of TPPU was sufficient to prevent the development of social avoidance in adult mice. No effect was observed after a 3 or 7 d treatment with IMI (Fig. 13C,D; 3 d treatment, F(7,64) = 3.819, p = 0.002; 7 d treatment, F(7,58) = 3.310, p = 0.005, one-way ANOVA). In the CMS, TPPU could rapidly reverse the decrease in sucrose preference and the coat deterioration induced by CMS without affecting the body weight of the mice (Fig. 13E, left; F = 3.969, p = 0.001; middle, F = 40.912, p = 0.000; right, F = 1.858, p = 0.086, repeated measures).

sEHIs produce rapid antidepressant-like effects. A, The effects of TPPU, TUCB, and vehicle in the FST when mice were examined 1 h after the injection (i.p.). B, Treatments with sEHIs had no effect on locomotion. C, D, CSDS paradigm. Avoidance behaviors of the mice after 3 or 7 d treatment with vehicle, IMI, TPPU, or TUCB (i.p.). E, CMS paradigm. Measurements of sucrose preference (left), the physical state of the coat (middle) and body weight (right), showing baseline followed by poststress measurements conducted each week for the mice treated with vehicle, TPPU, TUCB, or IMI (i.p.). Data are mean ± SEM. *p < 0.05, **p < 0.01, ***p < 0.001. N.S., not significant.
Discussion
The major outcomes of this study are as follows. First, we found that the oligomerization of sEH, that is, the activation level of sEH, was specifically altered in a brain region-specific manner, with increases in the anterior cingulate cortex of individuals affected by MDD. Second, pharmacological or genetic enhancement of EET signaling in astrocytes promoted ATP release and produced antidepressant-like effects in adult mice. In contrast, impaired EET signaling in the mPFC induced a depressive-like phenotype, indicating that EET signaling, not just sEH itself, in the mPFC is critical for the expression of depressive-like behaviors in rodents. Third, EET signaling modulates ATP release from astrocytes, which is essential for the expression of depressive-like behaviors. Fourth, sEHIs produce rapid antidepressant-like effects in multiple animal models of depression.
Mounting evidence has identified the PFC as an affected region in the pathophysiology of depression (Price and Drevets, 2010). While several studies have reported a decrease in cerebral blood flow and synapse loss in the PFC of patients with MDD (Salvadore et al., 2011; Kang et al., 2012), stably elevating PFC excitability has been found to be sufficient to induce anhedonia, a core symptom of depression (Ferenczi et al., 2016). The PFC is essential for behavioral adaptation in response to stress (Popoli et al., 2011). Based on previous studies and the data we collected in the present study, we propose that EET signaling in astrocytes in the mPFC could play a vital role in behavioral adaptation in response to stress (Fig. 14). Glutamatergic neurotransmission occurs predominately within the confines of a tripartite synapse, including astrocyte processes, presynaptic axon terminals, and postsynaptic elements (Popoli et al., 2011). Although the mechanisms underlying neuroglial signaling are not well established, it is known that astrocytes can sense glutamatergic transmission (Sun et al., 2013). Acute exposure to stress rapidly increases extracellular glutamate, which stimulates ATP release from astrocytic processes. This extracellular ATP is quickly degraded by ectonucleotidase into adenosine, which in turn activates presynaptic A1 or P2Y receptors to inhibit neuronal activity (Chung et al., 2015). This feedback regulation might allow a behavioral adaptation that enables a proper response to changes in the environment. This hypothesis is further supported by results indicating that acute stress transiently enhances glutamate release before ATP release (Iwata et al., 2016) and by data showing that A1 receptors mediate the antidepressant-like effect of sleep deprivation (Hines et al., 2013). Of course, other mechanisms are involved in behavioral homeostatic adaptation, including ATP-P2X2 receptor signaling, which requires further characterization. However, chronic psychiatric stress has been shown to induce a higher level of sEH oligomerization, which disrupts EET signaling and thus decreases ATP release from astrocytes in response to stress, ultimately resulting in elevated mPFC excitability, which could induce anhedonia in depression (Ferenczi et al., 2016).

EET signaling in astrocytes in the mPFC is essential for behavioral adaptation. Left, Behavioral adaptation (for details, see Discussion). Right, Chronic stress increased the activity of sEH and, thus, disrupted EET signaling in astrocytes, which induced a deficiency of astrocytic ATP release and induced depressive-like behaviors.
In addition, we found that mRNA levels of Ephx2 were inversely correlated with those of sEH oligomer in susceptible mice, indicating a tightly regulated relationship between the oligomerization of sEH and its mRNA levels. Future experiments aimed at clarifying the mechanisms underlying the modulation of astrocytic lysosomal exocytosis-dependent ATP release by EET signaling and the formation of sEH oligomer, especially in response to psychological stress, will be of significant importance for our understanding of the neurobiological underpinnings of MDD.
Footnotes
This work was supported by the National Natural Science Foundation of China 81325008 and 91432112 to X.Z. and 81501169 to X.C., Natural Science Foundation of Guangdong Province 2016A030308005 to X.Z. and 2014A030306007 to X.C., Guangzhou Science and Technology Plan Project 201804020061 to X.Z., Program for Changjiang Scholars and Innovative Research Team in University IRT_16R37 to X.Z., Science and Technology Program of Guangdong Province 2018B030334001 to X.Z., and National Program for Support of Top-notch Young Professionals C1070028 to X.C. We thank William D Richardson (University College London) for providing Fgfr3-iCreERT2 mice; Bruce D. Hammock (University of California, Davis) for providing polyclone antibodies and inhibitors of sEH; Long Miao (Institute of Biophysics, Chinese Academy of Sciences) for the technical support of immuno-TEM; and Yingying Fang, Shuji Li, Xiaowen Li (Southern Medical University), Pu Wang (Nikon China), John J. Kim, and Maria Antonietta Davoli (McGill University) for technical support.
The authors declare no competing financial interests.
- Correspondence should be addressed to Xinhong Zhu at zhuxh{at}smu.edu.cn


