

Article Figures & Data
Figures
- Fig. 1.
A, Experimental setup used to characterize left/right and rostrocaudal coordination patterns. Ventral root recordings were made from the right (R) and left (L) side both at the L2 and L5 level. B, Determination of the relative modulation amplitude. Ten ventral root cycles were full-wave-rectified and smoothed with low-pass filtering (time constant 200 msec), and the relative modulation amplitude was obtained from the mean peak (designated by B) and mean trough amplitudes (designated by A). C, Schematic showing how the phase values (Φ) were calculated from the period (P) and the latency (L). Records from right and left L2 ventral roots were full-wave-rectified and smoothed with low-pass filtering, and the right ventral root served as the reference recording. D, Circular phase-diagram in which four phase values have been plotted. The mean phase value(Φ̄) is indicated. r indicates the concentration of phase values around the mean. r ranges from 0 to 1 and can be represented graphically by the length of the vector (see Materials and Methods). E, Onset of rhythmic activity induced with a combination of 7.5 μm 5-HT and 7.5 μm NMDA in an intact Th12–L6 preparation. Note the faster time scale in the last part of the recording. Bursting was preceded by a steadily increasing tonic discharge in R-L2, R-L5, and L-L5, whereas L-L2 had an abrupt onset of rhythmicity. Bursts showed left/right alternation between corresponding roots on each side of the cord, and bursts in L2 alternated with bursts in the ipsilateral L5. This coordination pattern characterizes fast regular bursting induced by 5-HT and NMDA.
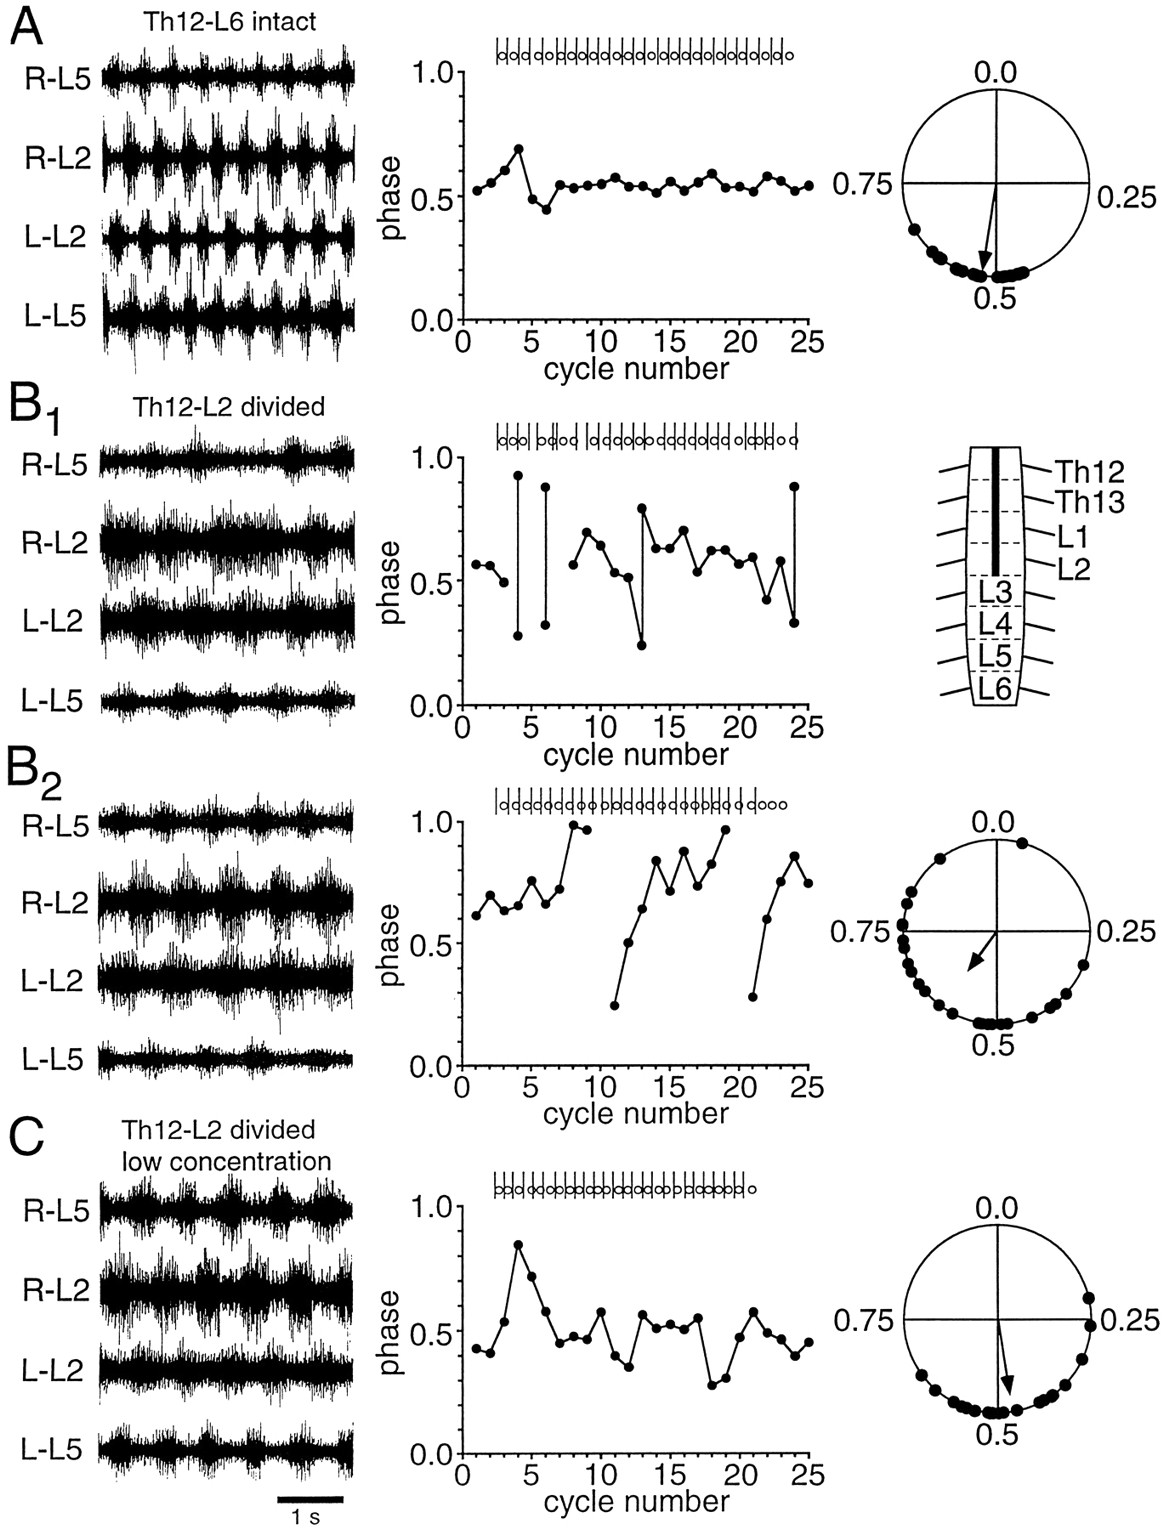
- Fig. 4.
Left/right coupling mediated through the Th12–L2 segments. A1, Rhythmic activity in an intact Th12–L6 preparation. A2, Linear plot (top) of the phase values of 25 consecutive L-L2 onsets calculated with respect to R-L2 onsets. The basis of this calculation appears from theraster plot above the graph showing the relative timing of R–L2 onsets (sticks) and L-L2 onsets (open circles). A circular plot of 25 phase values picked at random from the whole episode of rhythmicity is seen at thebottom. The direction and length of thevector in the circular plot indicate the mean phase and the concentration of phase values around the mean phase, respectively. B1, An episode of phase drift in the same preparation after a midsagittal section of the L3–L6 segments illustrated in the schematic in the lower right cornerof B2. B2, The episode of phase drift plotted on a linear scale (top). The circular plot (bottom), which is based on 25 phase values picked at random, shows the highly reduced concentration of phase values around the mean phase, indicating looser coupling after the lesion. Only the short, high-amplitude bursts similar to those seen before the lesion are considered in the phase analysis. Drug concentrations: 5.5 μm 5-HT, 5.5 μmNMDA.
- Fig. 5.
Left/right coupling mediated through the L3–L6 segments. A, Rhythmic activity (left; induced by 6 μm 5-HT and 6 μm NMDA) before the lesion in a Th12–L6 preparation, shown together with alinear plot of 25 consecutive phase values (middle) and a circular plot of 25 random cycles covering the whole episode of rhythmicity (right). B1, B2, Rhythmic activity (B1, B2, left), linear (B1, B2, middle) and circular (B2, right) phase plots in the same preparation after a hemisection of the Th12–L2 segments (indicated in the schematic, B1, right). During the first part of the recording, sudden changes in period, not affecting contralateral bursting, appeared on both sides. As a result, two bursts could occur on one side that were not separated by a contralateral burst onset (B1, left andmiddle). Later, the period became more constant, but phase drift now occurred (B2, left andmiddle). These features indicating looser coupling were not observed before the lesion. Coupling was still significant, although the concentration of phases around the mean was reduced (compare A, right andB2, right). C, Rhythmic activity induced by lower drug concentrations (5.5 μm5-HT, 5.5 μm NMDA) after the lesion in the same preparation as in A, B1, andB2. The concentration of phase values around the mean again increased (C, middle andright), and the coupling was not significantly lower than during bursting in the higher concentration before the lesion (compare A, right and C,right).
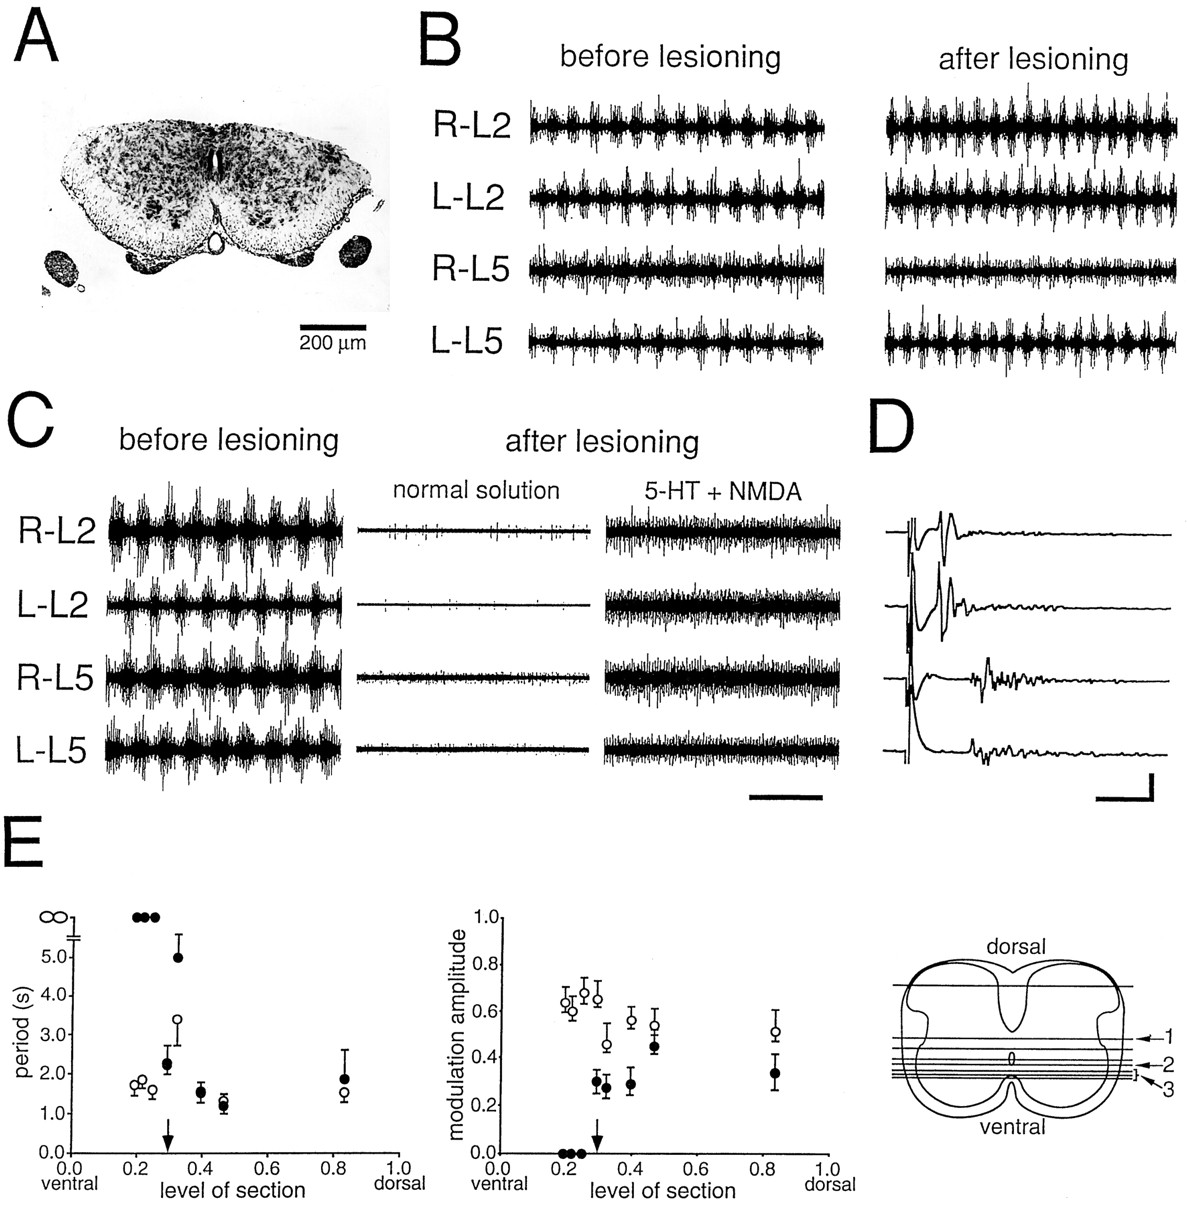
- Fig. 6.
Left/right alternation depends on an intact ventral commissure. A, B, Raw recordings (A) and circular phase plot (B) showing left/right alternation in an intact Th12–L4 preparation.C, D, After cutting the ventral commissure along the whole rostrocaudal extent of the cord, coupling became insignificant (p > 0.1). Another observation was a slowing of the period after surgery (time calibration: A, 2.5 sec; C, 10 sec). A period increase was seen in all preparations after ventral lesions uncoupling the two sides. E, F, Photomicrographs showing the lesion in overview (E) and in higher magnification (F). Drug concentrations: 15 μm5-HT, 7.5 μm NMDA. Scale bar: 300 μm inE, 500 μm in F.
- Fig. 2.
Activity in ventral fragments after horizontal sectioning. A, B, Rhythmic activity before (B, left) and after (B, right) a horizontal section removing the dorsal half of a Th12–L6 preparation. The remaining ventral half is shown on the micrograph in A. The section is indicated by the number 1 in the diagram inE (right). Rhythmic activity with left/right and rostrocaudal alternation persisted after the lesion with a slight reduction in modulation amplitude. Drug concentrations: 7.5 μm 5-HT, 7.5 μm NMDA. C, D, A different preparation (Th12–S1) with a more ventral lesion (indicated by the number 3 in E, right). The combination of drugs (20 μm 5-HT, 7.5 μm NMDA) that induced a clear rhythm before the lesion (C, left) only induced tonic activity after the lesion (C, right). D, It was still possible to elicit a ventral root response in all roots by stimulating the rostral end of the preparation, indicating that motoneurons were able to respond to synaptic input. E, Left, The period (mean and SD) against the level of section before (open circles) and after (closed circles) horizontal lesions for all preparations. The same set of 5-HT and NMDA concentrations was used before and after the lesion. The period was considered infinite when no rhythmic activity was observed. The level of section (shown directly on the right) is expressed as a fraction of the distance from the ventral to the dorsal border of the gray matter. The position of the central canal is indicated by anarrow above the x-axis. E, Middle, The relative modulation amplitude against the level of section. The upward deflecting error bars represent the SD of the peak amplitude, whereas downward deflecting error bars represent the trough amplitude SD. Both SDs were divided by the mean peak amplitude. E, Right, Schematic of all the lesions. The numbers are referred to in the text. Scale bars: 5 sec in B and C; 20 msec, 200 μV in D.
- Fig. 3.
Activity in fragments left from sagittal sections.A, Before sagittal sectioning (left), 20 μm 5-HT and 7.5 μm NMDA induced a regular bursting pattern in an intact Th12–S1 preparation. After sectioning, the same drug concentration failed to induce rhythmic activity in the small fragment (top two traces, right; indicated by the number 2 in D, right), whereas it was preserved in the large fragment (bottom traces, right) of the cord, although with a longer period. B, Micrograph of a transverse histological section of the preparation in A showing the localization of the lesion (arrows). Scale bar, 200 μm. C, Ventral root responses to stimulation of the ventral funiculus on the rostral end of the small fragment. Scale bars: 10 msec, 100 μV. D, Summary of activity in all small fragments left from sagittal sections. Period (left) and modulation amplitude (right) before the lesion (open circles) are shown with the corresponding measurements on the same side after the lesion (closed circles). In all cases, the same concentrations of 5-HT and NMDA were used before and after the lesions. The level of section is indicated as a fraction of the distance from the midline (M, below abscissa) to the lateral border of the gray matter (L). The schematic on the right shows the position of the medial border of the lateral fragment in the transverse plane. E, Summary of activity in all large fragments left from sagittal sections. Graphs as in D. The schematic on the right shows the position of the lateral border of the large fragment in the transverse plane. Note that the level of the cut surfaces differed in the smaller and larger fragments even when they were derived from the same preparation, as was generally the case (see text). Rhythmic activity was present in all large fragments, but it was only observed after the most medial section in the small fragments (indicated by the number 1 in D, right). The period increase as a function of the section level in the large fragment was fitted with a power function (curve inE, left; data points omitted for clarity).
- Fig. 9.
Rhythmic activity in spinal cord pieces consisting of few segments. A, Rhythmic activity in a Th12–L6 preparation. After dividing the T12–L6 preparation into two shorter pieces, a rostral part consisting of the Th12–L1 segments (A1a) and a caudal part consisting of the L2–L6 segments (1A1b), rhythmic activity could still be induced in both preparations. The period was shorter in the rostral preparation and, in this experiment, also shorter than during activity before the division (A). After further reduction of the two preparations by removing Th12 from the rostral preparation (A2a) and L2 from the caudal preparation (A2b), rhythm could still be induced in both preparations. The relative modulation amplitude was now higher in the rostral than in the caudal preparation. Drug concentrations: 7.5 μm 5-HT, 7.5 μm NMDA. B, Regular bursting in a caudal preparation consisting of two-thirds of the L3 segment and the intact L4–L6 segments. C, Data from an L4–L6 preparation showing rhythmic alternation in the L6 ventral roots. Drug concentrations: 9 μm 5-HT, 6 μm NMDA (B); 4.5 μm 5-HT, 4.5 μm NMDA (C). Scale bars: 5 sec inA–A2b, 10 sec in B; 5 sec inC. Data in A–A2b, B, andC are from three different animals.
- Fig. 7.
Rostrocaudal coordination mediated by the lateral funiculus. A, A lateral bridge (left schematic) was created at the L3 level. The right schematic shows the transverse extent of the bridge (thick line). Rostrocaudal alternation, observed before the lesion (B), persisted after creation of the bridge (C). On the ipsilateral side, caudal rhythmic activity showed a reduced modulation amplitude, but only tonic activity was observed contralaterally to the bridge. Rostral bursting was not severely affected by the lesion. Drug concentrations: 7.5 μm 5-HT, 7.5 μm NMDA. Th12–S1 preparation.
- Fig. 8.
Rostrocaudal coordination mediated by median pathways or the isolated ventral funiculus alone. After the creation of a median bridge at the L3 level (top schematic inA), bilateral rostrocaudal and left/right alternations were preserved (C). The activity before the lesion is illustrated in B. After removal of the majority of the bridge leaving only the ventral funiculus to connect the rostral and the caudal region of the preparation (middle schematicin A), bilateral rostrocaudal and left/right alternations were still preserved (D). A transverse histological section of the bridge (the ventral commissure) is shown inA (bottom), together with a section of the intact cord just outside the lesioned segment. Th12–S1 preparation. Drug concentrations: 7.5 μm 5-HT, 7.5 μm NMDA.
- Fig. 10.
Summary of the lesion experiments. The rhythm-generating network in L1–L6 is shown distributed along the cord as two medial columns (1). The taper and the color gradient indicate the high rostral and lower caudal ability to generate rhythmic activity. In the rostral end, the columns are shown in cross section, indicating that the rhythmogenic networks extend rostrally into the thoracic segments. The area below the level of the central canal almost with certainty contains part of the CPG for locomotor-related rhythmicity in the newborn rat. The neighboring upper area lateral and dorsal to the central canal also is likely to contain rhythm-generating networks, although this was not proven directly in this study. The mediolateral color gradient indicates the lower rhythmogenic potential in the lateral direction. The localization of the pathways mediating left/right alternation in the ventral commissure is indicated (2). The pathways mediating rostrocaudal alternation are shown widely distributed in the lateral and ventral funiculus on the left side of the preparation (3); note the possible contribution from all levels along the rostrocaudal axis. The rostrocaudal drive is indicated on the right side of the cord (4).


Tables
Rostral Caudal Average no. segments Preparations with rhythmic activity Relative modulation amplitude Period length Period coefficient of variation Th11–Th12 Th13 2.7 (n = 3) 100% 0.96 (0.54–1.30) 1.01 (0.94–1.08) 3.99 (1.32–6.12) Th12 L1–L2 3.3 (n = 7) 100% 0.84 (0.63–1.22) 1.16 (0.75–1.86) 2.13 (0.50–3.51) Th13 L1–L2 2.3 (n = 3) 100% 0.59 (0.42–0.70) 1.30 (0.75–1.92) 4.29 (1.07–8.89) L1 L3–L6 5.0 (n = 3) 100% 0.75 (0.62–1.00) 1.17 (1.03–1.38) 3.88 (2.61–6.22) L2 L4–L6 4.5 (n = 3) 67% 0.76 (0.72–0.78) 1.38 (1.17–1.59) 2.53 (2.25–2.82) L3 L6–S1 4.4 (n = 5) 80% 0.66 (0.57–0.70) 2.95 (1.52–5.53) 5.33 (2.16–9.76) L4 L5–L6 2.8 (n = 6) 33% 0.61 (0.38–0.83) 2.71 (1.46–3.97) 4.27 (3.92–4.63) The first two vertical columns identify the rostral and caudal borders of surgically divided short preparations. The average number of segments and number (n) of preparations used are given in the third vertical column; the fourth column shows the percentage of rhythmically active preparations within each group. The relative modulation amplitude, period length, and the period coefficient of variation were divided by the corresponding measurements before the lesion. The mean, followed by the range (in parentheses), is presented for this ratio.


