

Article Figures & Data
Figures
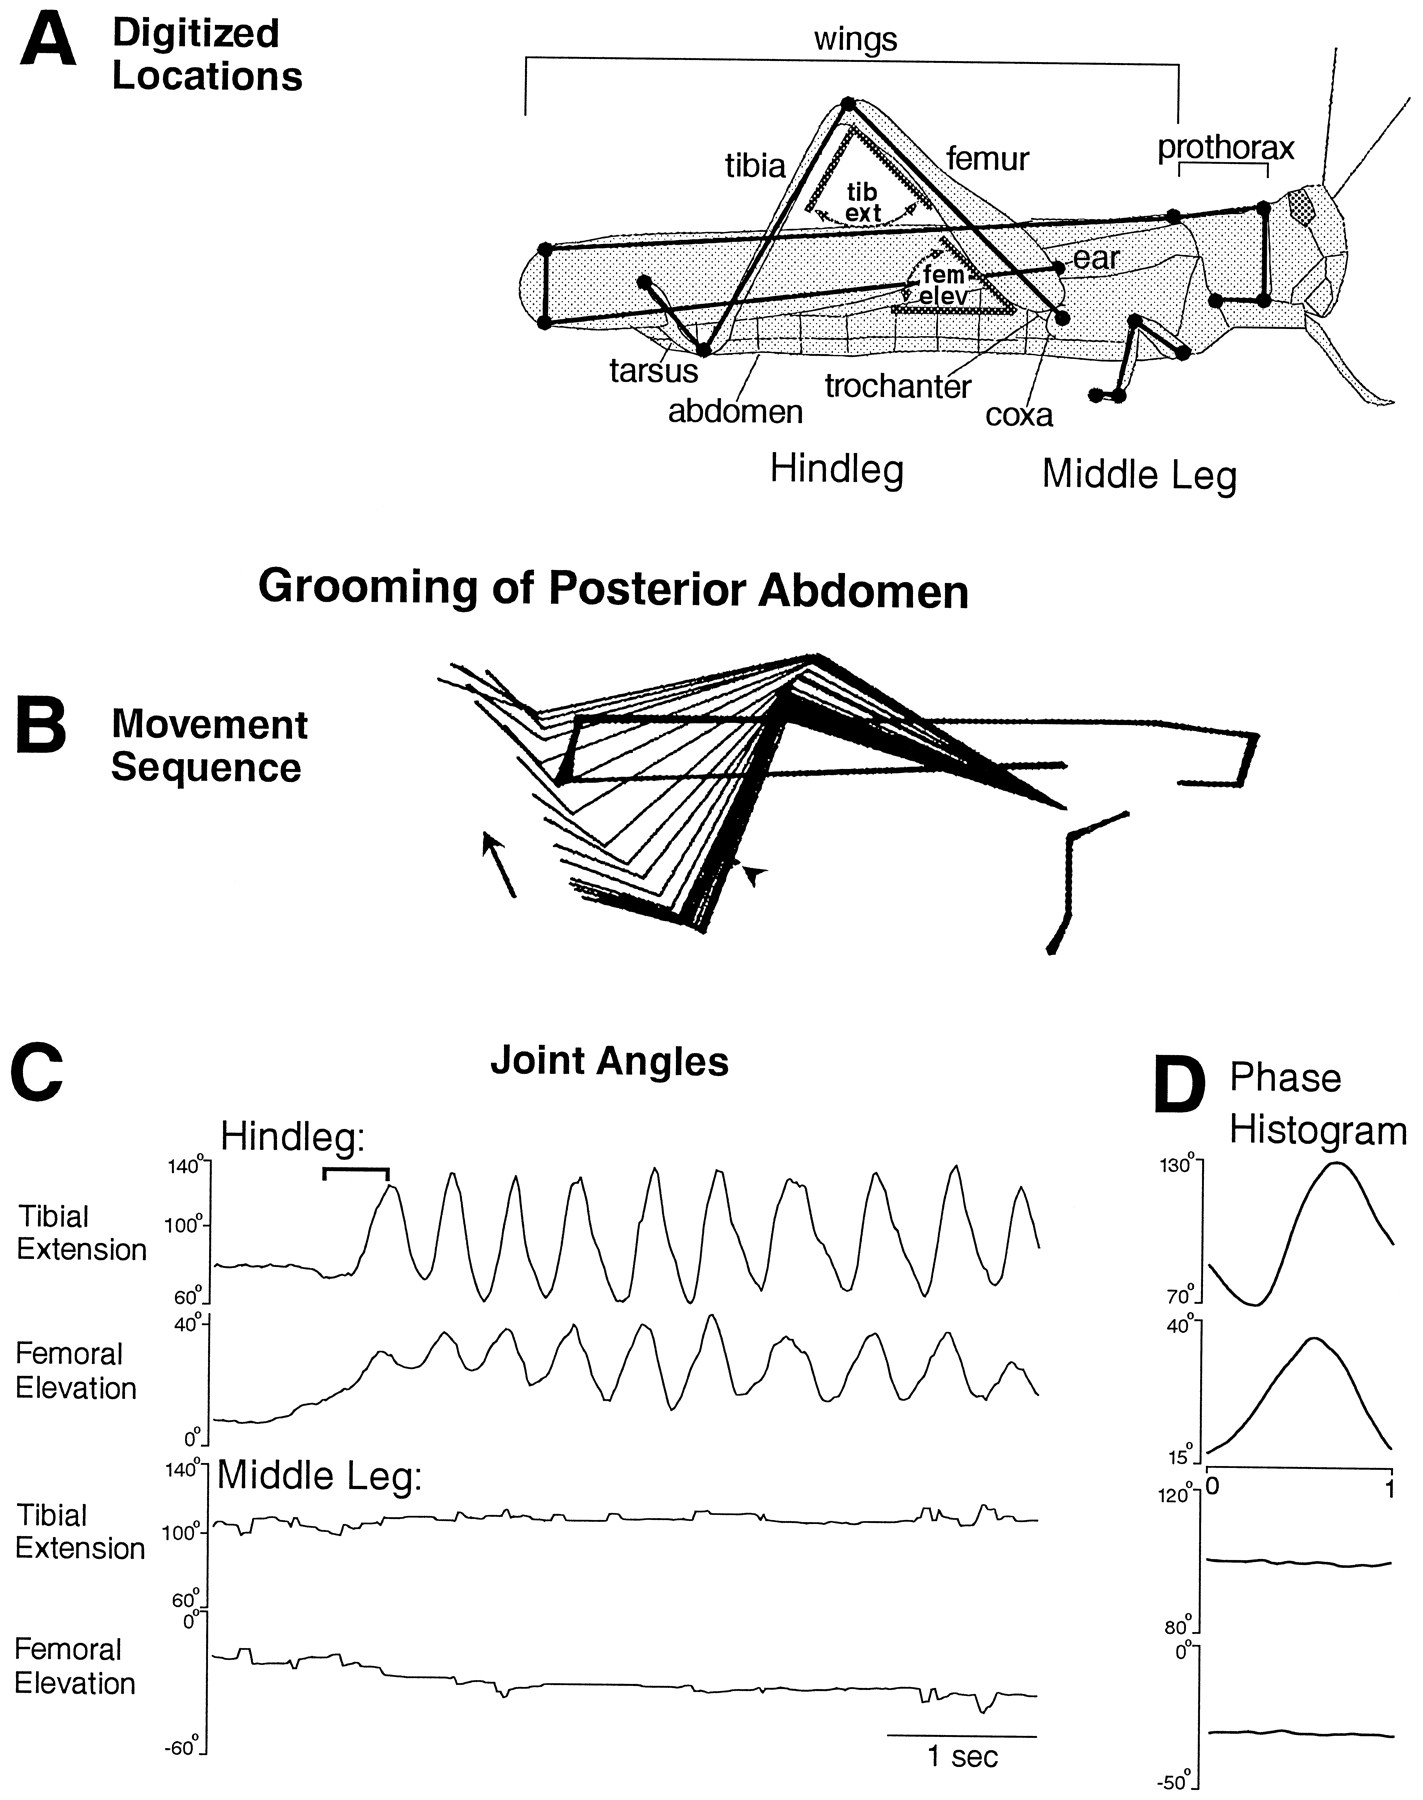
- Fig. 1.
Hindleg grooming of the posterior abdomen with all legs intact. A, Schematic illustration of how stick figure sequences were generated from pairs of video images using 15 digitized locations on the right hindleg, middle leg, thorax, and wings. Each filled circle represents a digitized location. Joint angles measured are indicated in gray, for the hindleg only. tib ext, Tibial extension;fem elev, femoral elevation. B, Stick figure sequence for the time period indicated by thebracket in C. Arrowindicates the direction of leg movements. In addition to the 15 locations on the locust, the location of the stimulus site (on the abdomen) is indicated by a sequence of dots(arrowhead just above and anterior to the tibia–tarsus joint). C, Hindleg and middle leg tibial and femoral joint angles as a function of time during an episode of grooming of the posterior abdomen. Tactile stimulation was begun before the period shown and was continued throughout this period. See Materials and Methods for definitions of joint angles. D, Phase histogram of joint angles for the episode of grooming shown inC, generated from nine cycles. Each phase histogram plot is for the joint angle adjacent to it in C. The reference joint angle, in this case hindleg femoral elevation, is identified by placement of the phase x-axis under that plot. See Materials and Methods for method of calculating phase histograms.
- Fig. 2.
Hindleg grooming of the posterior ventral hindleg coxa (arrowhead) with all legs intact. A,1, 2, Stick figure sequences for two portions of one cycle of grooming for the time periods indicated by thebrackets in B. B, Hindleg and middle leg tibial and femoral joint angles as a function of time during an episode of grooming of the posterior ventral hindleg coxa.Filled squares indicate contact between the hindleg tibia–tarsus joint and the site of stimulation. C, Phase histogram of joint angles for the episode of grooming shown inB, generated from eight cycles. The reference joint angle was hindleg femoral elevation. This is the same animal as shown in Figure 1; other conventions as in Figure 1.
- Fig. 3.
Hindleg grooming of the ear (located above the hindleg coxa) with all legs intact. A, C, Stick figure sequences for the time periods indicated by thebrackets in B and D, respectively. B, D, Hindleg and middle leg tibial and femoral joint angles as a function of time during the two episodes of grooming of the ear shown in A andC. Filled square indicates contact between the hindleg tibia–tarsus joint and the site of stimulation;filled diamond indicates removal of the paintbrush from the stimulus site by the hindleg tibia–tarsus joint. This is the same animal as shown in Figures 1 and 2; other conventions as in Figures 1and 2.
- Fig. 4.
Middle leg grooming of the anterior hindleg coxa.A, Stick figure sequence for the time period indicated by the bracket in B. B, Hindleg and middle leg tibial and femoral joint angles as a function of time during an episode of grooming of the anterior hindleg coxa.C, Phase histogram of joint angles for the episode of grooming shown in B, generated from 12 cycles. The reference joint angle was middle leg femoral elevation. This is the same animal as shown in Figures 1, 2, 3.
- Fig. 5.
Trajectories in “joint angle space” during grooming of each site for animal with all legs intact (A–C, E) and for animals in which EMGs were implanted in one hindleg and adjacent legs were removed (D, F).A–D, Each open symbolindicates the femoral elevation angle (x-axis) and the tibial extension angle (y-axis) calculated from one pair of digitized video images. Sequential open symbols are 1/60 sec apart. Arrows indicate the sequence of points when it was the same for all cycles shown. InA and C–F, joint angles are for the hindleg; in B, joint angles are for the middle leg. A, B, Three consecutive cycles of grooming for hindleg grooming of the posterior abdomen and middle leg grooming of the anterior hindleg coxa from the episodes in Figures 1 and 4, respectively. In each case, open squares indicate the first cycle, open circlesindicate the second cycle, and open triangles indicate the third cycle. C, D, Comparison of joint angle trajectories for grooming of the three sites by the hindleg. One cycle each is plotted from the episodes in Figures 1, 2, 3(for C) and from the episodes in Figures 6, 7, and9E (for D), using open symbols (circle for ventral hindleg coxa;square for posterior abdomen; trianglefor ear). The corresponding filled symbol in each case indicates the “center of mass” of the cycle, i.e., the mean femoral elevation and mean tibial extension values. C, All legs intact. D, EMG experiments. E,F, Center of mass of each cycle is plotted for all analyzed cycles of hindleg grooming of each site; symbols as inC and D. E, All legs intact; F, EMG experiments.
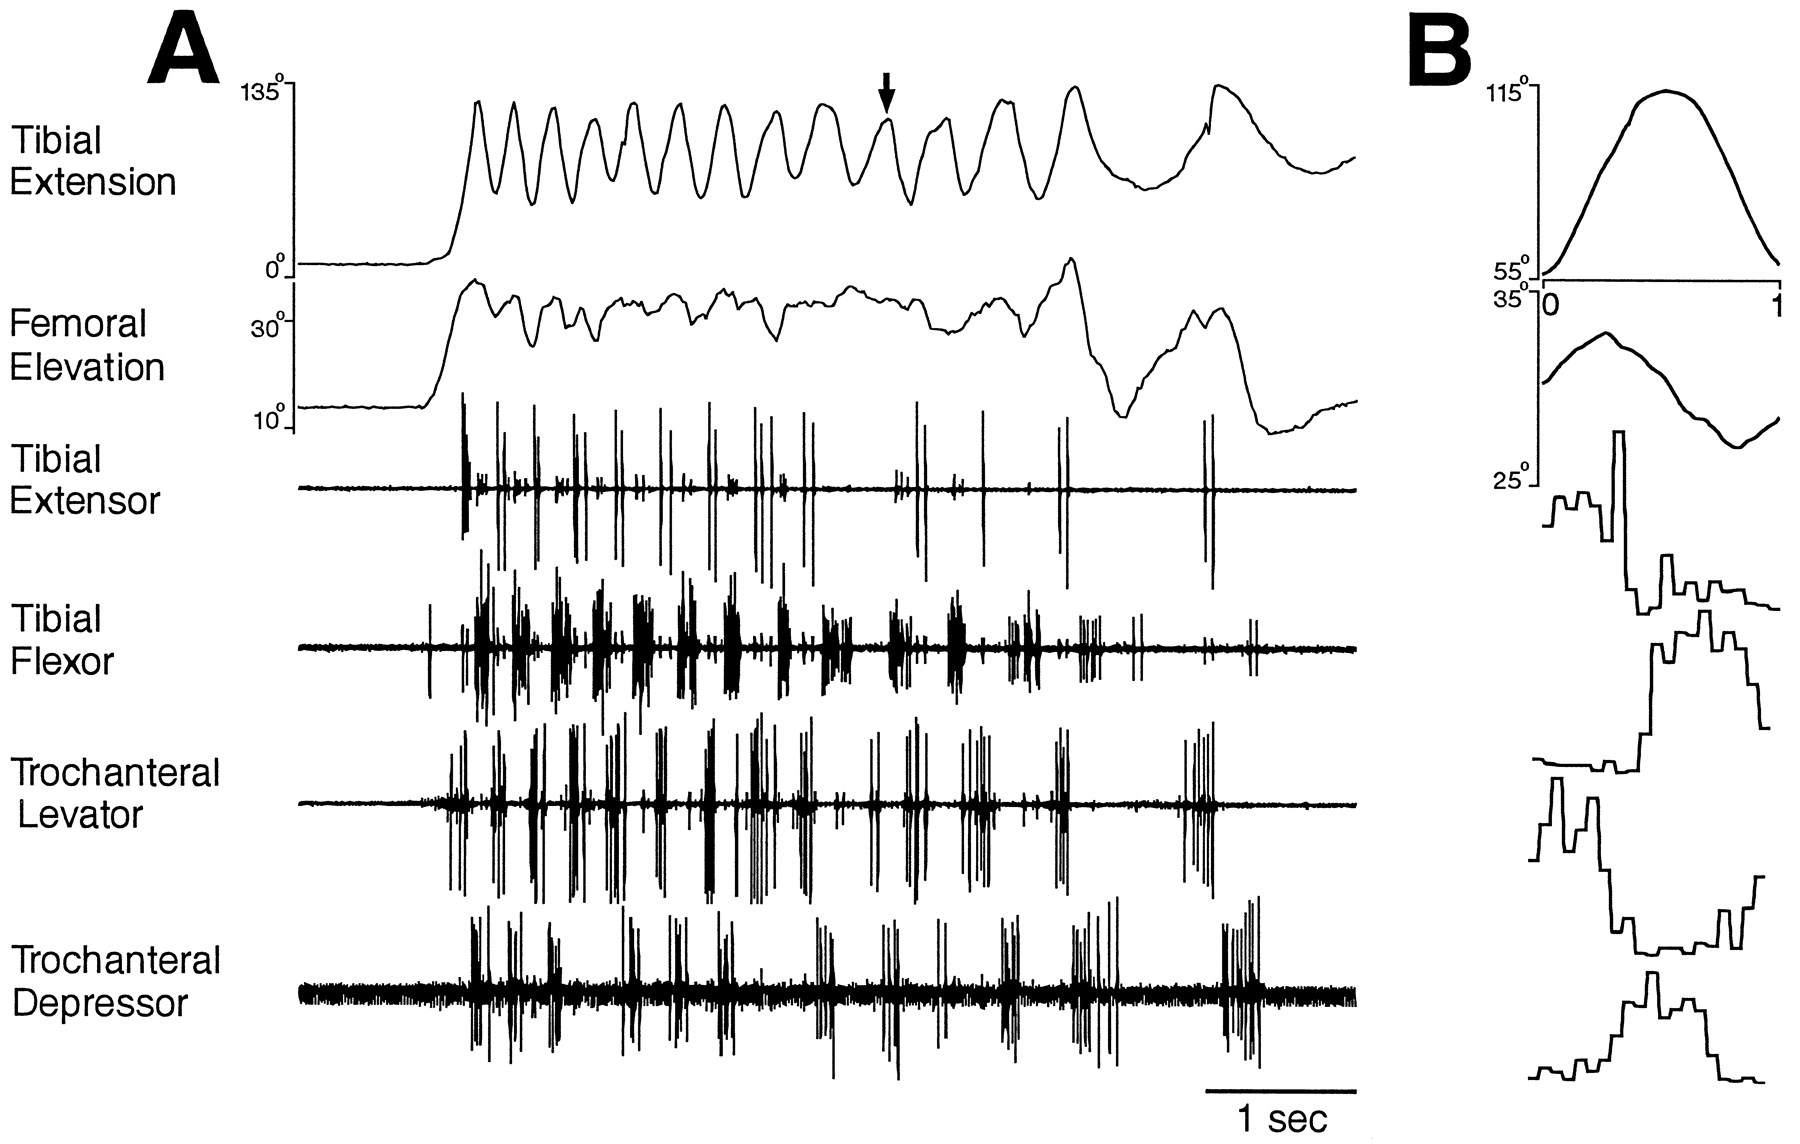
- Fig. 6.
Hindleg joint angles and simultaneous hindleg EMG recordings for hindleg grooming of the posterior abdomen. Fromtop to bottom, traces are tibial extension angle, femoral elevation angle, tibial extensor EMG, tibial flexor EMG, trochanteral levator EMG, and trochanteral depressor EMG.A, Joint angles and EMGs as a function of time.Arrow indicates a cycle of tibial extension that occurred without recorded tibial extensor muscle activity.B, Phase histogram of joint angles and EMGs for the episode of grooming shown in A, generated from 13 cycles. The reference joint angle was tibial extension.
- Fig. 7.
Hindleg joint angles and simultaneous hindleg EMG recordings for hindleg grooming of the ventral hindleg coxa.A, Joint angles and EMGs as a function of time.B, Phase histogram of joint angles and EMGs for the episode of grooming shown in A, generated from five cycles. The reference joint angle was tibial extension. These data were recorded from a different animal than the data in Figure 6.
- Fig. 8.
Hindleg joint angles and simultaneous hindleg EMG recordings for hindleg grooming of the ear. A, Joint angles and EMGs as a function of time. B, Phase histogram of joint angles and EMGs for the episode of grooming shown inA, generated from four cycles of femoral elevation. The reference joint angle was femoral elevation. These data were recorded from a different animal than the data in Figures 6 and 7.
- Fig. 9.
Hindleg joint angles and simultaneous hindleg EMG recordings for hindleg grooming of all three sites in a single animal.A, B, Posterior abdomen;C, D, ventral hindleg coxa;E, F, ear. A,C, E, Joint angles and EMGs as a function of time; B, D, F, phase histograms of joint angles and EMGs for the episodes of grooming shown in A, C, and E, respectively, generated from eight, two, and four cycles (of femoral elevation), respectively. The reference joint angle was femoral elevation in each case. For clarity, the gain of each joint angle and EMG trace has been adjusted to maximize the signal. These data were recorded from a different animal than the data in Figures 6, 7, 8.


