
Abstract
In Na+ channels, recovery from inactivation begins with a delay, followed by an exponential course, and hyperpolarization shortens the delay as well as hastens the entire exponential phase. These findings have been taken to indicate that Na+ channels must deactivate to recover from inactivation, and deactivation facilitates the unbinding of the inactivating particle. In contrast, it is demonstrated in this study that recovery from inactivation in Shaker K+ channels begins with no delay on repolarization. Moreover, hyperpolarization hastens only the initial phase (fast component) of recovery yet retards the later phases of recovery by increasing the proportion of slow components. The time course of slow inward “tail” K+ currents, which presumably result from the open state(s) traversed by the recovering inactivated channel, always matches the fast, but not the slow, components of recovery, suggesting that the fast and the slow components primarily correspond to recovery via the open state (unblocking of the inactivating particle before channel deactivation) and via the closed state (deactivation before unblocking), respectively. Besides, changing external K+ concentration effectively alters the absolute value of the initial recovery speed, but not its voltage dependence. It seems that Shaker K+channel deactivation hinders, rather than facilitates, the unbinding of the inactivating particle and therefore retards recovery from inactivation, whereas external K+ may enhance unbinding of the inactivating particle by binding to a site located near the external entrance of the pore.
- two-electrode voltage clamp
- Shaker K+channel
- deactivation
- ball and chain model of inactivation
- recovery from inactivation
- K+ ion binding site
K+ channels are important proteins controlling membrane excitability. Different K+channels may show different gating kinetics, which are crucial in considering the role of the channels in shaping cellular firing patterns (Rudy, 1988; Hille, 1992). The fast inactivation of Shaker K+ channels is termed N-type inactivation, to be distinguished from the other, slower inactivation (Iverson and Rudy, 1990; Hoshi et al., 1991). Like in Na+ channels, the development of N-type inactivation is explained by the “ball and chain” model (Armstrong and Bezanilla, 1977; Armstrong, 1981). According to the model, inactivation is produced by blocking the open channel with an inactivating particle (a peptide “ball”), which probably corresponds to the N-terminal region of the Shaker K+ channel protein (Hoshi et al., 1990; Zagotta et al., 1990)

Above is a simplified gating scheme incorporating the foregoing concepts of fast inactivation, in which OB and CB denote open and closed conformations blocked by the inactivating particle, respectively. Basically, the route C to O to OB should be the major or even exclusive pathway for the development of inactivation so that inactivation is “coupled” to activation, and most channels would not be inactivated (blocked) until being “used” (open). On the other hand, the inactivated channel (state OB) in principle may recover via the OB to O to C (unblocking before deactivation) route or the OB to CB to C (deactivation before unblocking) route, and the two routes have very different physiological meanings. The former implies substantial ionic currents through the channels traversing state O during recovery, whereas the latter assures no such “leak” or “slow tail” currents on repolarization. It is interesting that Na+ channels and Shaker K+ channels, although sharing similar molecular steps in the development of fast inactivation, seem to behave differently in recovering from inactivation. In Na+ channels the “deactivation before unblocking” route seems to be exclusively preferred to assure negligible leak Na+ currents during recovery (Kuo and Bean, 1994). On the other hand, many inactivated Shaker K+channels seem to take the OB to O to C route to recover because there are substantial macroscopic K+ currents or single channel openings on repolarization (Demo and Yellen, 1991; Ruppersberg et al., 1991).
The OB to O to C route, however, may not be the exclusive pathway of recovery for inactivated Shaker K+ channels. Demo and Yellen (1991) found that 8% recovery is via the closed state in 160 mm external K+ at −80 mV, and the percentage is higher at −120 mV or in 30 mm external K+, suggesting modulation of the recovery processes by membrane potentials and external K+. Because different recovery pathways imply different physiological consequences, it is desirable to explore the mechanisms modulating the molecular operations of recovery in Shaker K+ channels in more detail. It is demonstrated herein that the modulatory effects of external K+ and membrane potentials could be understood by kinetic interactions within a simplified gating scheme and that deactivation of the inactivated Shaker K+ channel probably retards, rather than enhances, the exit of the bound inactivating particle.
MATERIALS AND METHODS
Molecular biology and oocyte injection. All experiments were performed with mRNA synthesized from the Shaker GH4 K+ channel cDNA, which is essentially the same as Shaker H4 channel reported by Kamb et al. (1987), but with the addition of three “silent” restriction enzyme sites for BglII,BstII, and SmaI, as well as a larger 5′ untranslated region. Plasmids containing the ShGH4 cDNA were linearized by digestion with the appropriate restriction enzymes. Then linearized template cDNA was used for the synthesis of mRNA by standard methods, using T7 polymerase (MacKinnon and Yellen, 1990). Oocytes were harvested from mature Xenopus laevis females previously injected with human chorionic gonadotropin and dissociated in calcium-free OR-2 solution [(in mm) 82.5 NaCl, 2.5 KCl, 1 MgCl2, and 5 HEPES] with collagenase (Type IA, 1–2 mg/ml; Sigma, St. Louis, MO) for 1–2 hr. Isolated, follicle-free stage V to stage VI oocytes were selected and injected with 50 nl of synthetic mRNA in distilled water (0.1–1 mg/ml). Injected oocytes were maintained at 18°C in ND-96 solution [(in mm) 96 NaCl, 2 KCl, 1.8 CaCl2, 1 MgCl2, and 5 HEPES plus 50 mg/ml gentamycin] until subsequent recordings. With daily change of the ND-96-maintaining solution, the injected oocytes usually survived for at least 7–10 d.
Current recording and data analysis. Whole-cell Shaker K+ channel currents from the injected oocytes were usually of decent size and suitable for recording 2–3 d after injection. For recordings, oocytes were transferred to a chamber with continuous superperfusion of 150 mm K+ [(in mm) 150 KCl, 1 CaCl2, 1 MgCl2, and 10 HEPES, pH 7.4] or 150 mm Na+ or 300 or 500 mm K+ solutions. The composition of the latter three solutions is the same as that of the 150 mmK+ solution, except that 150 mm KCl is replaced by 150 mm NaCl or 300 or 500 mm KCl, respectively. The 300 and 500 mm K+ solutions are so hypertonic that the oocyte usually must go through one or two solutions of intermediate osmolarity (created by adding sucrose to ND-96) before being transferred into these recording solutions. Currents were measured at room temperature (∼22°C) by a standard two-electrode voltage-clamp amplifier (Warner OC-725B-HV; Hamden, CT), supported by a 12 bit analog/digital converter controlled by a laboratory personal computer. Data were sampled at 5–10 kHz and filtered at 2 kHz (8-pole Bessel filter). Linear, digital leak subtraction was performed off-line using leak currents measured by a hyperpolarizing pulse from −80 to −90 mV. Statistics are given as mean ± SD.
RESULTS
The recovery from inactivation in Shaker K+ channels begins with no delay in 150 mm external K+
In Na+ channels at the beginning of recovery there is a delay ascribable to the deactivation process (OB to CB in scheme 1) that the channel must go through before the inactivating particle could unblock (Kuo and Bean, 1994). If the inactivated Shaker K+channel may recover via the OB to O to C route, then no intermediate step is needed for the inactivating particle to unblock, and the recovery therefore should begin with no delay. Figure 1characterizes this very initial phase of recovery in Shaker K+ channels. Figure 1A monitors the voltage change of an oocyte in the two-electrode voltage clamp, showing faithful voltage control with satisfactory “clamp speed.” The voltage change is typically >60% in 0.1 msec and essentially is completed after 0.3 msec. Figure 1B illustrates that at either −70 mV or −220 mV there is always unequivocal recovery during the first 0.2 msec of repolarization. This is consistent with previous reports (Demo and Yellen, 1991; Ruppersberg et al., 1991) and suggests that in 150 mm external K+ many inactivated Shaker K+ channels take the OB to O route to recover from inactivation. Because the rate of development of C-type inactivation in wild-type Shaker H4 channels is ∼1–2 sec−1 in 10–100 mm external K+(Baukrowitz and Yellen, 1995), all inactivating pulses used in this study have been kept short (30–60 msec) to avoid significant contamination from other, slower inactivation process than N-type inactivation. This also is checked by examining the current of those Shaker GH4 channels for which the N-type inactivation is removed by deleting amino acid residues 6–46 (in 10–100 mm external K+ the rate of development of C-type inactivation in these mutated channels is not very different from that in wild-type channels; see Baukrowitz and Yellen, 1995). It is found that the currents generally decrease by no more than 3–5% over such short depolarizing pulses (see also Heginbotham and MacKinnon, 1993) (data not shown). Thus C-type or other, slower inactivation probably could be disregarded, and the consideration would be focused on N-type inactivation.
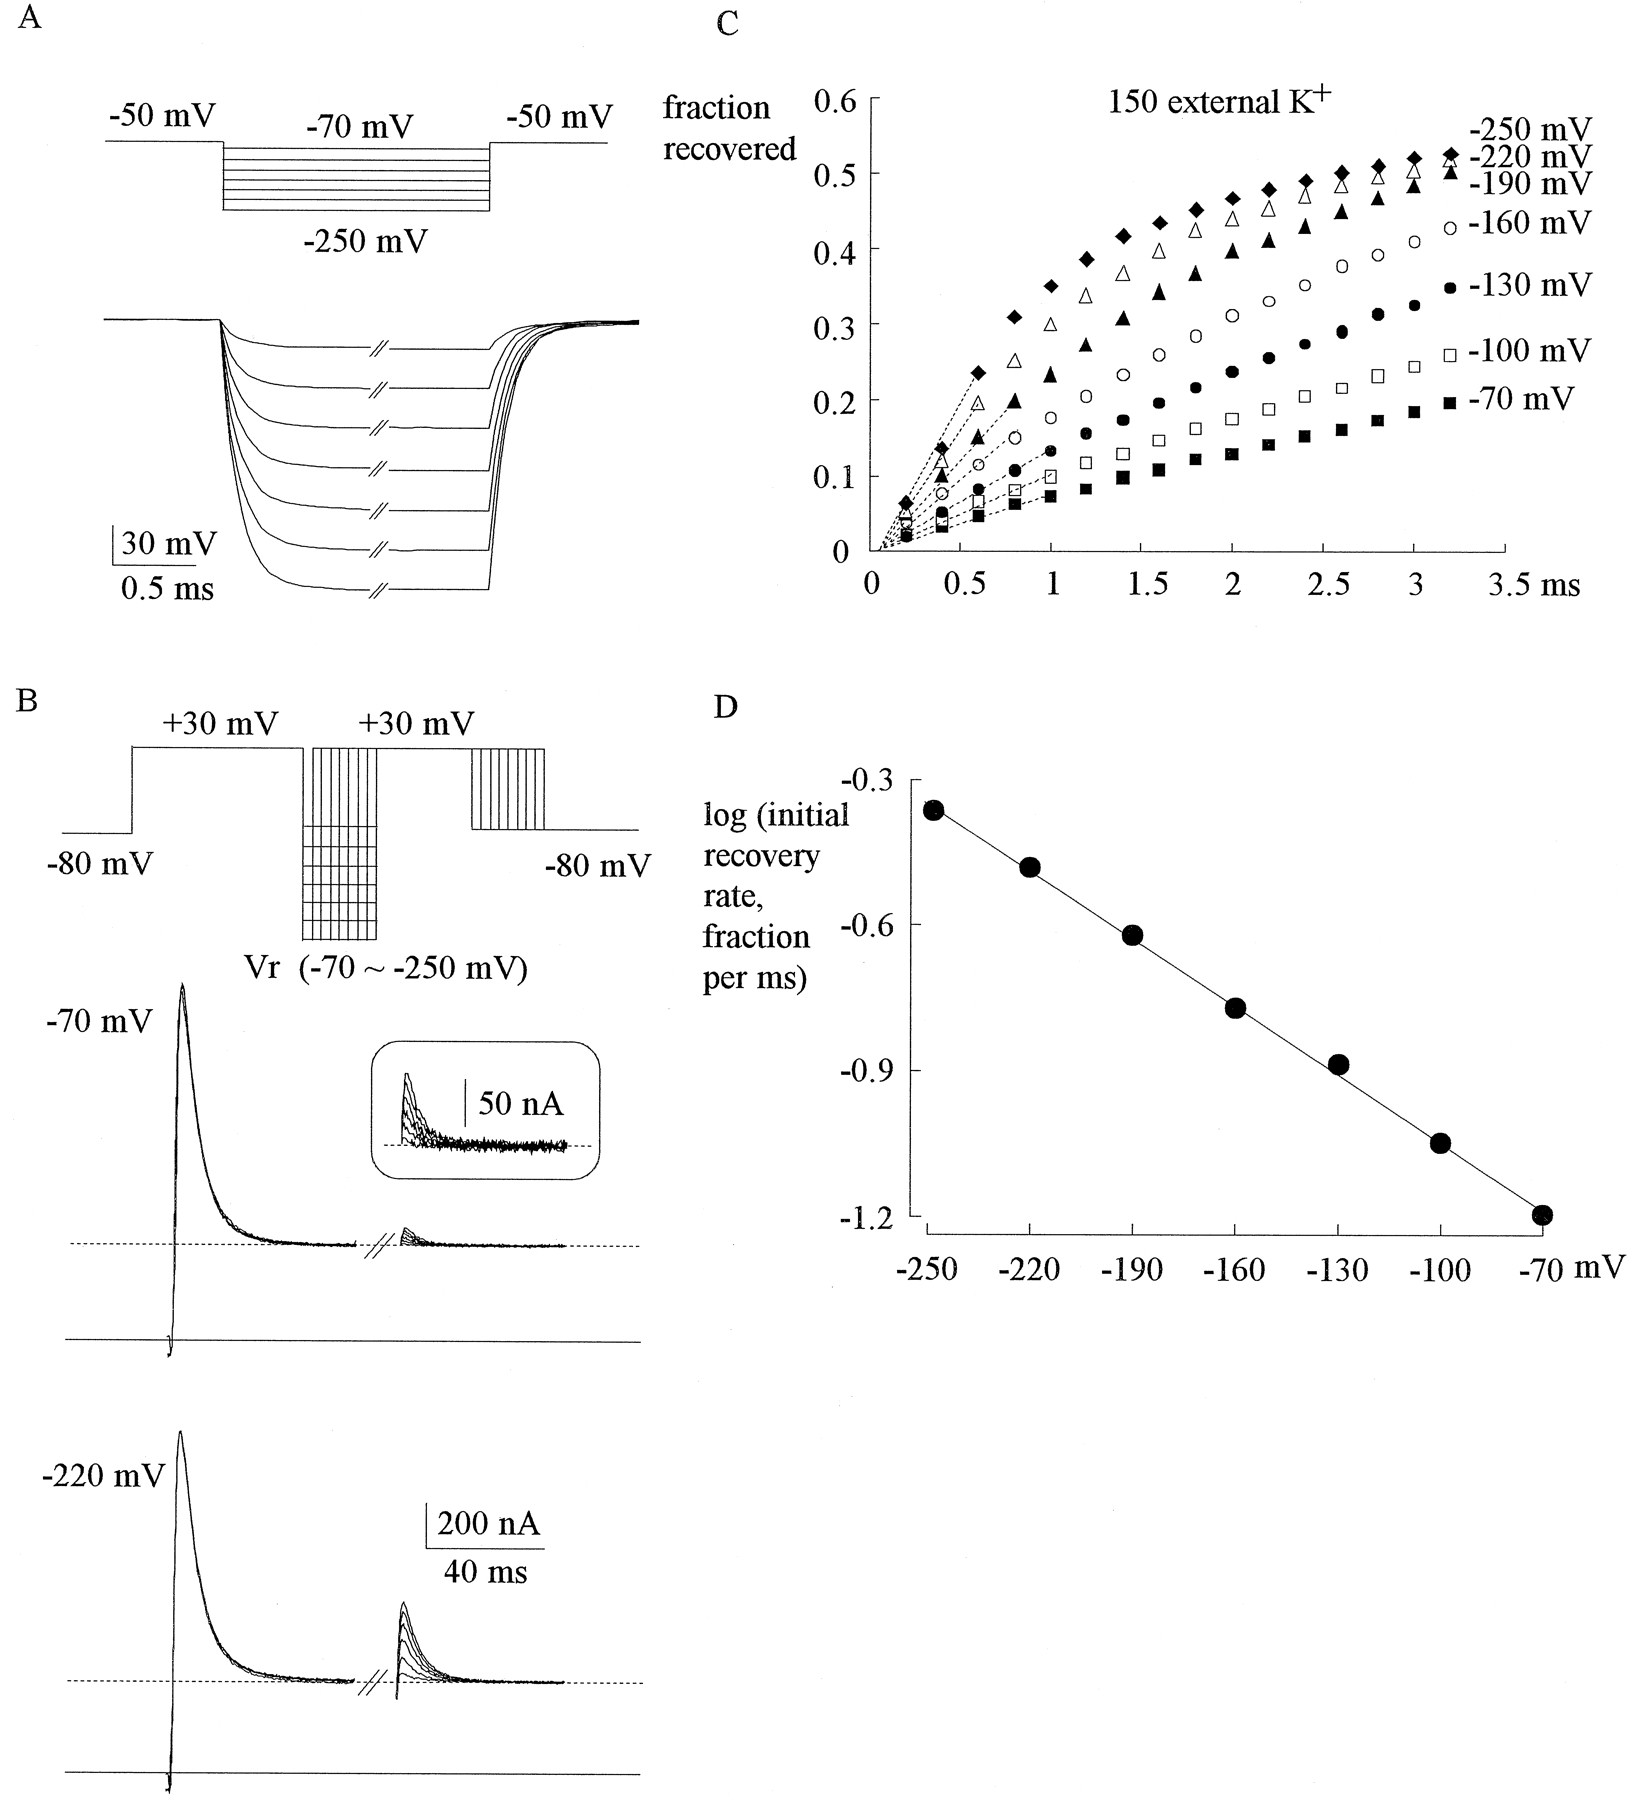
Initial phase of recovery in 150 mmexternal K+. A, Examination of the speed of voltage change and steady-state voltage control in two-electrode voltage clamp of an oocyte. The voltage change is 62% (of total) at 0.1 msec, 83% at 0.2 msec, 95% at 0.3 msec, and ∼99% at 0.4 msec.B, The oocyte was held at −80 mV and pulsed twice to +30 mV (each for 60 msec) every 3 sec. The intervening gap between the two pulses is set at various potentials (recovery potential,Vr) and lengthened by 0.2 msec between each sweep. The currents in the second pulse are used as a measure of the extent of recovery from inactivation produced by the first pulse. No matter thatVr is −70 mV or −220 mV (inset is an enlarged redrawing of the currents for Vr −70 mV), the currents in the second pulse appear within 0.2 msec. The initial rate of recovery, however, is faster at more negative Vr. Thesolid lines denote zero current level, and thedashed lines mark the sustained (noninactivating) current level. C, Time courses of recovery in the first ∼3 msec for Vr −70 mV to −250 mV by the same experimental protocol as that in B. Thehorizontal axis is the length of Vr. Thevertical axis is the extent of recovery (fraction recovered), which is the difference between the peak current of the second pulse and the current at the end of first pulse, divided by the difference between the peak current of the first pulse and the current at the end of the first pulse. The first three to five points at each potential are fit by linear regression functions (dashed lines) of the form: fraction recovered = slope ·t (t denotes length of Vrin msec), in which slope equals 0.060 (−70 mV), 0.085 (−100 mV), 0.12 (−130 mV), 0.17 (−160 mV), 0.25 (−190 mV), 0.33 (−220 mV), and 0.43 (−250 mV). D, The common logarithms of the slopes of the regression lines in C are plotted againstVr. The solid line is a linear regression fit of the form: y = −1.52 − 0.0047x, indicating that the initial recovery rate increases e-fold per ∼90 mV [(loge)/0.0047 = 92] of hyperpolarization.
The initial recovery rates increase consistently with increasing hyperpolarization in 150 mm external K+
Figure 1C depicts the time courses of recovery in the first ∼3 msec of repolarization. The recovery begins with no delay and follows an initial linear course, the slope of which is larger at more negative potentials. Figure 1D plots a common logarithm of the slope against membrane potential, with a regression line to indicate that the initial recovery rate consistently increasese-fold per ∼90 mV of hyperpolarization between −70 and −250 mV. Another interesting finding in Figure 1C is that the time course at −250 mV appears to “bend” more than the course at −190 mV when the recovery fraction exceeds ∼0.3. Thus the time courses at −190 mV to −250 mV are clearly apart at the beginning yet are converging at ∼3 msec. This implies that hyperpolarization probably accelerates only the early phase, but not the late phase, of recovery.
Strong hyperpolarization increases the proportion of a late slow recovery phase
The effect of hyperpolarization on the late recovery phase is investigated by examining the complete time courses of recovery in Figure 2. Figure 2A shows that the recovery courses at −40 to −100 mV are all essentially completed within 100 msec and can be approximated by monoexponential functions. At −130 mV or more negative potentials the recovery courses can be described only by two-exponential functions and start to “cross” each other (Fig. 2B), clearly indicating that increasing hyperpolarization hastens the initial phase, but not the late phase, of recovery. The fast time constants of these two-exponential recovery courses become smaller with increasing hyperpolarization (approximately e-fold change per 60 mV, Fig. 2C). On the other hand, the slow time constants of these courses seem to be voltage-independent (Fig.2D), although the proportion of the slow components increases as the membrane potential gets more negative (Fig.2E).

Extended time course of recovery in 150 mm external K+. A, Time courses of recovery at Vr −40, −70, and −100 mV. Voltage protocols and plots are as in Figure 1 except that the length ofVr is much longer here. Smooth curves are monoexponential fits of the form: fraction recovered = 1 − exp(−t/τ) (t denotes length ofVr, the horizontal axis), in which τ equals 27.2, 19.0, and 12.7 msec for the data in −40, −70, and −100 mV, respectively. B, Time courses are similar to those inA but are at Vr −130, −160, and −190 mV, with the time course at Vr −100 mV inA plotted here again for comparison. Note that the time courses “cross” each other. The smooth curves are two-exponential fits of the form: fraction recovered = 1 − 0.64 · exp(−t/5.3) − 0.36 · exp(−t/32) (−130 mV), = 1 − 0.61 · exp(−t/3.2) − 0.39 · exp(−t/44) (−160 mV), and = 1 − 0.55 · exp(−t/1.9) − 0.45 · exp(−t/38) (−190 mV). C, The fast time constants from the two-exponential fits in four cells are 5.6 ± 0.4 msec (−130 mV), 3.4 ± 0.3 msec (−160 mV), and 2.1 ± 0.3 msec (−190 mV). D, The slow time constants from the same data pool in C are apparently voltage-independent and are 39 ± 6 msec (−130 mV), 42 ± 2 msec (−160 mV), and 40 ± 3 msec (−190 mV). E, The proportion (preexponential factor) of the slow component from the same data pool in C increases with increasing hyperpolarization (0.31 ± 0.05 at −130 mV, 0.36 ± 0.03 at −160 mV, and 0.46 ± 0.02 at −190 mV).
The slow component of recovery represents recovery via the deactivated states
Because increasing hyperpolarization hastens the entire course of recovery in Na+ channels (Kuo and Bean, 1994), it is very interesting to see that stronger hyperpolarization hastens only the immediate recovery from inactivation yet drives more inactivated channels into some other states from which recovery is actually retarded. Based on scheme 1, a most straightforward explanation for these findings would be that increasing hyperpolarization not only speeds the unblocking of the inactivating particle from the open-blocked channel (OB to O or the initial recovery rate) but also enhances deactivation of the open-blocked channels (OB to CB). The essentially unchanged time constants of the slow component of recovery in Figure 2D then would suggest that CB to C is the slower (rate-limiting) step of the OB to CB to C route and possibly is not voltage-dependent. It has been shown that the recovery from inactivation in Shaker K+ channels is accompanied by prominent inward “slow” tail K+ current in 150 mm external K+ (Demo and Yellen, 1991;Gomez-Lagunas and Armstrong, 1994), which presumably results from the traversed open state during recovery (route OB to O to C in scheme 1). If the slow component primarily corresponds to recovery via the OB to CB to C route, then it should not be accompanied by significant tail currents. Figure 3A examines the slow tail currents, which match the fast components of macroscopic recovery in time course at various potentials (Fig. 3B) and clearly contain no “slow” phase corresponding to the slow component of recovery. This finding lends strong support for the view that the slow component of recovery primarily results from those inactivated channels recovering via the OB to CB to C route.

The slow inward tail currents at various repolarizing potentials in 150 mm external K+.A, The oocyte is held at −80 mV and pulsed every 3 sec to +60 mV for 30 msec and then repolarized to various potentials for 45 msec to demonstrate the slow inward tail currents. B, The decaying time constants of the slow inward tail currents from four cells are 6.1 ± 0.6 msec (−130 mV), 3.4 ± 0.2 msec (−160 mV), and 1.9 ± 0.2 msec (−190 mV), which correlate well with the fast time constants of macroscopic recovery (the same data as those in Fig. 2C) at various repolarizing potentials.
The initial recovery rates in 150 mm external Na+ are remarkably slower but carry the same voltage dependence
The recovery from inactivation was reexamined over the same wide range of repolarizing potentials in an external solution containing 150 mm Na+, but no K+. Strictly speaking, this is not a condition of “zero” but only “low” external K+, because with the two-pulse protocol used here the K+ ions flowing out during the first pulse may not be dissipated fully before the repolarizing pulse (the local residual K+ concentration is possibly 10–15 mm when checked by the reversal potential of the deactivating tail currents that follow a short depolarization pulse; data not shown). Similar to the findings in 150 mm external K+, the initial recovery phase in 150 mm Na+ (Fig.4A) follows a linear course, the slope of which, however, is consistently four to five times smaller than the slope at the same repolarizing potential in Figure 1C. Figure 4B plots a common logarithm of the slopes in Figure 4A against membrane potential, with a regression line having the same slope as, but a y-intercept 0.67 smaller than, the regression line in Figure 1D. This indicates that in 150 mm external Na+ the initial recovery rates also increase e-fold per ∼90 mV of hyperpolarization yet are, in general, 100.67 or ∼4.7 times slower than those in 150 mm K+ at every potential tested. The same experiments also are performed in 300 and 500 mm external K+. The y-intercepts of the regression lines similar to those in Figures1D and 4B on average differ by 0.66 between 150 mm external Na+ and 150 mm external K+ but show no difference among 150, 300, and 500 mm external K+ (Fig.4C). The slopes of these regression lines, on the other hand, always remain the same in either very low or very high external K+ (Fig. 4D).

Initial phase of recovery in 150 mmexternal Na+. A, Time courses are similar to Figure 1C on the basis of the same experimental protocols. The first six points at each potential are fit by linear regression functions (dashed lines) of the form: fraction recovered = slope · t, in which slope equals 0.013 (−70 mV), 0.019 (−100 mV), 0.026 (−130 mV), 0.037 (−160 mV), 0.052 (−190 mV), 0.07 (−220 mV), and 0.09 (−250 mV).B, The common logarithms of the slopes of the regression lines in A are plotted against Vr. Thesolid line is a linear regression fit of the form:y = −2.19 − 0.0047x.C, The y-intercepts of regression lines similar to that in B in various external solutions are −2.21 ± 0.25 (150 mm external Na+, 5 cells), −1.55 ± 0.04 (150 mm external K+, 4 cells), −1.51 ± 0.11 (300 mmexternal K+, 3 cells), and −1.57 ± 0.03 (500 mm external K+, 3 cells). D, The slopes of the regression lines in C are 0.0045 ± 0.0004 (150 mm Na+), 0.0047 ± 0.0002 (150 mm K+), 0.0046 ± 0.0005 (300 mm K+), and 0.0046 ± 0.0001 (500 mm K+).
There is a very slow component of macroscopic recovery in low external K+
Figure 5A shows more extended time courses of recovery up to 100 msec in 150 mm external Na+. The time courses also cross each other like those in Figure 2B. At −160 mV or more negative potentials, the time courses can be described only by two-exponential functions, and the fast time constants are smaller as the membrane potential goes more negative (Fig. 5B). For the late phase of recovery, it is noteworthy that in 150 mm external Na+ the recovery at 100 msec is clearly not complete at these negative potentials. This phenomenon is more pronounced at more negative potentials (Fig. 5A) as if, other than the fast and slow components, there are some “very slow” components of recovery. Although C-type or other slow inactivation may become more prevalent in low external K+ (Baukrowitz and Yellen, 1995), it is hard to envisage how these very slow components, if resulting from C-type inactivation, should become more pronounced at more negative repolarizing potentials. An alternative to explain this phenomenon is to make scheme 1 less oversimplified by adding more closed states (see scheme 2 below, in which −V denotes those hyperpolarization-accelerated key processes under discussion here). Because the initial recovery rate (OB to O rate) is quite slower in low external K+ than in high external K+ (Figs.1C, 4A), the chance of taking the OB to CB route, and consequently the chance of reaching state C′B, would be higher in low K+. With scheme 2 the very slow component of recovery may be explained by a hypothesis that some inactivated channels are moved into the C′B state, along with a very slow unblocking rate from the more completely deactivated state (very slow C′B to C′ rate).


Extended time courses of macroscopic recovery in 150 mm external Na+. A, Time courses of recovery at recovery potential (Vr) −100, −160, and −220 mV. Voltage protocols and plots are as in Figure 2. The time courses also “cross” each other, yet the recovery at 100 msec becomes incomplete, especially at more negativeVr. The smooth curves are mono- or two-exponential fits of the form: fraction recovered = 0.95 − 0.95 · exp(−t/37) (−100 mV), = 0.92 − 0.35 · exp(−t/8.6) −0.57 · exp(−t/53) (−160 mV), and = 0.82 − 0.22 · exp(−t/3.3) − 0.60 · exp(−t/39) (−220 mV). B, The fast time constants from the two-exponential fits in three cells are 8.0 ± 0.7 msec (−160 mV), 4.8 ± 0.9 msec (−190 mV), and 3.0 ± 0.5 msec (−220 mV).
The very slow component of recovery also is observed in high external K+ at extremely negative potentials
Considering that increased hyperpolarization would increase the chance for a channel in state OB to recover via the OB to CB route (Fig. 2E), if the very slow component of macroscopic recovery in low external K+ is indeed a result of simple kinetic interactions rather than an effect of external K+on some slow inactivation processes, then the very slow components of recovery should become manifest even in high external K+ at very negative recovery potentials. Figure 6 illustrates that in 300 mm external K+ the recovery essentially is complete after 100 msec at −130 mV, whereas at −250 mV a very slow component (∼20% of total) of macroscopic recovery similar to that observed in Figure 5 occurs, and the recovery clearly is incomplete after the same 100 msec period.

Recovery time course at extremely negative recovery potential (Vr) in 300 mm external K+. Voltage protocols and plots are as in Figure 2. AtVr −130 mV, the recovery essentially is complete at 100 msec, whereas at Vr −250 mV the recovery is far from complete at 100 msec. The smooth curves are two-exponential fits of the form: fraction recovered = 1 − 0.75 · exp(−t/5.1) − 0.25 · exp(−t/41) (−130 mV), and = 0.81 − 0.63 · exp(−t/0.9) − 0.18 · exp(−t/42) (−250 mV).
DISCUSSION
Quantitative analysis and support of the gating scheme
In this study the fast or initial phase of recovery from inactivation is characterized in several different ways, namely the linear regression for the initial recovery rates, the exponential fit for extended recovery time courses, and the decay of the slow inward tail currents during recovery. The relationship among these measurements may be derived analytically on the basis of a more elaborated form of scheme 2 (Fig. 7). Focusing on the fast recovery (OB to CB to C) route, we have:

 Equation 1
 in which OB(0) denotes the fraction of OB at the beginning of repolarization, and t denotes time. The reverse reactions C to O and CB to OB are assumed negligible at the hyperpolarized recovery potentials. The reaction O to OB also is neglected, because most channels in state O would be “absorbed” to state C because of the very rapid δ (>2 msec−1 at −100 mV, measured by the decay of the deactivating tail currents after a short activating pulse; data not shown) and the slow O to OB rate (∼0.1 msec−1, measured by the decay of the macroscopic outward currents at +60 mV). Solve the equations for O(t) and C(t):

 Equation 2
 C(t) + O(t) here is the extent of the fast component of recovery. If the initial recovery rate (Fig.1C) represents the OB to O rate (α), it should be equal to the product of the inverse of the fast time constant (α+γ) and the proportion of the fast component of the extended recovery time course [α/(α+γ)]. This seems true by comparing such products from the time courses at −70 to −190 mV in Figure 2 and the initial recovery rates at the same potentials in Figure 1C. Furthermore, the slow inward tail current at repolarization represents the proportion of state O as a function of time, O(t). Because δ is quite faster than (α+γ), according to the above equation O(t) would approximate a monoexponential decaying function (after a transient initial rising phase) with a time constant of 1/(α+γ), the foregoing fast time constant. These are just the findings in Figure3.

An elaboration of scheme 2 summarizing the findings. +V and −V mean that a reaction process is accelerated with depolarization and hyperpolarization, respectively. Because the unbinding rates of the inactivating particle are smaller from the more deactivated channel, the binding rates onto the more deactivated channel also must be smaller so that channel inactivation is still coupled to activation. The longitudinal arrows, therefore, are made smaller toward theleft side of the scheme. The rate constants of some key steps in the scheme are (all in msec−1): unbinding rate from the OB state, α (in 150 mm external K+) = 0.028 · exp(Vm/−90) or α (in 150 mmexternal Na+) = 0.006 · exp(Vm/−90), in which Vm denotes membrane potential; deactivation rate of the OB state, γ = 0.003 · exp(Vm/−47); deactivation rate from the O state, δ > 2 at −100 mV and even faster at more negative potentials. These numbers mostly are derived directly from the experimental findings, except that γ is a postulated function to well recapitulate the observed proportions of fast and slow components of recovery. The unbinding rate from the CB state (CB to C rate) may be set at a voltage-independent value ∼0.025 msec−1, because the slow time constants of the recovery course are always ∼40 msec at −130 to −190 mV. Such voltage independence, in contrast to the definite voltage dependence of α, implies that the activation–deactivation conformational changes alter the electrical lines across the pore; thus, the bound inactivating particle could no longer sense the electrical field in the closed channel.
Some other findings also may be discussed in the light of the same quantitative arguments. For example, the initial recovery rates (α) are accelerated consistently e-fold per 90 mV hyper-polarization between −70 and −250 mV (Figs.1D, 4B), whereas the voltage dependence of the fast time constants [1/(α+γ)] seems stronger (e-fold change per ∼60 mV between −130 and −190 mV or between −160 and −220 mV; Figs. 2C, 5B). Moreover, the initial recovery rates in 150 mm external K+ and in 150 mm external Na+always differ by ∼4.5 times at potentials between −70 and −250 mV (Fig. 4C), but the fast time constants of macroscopic recovery in these two conditions differ by only ∼2.3 times (at −160 to −190 mV, Figs. 2C, 5B). With the foregoing equations these findings may imply that γ is more voltage-dependent than α, and external K+ probably accelerates only α, but not γ.
The route of recovery from inactivation for Shaker K+ channels
Unlike Na+ channels, Shaker K+ channels may take either the OB to O to C or OB to CB to C route to recover from inactivation. With reactions O to OB and CB to OB being negligible during recovery (see above), the preponderance of each route would be determined by the ratio between α and γ in Figure 7. In 150 mm external K+, 31–46% of recovery is via the OB to CB route at −130 to −190 mV (Fig. 2E). These are fairly close to the γ/(α+γ) ratios in Figure 7 (29–43%) in the same conditions. In low external K+, α decreases, and the chance of getting into the OB to CB route is consequently higher. Figure 5A indicates that the fast components comprise only 35–23% of total recovery at −160 mV to −220 mV, or 65–77% of total recovery is via the OB to CB route. These are again close to the γ/(α+γ) ratios in Figure 7 (72–82%). It is interesting to note that the γ/(α+γ) ratio is ∼50% at −70 mV in low external K+. Thus both recovery routes are probably similarly important in the physiological condition.
Deactivation retards recovery from inactivation in Shaker K+ channels: contrast with Na+ channels
Hyperpolarization apparently has two distinct effects on recovery of the inactivated Shaker channels. It hastens the initial recovery phase, presumably by facilitating the unblocking step OB to O, yet retards the late recovery phase, presumably by forcing deactivation of the inactivated channels. A very interesting connotation from this finding is that the unblocking rate CB to C is significantly slower than OB to O. The very slow components of recovery in Figures5A and 6 further suggest that the unblocking rate is even slower as the channel is deactivated more fully (very slow C′B to C′ rate). This is as if the inactivating particle is “locked” in the pore when the channel is forced to deactivate before the inactivating particle unblocks. The blocking of delayed rectifier K+channels in squid giant axon by tetraethylammonium (TEA) ion derivatives has been shown to be similar to K+ channel inactivation in many aspects, including the findings that the unblocking of TEA derivatives is also four to five times faster when external K+ is increased from 10 to 440 mm(Armstrong, 1971) and that TEA binding also strongly immobilizes the gating charges (Bezanilla et al., 1991; Perozo et al., 1993). In this light, it is interesting to note that the recovery from the block by TEA derivatives at −100 mV also shows a faster initial phase, yet a slower late phase, as compared with the recovery at −60 mV (Armstrong, 1971).
Such a lock-in effect of the inactivating particle in deactivated Shaker channels is in sharp contrast to the case in Na+channels, in which stronger hyperpolarization monotonously speeds up the whole course of recovery (Kuo and Bean, 1994). It seems that in Na+ channels inactivation is coupled to activation, because the receptor conformation for the inactivating particle is “created” with channel activation and thus channel deactivation would “eject” the inactivating particle by destroying the receptor (“modulated receptor”), whereas the activation/deactivation processes in Shaker K+ channels alter the “doorway” of the receptor (“guarded receptor”), with or without an as drastic change of the receptor conformation itself.
Location of the external K+ binding site of which the effective occupancy accelerates recovery from inactivation
Consistent with previous reports (Demo and Yellen, 1991;Gomez-Lagunas and Armstrong, 1994), the initial recovery rates in 150 mm external K+ are four to five times faster than those in 150 mm external Na+. The initial recovery rate may be expressed in terms of the occupancy of an enhancement site by external K+ (OP) as:

 Note that when external K+ is exerting this recovery-enhancing effect the pore is blocked by the inactivating particle, so any K+ from the outside must go back to the outside. Thus OP will change with the membrane potential according to the electric distance of the site (Woodhull, 1973). Because different OP at different potentials will contribute to the overall change of initial recovery rate with voltage, the apparent voltage dependence of the initial recovery rate may be larger than the intrinsic voltage dependence of the unblocking rate (presumably the same in both enhanced and unenhanced conditions) itself.
The same initial recovery rates in 150–500 mm external K+ (Fig. 4C,D) suggest that the enhancement site is nearly fully occupied in 150 mm (or higher) external K+ at −70 to −250 mV (see also Murrell-Lagnado and Aldrich, 1993). In other words, OP remains close to 1 and does not change significantly with membrane potential in these conditions. The observed voltage dependence of the initial recovery rates (e-fold change per ∼90 mV) therefore must be fully ascribed to the intrinsic voltage dependence of the unblocking step. On the other hand, the enhancement site seems far from fully occupied in 150 mm external Na+, because the initial recovery rates here are four to five times slower. These initial recovery rates, however, still change e-fold per 90 mV, the intrinsic voltage dependence of the unblocking step. Thus OP does not change significantly from −70 to −250 mV even when the site is by far not saturated, indicating that the electric distance of the enhancement site is negligible from outside. This K+ binding site thus may be located near the external entrance of the K+ channel pore, just like the high-affinity Ca2+ binding sites in the L-type Ca2+ channel pore (Kuo and Hess, 1993) or even on the external surface of the Shaker K+ channel. In either case the enhancement phenomenon possibly represents an allosteric rather than a direct “knock-off” effect, because the binding site for the inactivating particle presumably is located closer to the other end of the pore. Also, the existence of intrinsic voltage dependence of the unblocking step suggests that the inactivating particle is effectively charged and is bound to a receptor not located at electric distance ∼0 from the internal pore mouth.
Gomez-Lagunas and Armstrong (1994) proposed that this recovery-enhancing K+ binding site may be located deep in the pore (electric distance > 0.5 from outside) because Ca2+, which blocks Shaker channels with an electric distance of 0.5, cannot enhance recovery from inactivation, whereas Cs+, which blocks Shaker channels with an electric distance of 0.9 from outside, shows remarkable enhancement effect. However, Ca2+ might reach the enhancement site but could not bind to it well, and Cs+ might bind to a superficial site to enhance recovery before it binds to another, deeper site to block the pore. A superficial location of the enhancement site therefore is not incompatible with previous reports and seems to be the simplest way to explain the findings here.
Footnotes
- Received January 3, 1997.
- Revision received February 24, 1997.
- Accepted February 27, 1997.
This work was supported by Grant NSC 85-2331-B-002-154 from the National Science Council, Taiwan, Republic of China. I am very grateful to Dr. Bruce P. Bean for his kind advice and encouragement as well as for his generous support in equipment. I also thank Dr. Roderick MacKinnon for providing the Shaker GH4 cDNA as a gift.
Correspondence should be addressed to Dr. Chung-Chin Kuo, Department of Physiology, National Taiwan University College of Medicine, No. 1, Jen-Ai Road, First Section, Taipei 100, Taiwan, Republic of China.
- Copyright © 1997 Society for Neuroscience