

Article Figures & Data
Figures
- Fig. 1.
Inhibition of thermal nociceptive behaviors by α2AR agonists in D79N and WT mice. A, Comparison of WT and D79N mice in the hot water tail-flick test. Administration of the α2AR agonist UK 14,304 (3.0 nmol, i.t.) produced long-lasting antinociception in WT animals. In D79N mice, however, neither a 3.0 nor a 100 nmol dose of UK 14,304 was antinociceptive. Baseline tail-flick latencies did not differ between the two strains (see time = 0). Error bars represent ±SEM for each dose point (n = 6–10 animals/dose).
- Fig. 2.
Inhibition of thermal nociceptive behaviors by morphine in D79N and WT mice. Comparison of WT and D79N mice in the hot water tail-flick test. Intrathecal administration of morphine produced dose-related antinociception in both WT and D79N animals. The ED50 for morphine in WT animals (0.52 nmol; 95% CI = 0.36–0.74) was not significantly different from that observed in D79N animals (ED50 = 0.53 nmol; 95% CI = 0.27–1.0). Error bars represent ±SEM for each dose point (n = 6–10 animals/dose).
- Fig. 3.
Inhibition of SP-elicited behavior by α2AR agonists in D79N and WT mice. A, UK 14,304 inhibited SP-elicited behavior in a dose-dependent manner in both D79N and WT mice. The ED50 for UK 14,304 increased >250-fold in D79N mice (95 nmol; 95% CI = 58–158) compared with WT (0.37 nmol; 95% CI = 0.21–0.65). B, SP-elicited behavior was inhibited by dexmedetomidine in a dose-dependent manner in both WT (ED50 = 0.014 nmol; 95% CI = 0.008–0.025) and D79N (ED50 = 35 nmol; 95% CI = 24–51) mice; however, a 2500-fold decrease in agonist potency was observed in the D79N animals. Error bars represent ±SEM for each dose point (n = 6–10 animals/dose).
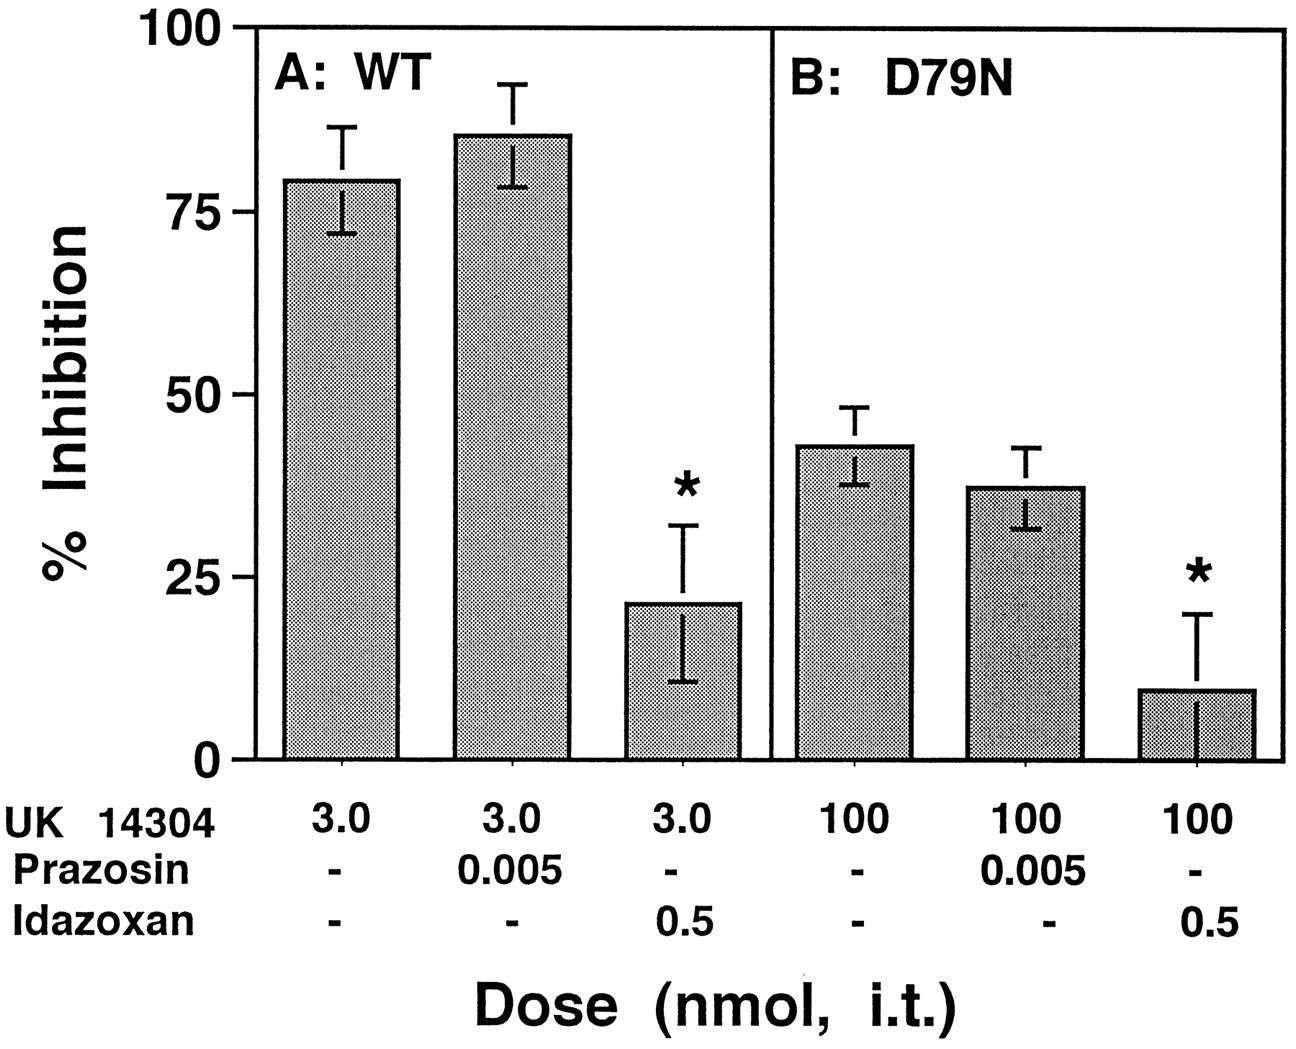
- Fig. 4.
Selective antagonism of the analgesic effects of UK 14,304 by idazoxan but not by prazosin. A, UK 14,304 (3.0 nmol, i.t.) inhibited SP-elicited behavior in WT animals (left column). Prazosin, an antagonist at α1AR as well as the α2bAR and α2cAR subtypes, failed to antagonize the inhibitory effects of UK 14,304 (middle column), but the nonsubtype-selective α2AR antagonist idazoxan significantly attenuated the action of UK 14,304 (right column) in these animals. B, The inhibitory action of 100 nmol UK 14,304 (left column) was not altered by co-administration of prazosin in D79N mice (middle column), whereas idaxozan antagonized UK 14,304 in these animals (right column). Antagonism by idazoxan was dose-related in both WT and D79N mice. The IC50 values were 0.14 nmol (95% CI = 0.07–0.31) in WT and 0.013 nmol (95% CI = 0.001–0.32) in D79N and were not significantly different. Error bars represent ±SEM for each dose point (n = 6–10 animals/dose).
- Fig. 5.
Co-administration of UK 14,304 (+ 5 pmol prazosin) and deltorphin II is synergistic in WT but not in D79N mice.A, SP-elicited behavior was challenged by intrathecal administration of either deltorphin II or UK 14,304 + 5 pmol prazosin (UK + P) or both in WT mice. UK + P (squares) and deltorphin II (circles) inhibited the behavior in a dose-dependent manner with similar potency and efficacy. When both UK 14,304 and deltorphin were co-administered, a constant potency ratio (1:1 molar agonist ratio) was maintained. The combination treatment (triangles) was ∼10-fold more potent than either drug given alone, an indication of a synergistic interaction. The abscissa for the combined treatment dose–response curves represent the dose of UK 14,304 in the presence of an equal potency ratio of deltorphin II. B, Isobolographic analysis was applied to the data from Figure 5A. They-intercept represents the ED50 (0.24 nmol; 95% CI = 0.09–0.63) for UK + P, and thex-intercept represents the ED50 (0.42 nmol; 95% CI = 0.21–0.87) for deltorphin II when each was administered alone for inhibition of SP-elicited behavior in WT mice. Theheavy line connecting the intercepts is the theoretical additive line. Coordinates for drug combinations falling below this line and outside the confidence limits indicate synergy. When the two compounds were co-administered in WT animals, the resultant ED50 (0.021 nmol; CI = 0.016–0.028) of UK + P in the presence of deltorphin II fell well below the additive line, indicating a synergistic interaction. Error bars parallel to each axis represent the lower 95% CI for each compound. The error bars on the combined dose point represent the upper and lower 95% CIs. C, SP-elicited behavior was challenged by intrathecal administration of either deltorphin II (circles) or UK + P (squares) or both (triangles) in D79N mice. The combination treatment (100:1 molar agonist ratio) failed to shift the UK + P dose–response curve in D79N animals, even though deltorphin II was otherwise effective at those doses. The abscissa values for the combined treatment dose–response curves represent the dose of UK 14,304 in the presence of an equal potency ratio of deltorphin II. D, Isobolographic analysis was applied to data from Figure 5C. The ED50 values for the drugs given alone were 51 nmol (95% CI = 22–118) for UK + P and 0.33 nmol (95% CI = 0.20–0.57) for deltorphin II. The ED50 for UK + P when co-administered with deltorphin II was 12 nmol (95% CI = 8.6–17). The 95% CI of the combined ED50 fell within the lower confidence 95% CIs of the theoretical additive line, indicating that the interaction between these two compounds in D79N mice was not significantly different from additive. This study has been repeated blind with similar results (data not shown).
- Fig. 6.
Co-administration of UK 14,304 (+ 5 pmol prazosin) and DAMGO is synergistic in WT but not in D79N mice. A, SP-elicited behavior was challenged by intrathecal administration of either DAMGO or UK 14,305 + 5 pmol prazosin (UK + P) or both in WT mice. UK + P (squares) and DAMGO (circles) inhibited the behavior in a dose-dependent manner. When both UK 14,304 and DAMGO were co-administered, a constant potency ratio (10:1 molar agonist ratio) was maintained. The combination treatment (triangles), expressed in terms of UK + P, was ∼10-fold more potent than either drug given alone.B, Isobolographic analysis was applied to the data fromA as described in Figure 5. They-intercept represents the ED50 (0.09 nmol; 95% CI = 0.07–0.11) for UK + P, and thex-intercept represents the ED50 (0.006 nmol; 95% CI = 0.004–0.01) for DAMGO when each is administered alone for inhibition of SP-elicited behavior in WT mice. When the two compounds were co-administered in WT animals, the ED50 for UK + P in the presence of DAMGO (0.004 nmol; CI = 0.003–0.005) fell well below the additive line, indicating a synergistic interaction. C, SP-elicited behavior was challenged by intrathecal administration of either DAMGO (circles) or UK + P (squares) or both (triangles) in D79N mice. The combination treatment (10,000:1 molar agonist ratio) failed to shift the UK + P dose–response curve in D79N. Abscissa values for the combined treatment dose–response curves represent the dose of UK 14,304 in the presence of an equal potency ratio of DAMGO.D, Isobolographic analysis was applied to data fromC. The ED50 values for the drugs given alone in D79N mice were 97 nmol (95% CI = 52–180) for UK + P and 0.008 nmol (95% CI = 0.004–0.015) for DAMGO. The ED50 for UK + P when co-administered with DAMGO was 70 nmol (95% CI = 40–123). The 95% CI of the combined ED50 crossed the theoretical additive line, indicating that the interaction between these two compounds in D79N mice is not synergistic.
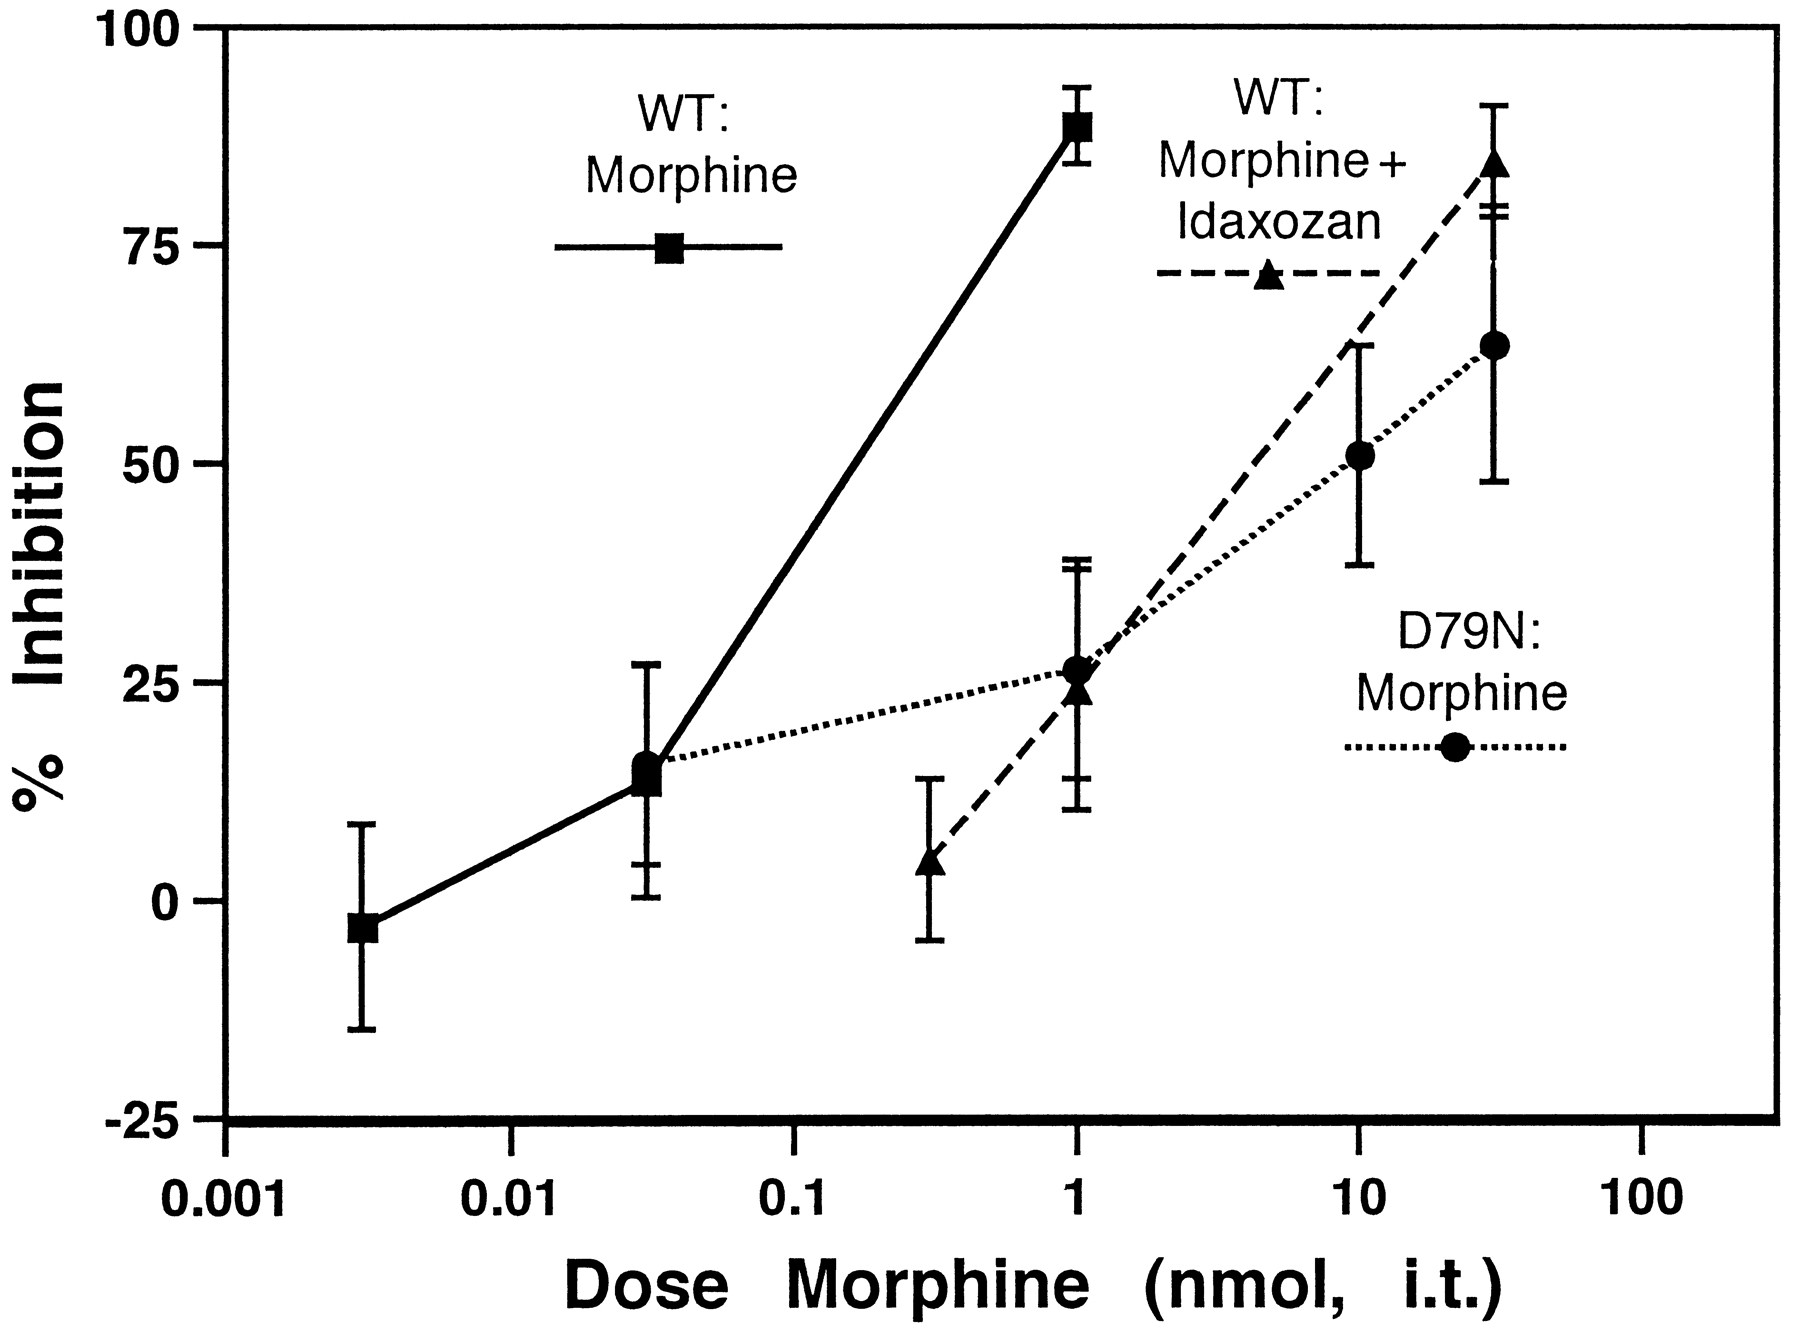
- Fig. 7.
Inhibition of SP-elicited behavior by morphine is reduced in D79N mice. Morphine potency (nmol, i.t.) is decreased in D79N animals (ED50 = 9.5 nmol; 95% CI = 1.4–62) as compared with WT animals (ED50 = 0.13 nmol; 95% CI = 0.05–0.30). This decrease in potency was mimicked by co-administration of the nonsubtype-selective α2AR antagonist idazoxan (ED50 = 4.2 nmol; 95% CI = 1.9–9.0). This result, together with those shown in Figures 5 and 6, suggests that a lack of synergy between descending noradrenergic and spinal opioid analgesia in D79N animals is mediating the decreased potency observed in the mutant mice. Supporting this conclusion, co-administration of idazoxan did not further alter the potency of morphine in D79N mice (ED50 = 0.83 nmol; 95% CI = 0.08–8.6). Error bars represent ±SEM for each dose point (n = 6–10 animals/dose).


