

Article Figures & Data
Figures
- Fig. 1.
Effects of 30 min perfusion with 300 μm NMDA through the microdialysis probe on extracellular Ach (A) and Cho (B) levels in prefrontal cortex. Symbols: □, control; ▪, NMDA. Basal levels (dialysate picomoles per microliter) and number of animals per group (mean ± SEM) were as follows: Ach, □, 0.0354 ± 0.0046 (n = 5); ▪, 0.0349 ± 0.0037 (n = 6); Cho, □, 1.6503 ± 0.2497 (n = 5); ▪, 2.1078 ± 0.4149 (n = 6). The horizontal barrepresents the period of NMDA perfusion.
- Fig. 2.
Effects of continuous perfusion with 300 μm NMDA through the microdialysis probe on extracellular Ach (A) and Cho (B) levels in prefrontal cortex: prevention by AP-5. Symbols: ▪, NMDA; ▾, AP-5; ▴, AP-5 + NMDA. Basal levels (dialysate picomoles per microliter) and number of animals per group (mean ± SEM) were as follows: Ach, ▪, 0.0376 ± 0.0039 (n = 6); ▾, 0.0341 ± 0.0059 (n = 4); ▴, 0.0275 ± 0.0025 (n = 4). Cho, ▪, 1.8928 ± 0.2959 (n = 6); ▾, 0.7028 ± 0.1246 (n = 4); ▴, 1.4444 ± 0.4496 (n = 4). Horizontal bars represent the period of continuous perfusion with NMDA or AP-5.
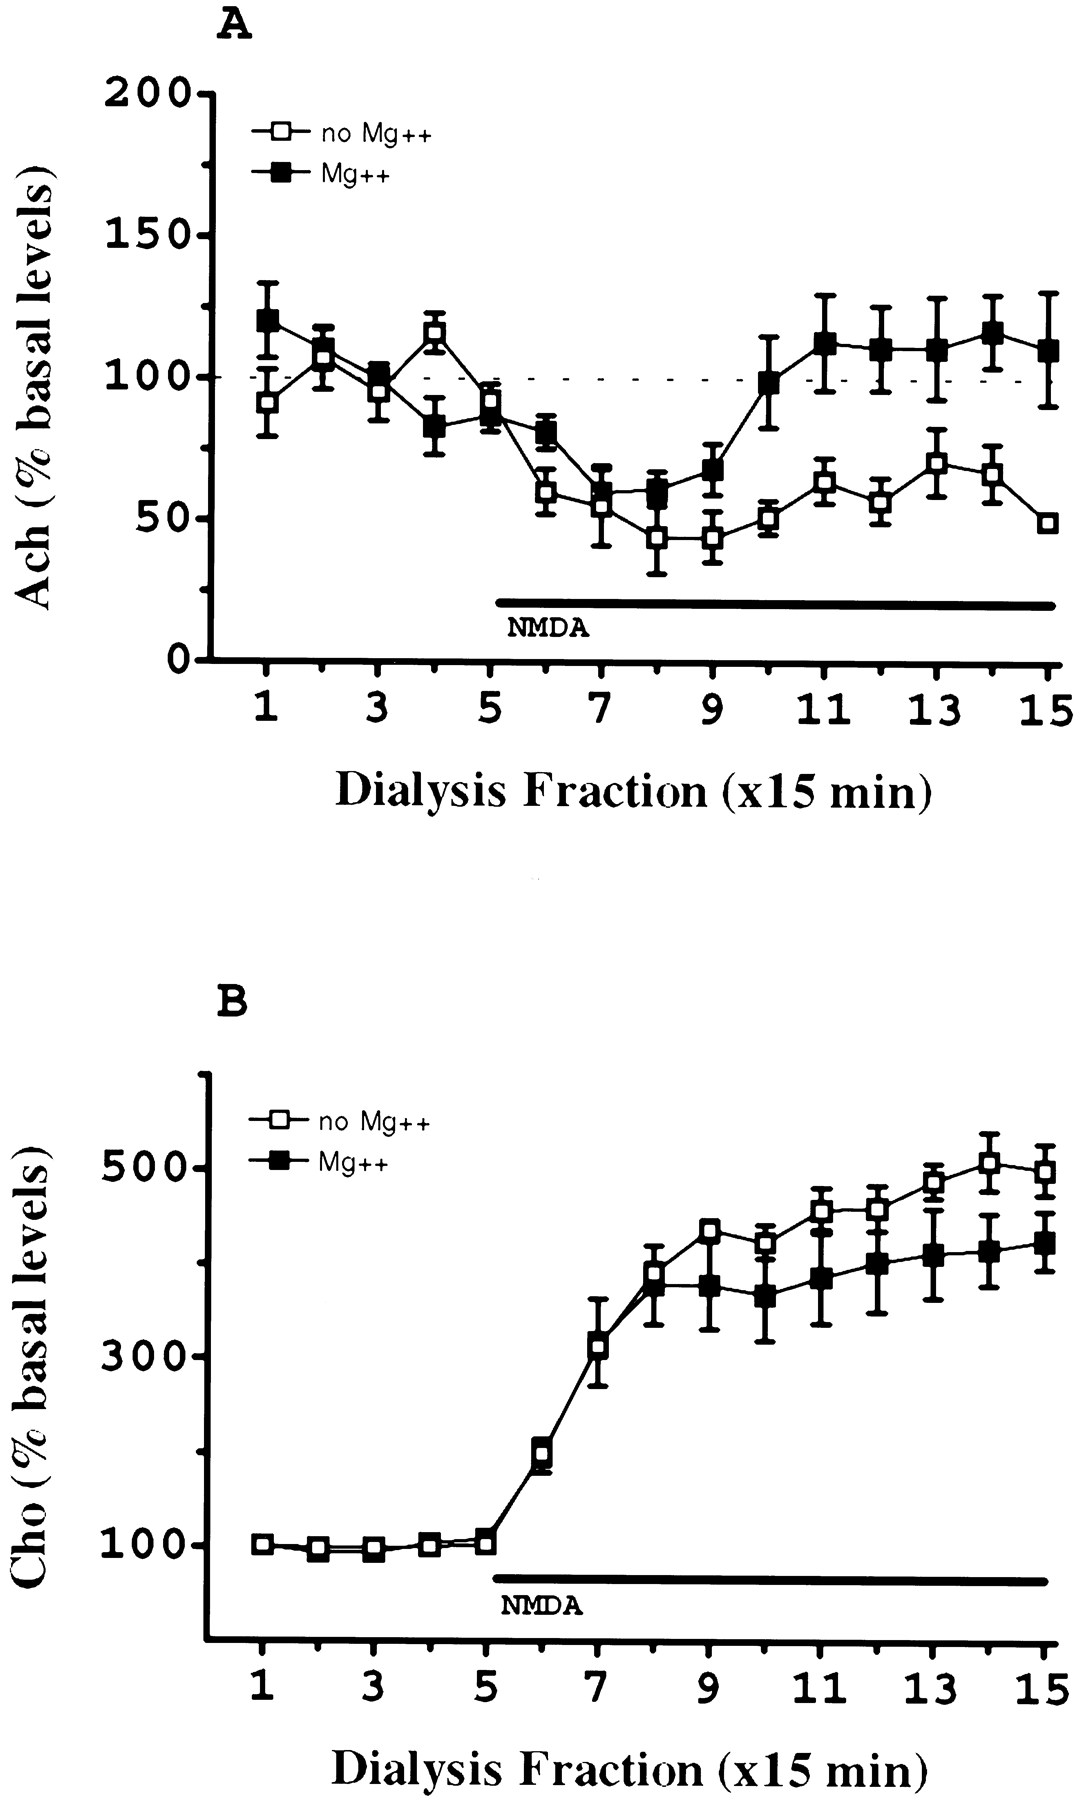
- Fig. 3.
Influence of the omission of Mg2+ in the perfusion fluid on the effects of continuous perfusion with 300 μm NMDA on dialysate Ach (A) and Cho (B) levels in prefrontal cortex. Symbols: ▪, Mg2+; □, no Mg2+. Basal levels (dialysate picomoles per microliter) and number of animals per group (mean ± SEM) were as follows: Cho, ▪, 1.67 ± 0.12 (n = 5); □, 1.50 ± 0.10 (n = 5); ACh, ▪, 0.0389 ± 0.005 (n = 5); □, 0.0500 ± 0.008 (n = 5). The horizontal barrepresents the period of NMDA perfusion.
- Fig. 4.
Effects of continuous perfusion with 300 μm NMDA through the microdialysis probe on extracellular Cho levels in prefrontal cortex: calcium dependence. Symbols: ▪, NMDA; ▴, no Ca2+ + NMDA; ▾, no Ca2+ + EGTA 5 mm + NMDA. Basal levels (dialysate picomoles per microliter) and number of animals per group (mean ± SEM were as follows: Cho, ▪, 1.5505 ± 0.1038 (n = 6); ▴, 1.8098 ± 0.3171 (n = 4); ▾, 3.3017 ± 0.3750 (n = 4). The horizontal barrepresents the period of NMDA perfusion.
- Fig. 5.
Effects of continuous perfusion with NMDA through the microdialysis probe on extracellular Ach (A) and Cho (B) levels in prefrontal cortex: dose–response. Symbols: ▪, control; ▵, NMDA 50 μm; ▿, NMDA 100 μm; ⋄, NMDA 300 μm; ○, NMDA 600 μm. Basal levels (dialysate picomoles per microliter) and number of animals per group (mean ± SEM) were as follows: Ach, ▪, 0.0354 ± 0.0046 (n = 5); ▵, 0.0416 ± 0.0186 (n = 3); ▿, 0.0410 ± 0.0054 (n = 5); ⋄, 0.0509 ± 0.0078 (n = 5); ○, 0.0420 ± 0.0052 (n = 3); Cho, ▪, 1.6503 ± 0.2497 (n = 5); ▵, 2.0743 ± 0.8061 (n = 3); ▿, 1.9570 ± 0.4533 (n = 5); ⋄, 1.4892 ± 0.1027 (n = 5); ○, 0.8294 ± 0.1501 (n = 3). The horizontal barrepresents the period of NMDA perfusion.
- Fig. 6.
Effects of continuous perfusion with 300 μm NMDA through the microdialysis probe on extracellular Ach (A) and Cho (B) levels in different brain areas. Symbols: ▪, prefrontal cortex; ▵, neostriatum; ▿, ventral hippocampus; ⋄, cerebellum. Basal levels (dialysate picomoles per microliter) and number of animals per group (mean ± SEM) were as follows: Ach, ▪, 0.0509 ± 0.0078 (n = 5); ▵, 0.0766 ± 0.0196 (n = 4); ▿, 0.0257 ± 0.0030 (n = 4); ⋄, below detectable range; Cho, ▪, 1.4892 ± 0.1027 (n = 5); ⋄, 1.0367 ± 0.1301 (n = 4); ▿, 0.7708 ± 0.0675 (n = 4); ⋄, 3.2175 ± 0.6227 (n = 5). The horizontal barrepresents the period of NMDA perfusion.
- Fig. 7.
Effects of continuous perfusion with 100 mm KCl through the microdialysis probe on extracellular Ach and Cho levels in prefrontal cortex. Symbols: ▪, Ach; ▴, Cho. Basal levels (dialysate picomoles per microliter) and number of animals per group (mean ± SEM) were as follows: Ach, 0.0479 ± 0.0054 (n = 6); Cho, 2.5981 ± 0.2860 (n = 6). The horizontal barrepresents the period of KCl perfusion.
- Fig. 8.
Effects of continuous perfusion with 300 μm NMDA for 2.5 hr on ChAT activity measured in a micropunch tissue sample taken around the microdialysis probe location in the prefrontal cortex. Tissue was dissected immediately after dialysis (0 d) or 7 d after. Data were expressed as percentage activity relative to the contralateral prefrontal cortex for each animal. No significant differences were found in both control (KRB-perfused) groups, and they were pooled for analysis. Number of animals: KRB (8), NMDA 0 d (4), NMDA 7 d (4). *, significantly different from the other two groups;p < 0.05, Student–Newman–Keuls.
- Fig. 9.
Effects of a prolonged perfusion with 600 μm NMDA for 12 hr on dialysate Cho levels. Symbols: □, control perfusion with KRB (n = 6); ▪, NMDA (600 μm) perfusion (n = 10).Inset: Content of Cho in the lipid fraction of a micropunch tissue sample taken around the microdialysis probe location in the prefrontal cortex after perfusion with NMDA (600 μm) for 12 hr. Tissue was dissected immediately after dialysis. Data were expressed as percentage relative to the contralateral prefrontal cortex for each animal. Cho content in the lipid fraction expressed in nanomoles per milligram of wet weight was as follows: controls (n = 6), contralateral side = 14 ± 1, probe side 13 ± 1; NMDA treatment (n = 10), contralateral side = 16 ± 1, probe side 10 ± 0.5. *, significantly different from control group; p < 0.05, Student–Newman–Keuls.
- Fig. 10.
Effect of mepacrine on NMDA-induced dialysate Ach (A) and Cho (B). Mepacrine was perfused for 30 min before NMDA. Pilot experiments showed that mepacrine passed through the dialysis membrane. NMDA (300 μm) and mepacrine (300 μm) were co-perfused in prefrontal cortex for 1.25 hr. Symbols: ▪, perfusion with NMDA (300 μm); ▵, perfusion with mepacrine (300 μm); ○, perfusion with NMDA (300 μm) + mepacrine (300 μm). Basal levels of Ach (dialysate picomoles per microliter) and number of animals per group (mean ± SEM) were as follows: ▪, 0.0558 ± 0.0069 (n= 4); ▵, 0.0455 ± 0.0083 (n = 3); ○, 0.0578 ± 0.0087 (n = 4). Basal levels of Cho (dialysate picomoles per microliter) and number of animals per group (mean ± SEM) were as follows: ▪, 0.9593 ± 0.1478 (n = 4); ▵, 1.3475 ± 0.0904 (n = 3); ○, 1.3200 ± 0.2788 (n = 4). Horizontal bars represent period of drug perfusion.


