

Article Figures & Data
Figures
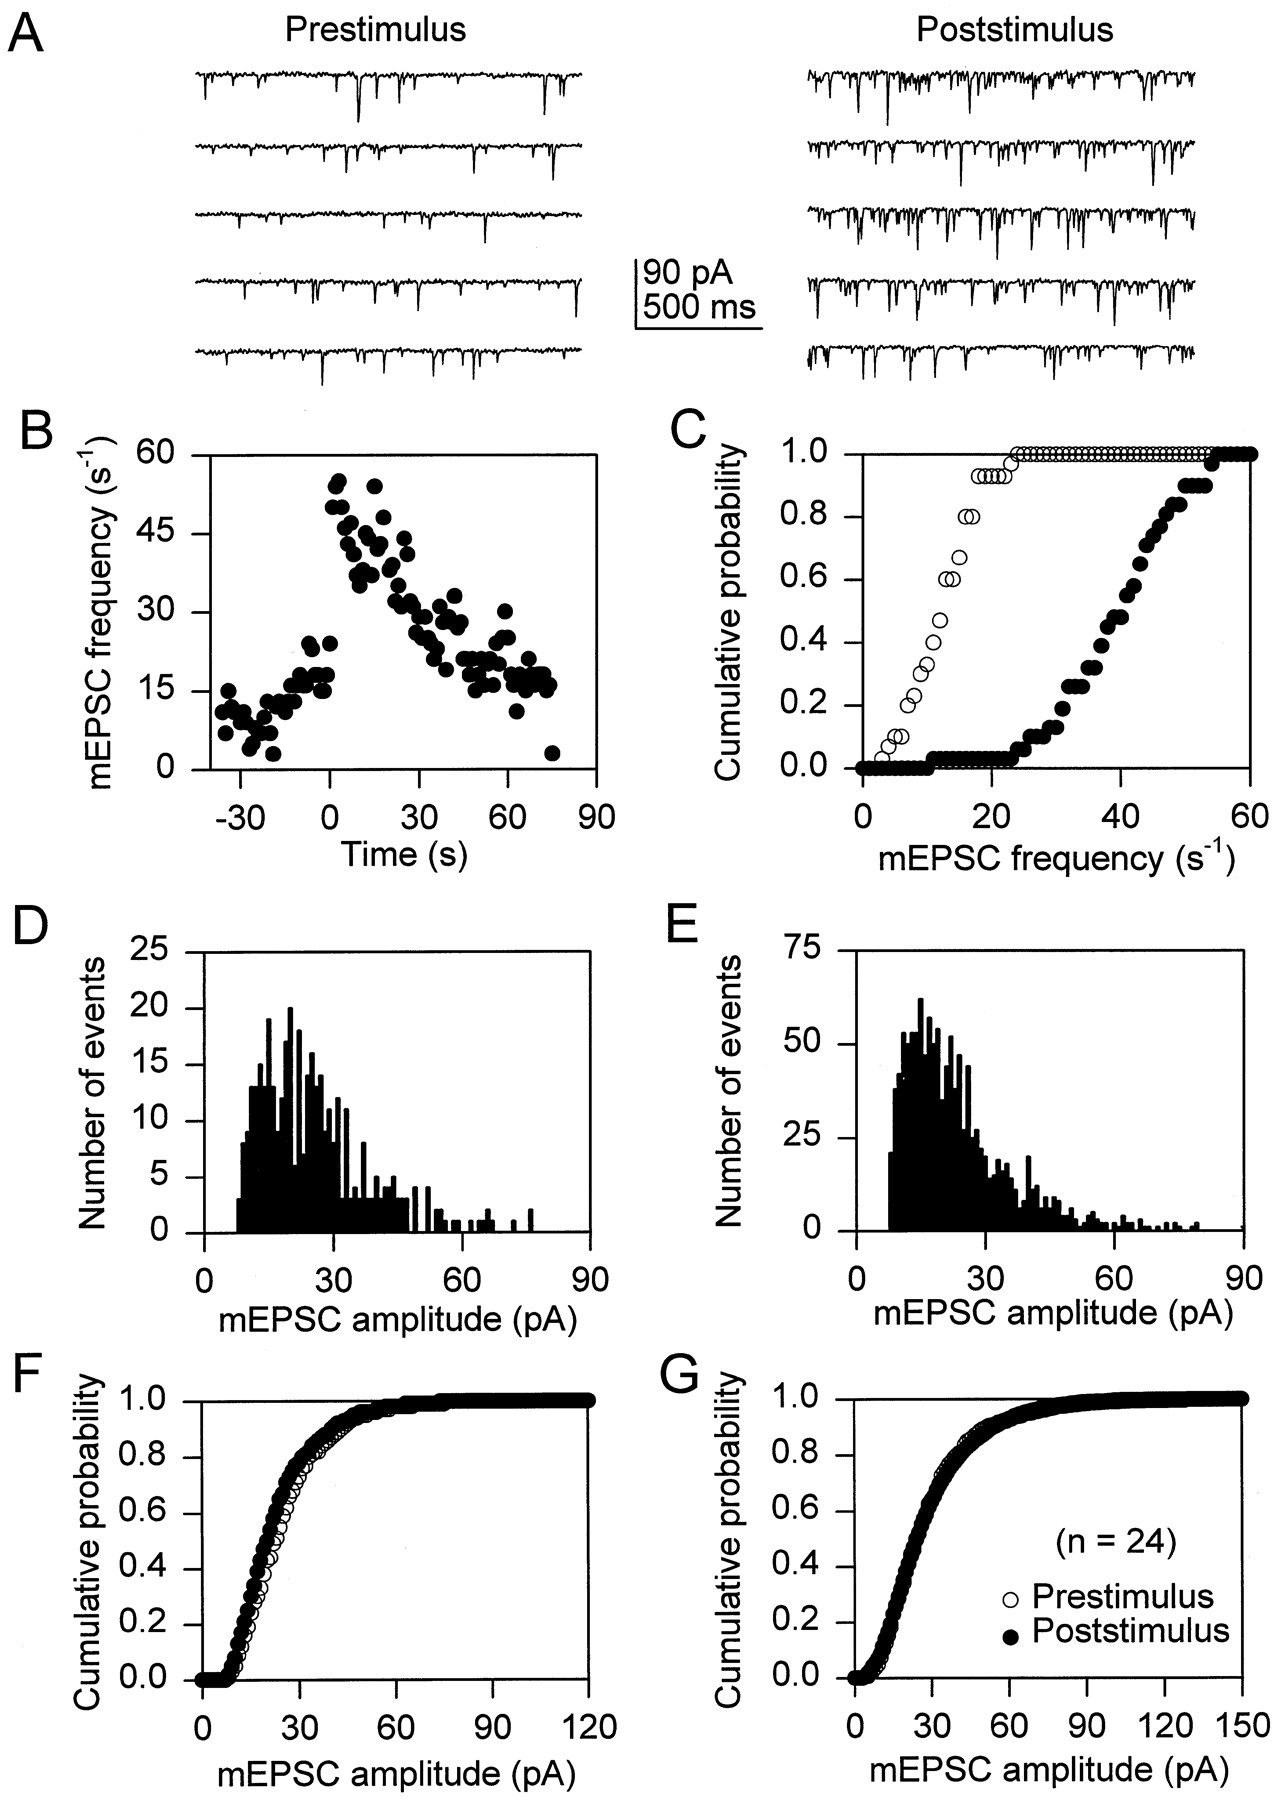
- Fig. 1.
Astrocyte stimulation increases mEPSC frequency. A, mEPSCs recorded at a holding potential of −60 mV before and after mechanical stimulation of an astrocyte.B, Time course of the mEPSC frequency calculated in 1 sec bins. Zero time corresponds to the time of astrocyte stimulation.C, Cumulative probability plot of the mEPSC frequency 30 sec before and after astrocyte stimulation (open andfilled symbols, respectively). D,E, Histograms of mEPSC amplitudes (bin width, 1 pA) recorded 30 sec before and after astrocyte stimulation, respectively.F, Cumulative probability plot of the mEPSC amplitudes recorded 30 sec before and after astrocyte stimulation (open and filled symbols, respectively).G, Average (n = 24) cumulative probability plot of the mEPSC amplitudes recorded 30 sec before and after astrocyte stimulation (open and filled symbols, respectively). Error bars showing SEM are smaller than symbol size. To obtain cumulative probability plots, we calculated the frequency and the amplitudes of mEPSCs in 1 sec and 1 pA bins, respectively.
- Fig. 3.
Microinjection of the Ca2+chelator BAPTA into an astrocyte prevents the propagation of astrocyte Ca2+ waves and blocks the astrocyte-induced increase in mPSC frequency. A, Cultures were loaded with the Ca2+ indicator fluo-3 to monitor the stimulus-induced Ca2+ elevations in astrocytes, and a single astrocyte was microinjected with fluoro-ruby (left panel). Right panels show images in pseudocolor mode representing intensity of fluo-3 emission taken before, during, and after mechanical stimulation of the fluoro-ruby-injected cell at the times indicated. Zero time corresponds to the time of astrocyte stimulation. Mechanical stimulation increases intracellular Ca2+ in the injected cell as well as in neighboring unstimulated astrocytes. B, Same as inA but with a single astrocyte microinjected with fluoro-ruby and BAPTA (left panel). Mechanical stimulation of the injected cell did not change the fluorescent emission of fluo-3 either in the stimulated or neighboring astrocytes.C, D, Quantitative data taken from these experiments. The number of astrocytes involved in Ca2+ waves was quantified by the proportion of nonstimulated cells within the field of view that responded with a Ca2+ elevation. Although the ability of astrocytes to respond to direct stimulation or to evoke Ca2+waves (C and D, respectively) was unaffected by the injection of fluoro-ruby, it was reduced significantly by BAPTA injection. In parallel studies mPSCs were recorded in response to mechanical stimulation of astrocytes. Whereas the astrocyte-induced mPSC frequency increase was not affected by the injection of fluoro-ruby (E, F), it was prevented by the injection of BAPTA (E,G). **p < 0.01.
- Fig. 4.
Ca2+ elevation in astrocytes is sufficient to increase the frequency of mPSCs. A, Whole-cell recording from a neuron adjacent to an astrocyte that had been microinjected with the UV-sensitive Ca2+ cage NP-EGTA. UV photolysis (arrow) increased the Ca2+ level in the astrocyte and caused an increase in the frequency of mEPSCs. B, Graphs summarizing the effects of photolysis on the mEPSC and mIPSC frequency. Pulses of UV light only increased the frequency of mPSCS when the astrocyte was injected with NP-EGTA. Although the frequency of mPSCs was not modified by UV stimulation of uninjected astrocytes (0 of 6 cells) or astrocytes injected with fluoro-ruby alone (0 of 22 cells), photolysis of NP-EGTA-injected astrocytes increased the frequency of mEPSCs (8 of 17 cells) and mIPSCs (4 of 9 cells). This photolysis-dependent increase in mPSC frequency was prevented by incubation with 50 μm AP5 (0 of 12 NP-EGTA-injected astrocytes).
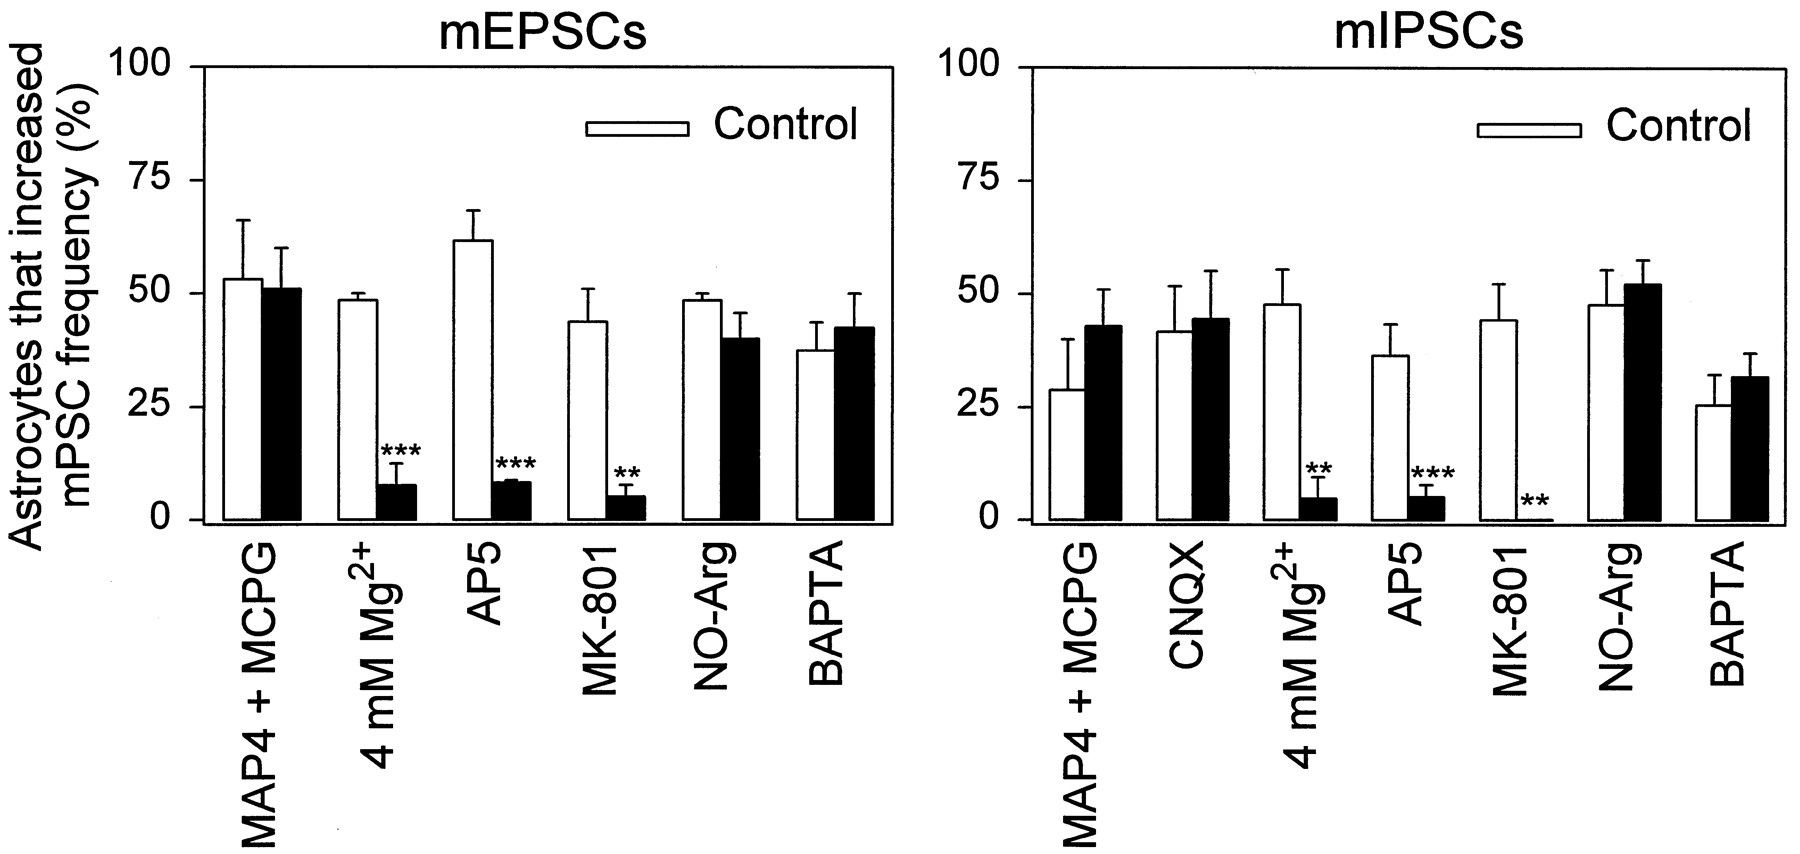
- Fig. 5.
Astrocyte-induced increase in mPSC frequency is mediated by NMDA receptors. Shown is the percentage of mechanically stimulated astrocytes that increased the frequency of mEPSCs (left) and mIPSCs (right) in 0.5 mm MAP4 and 0.5 mm MCPG, 10 μmCNQX, 4 mm Mg2+, 50 μmAP5, and 50 μm NO-Arg; also shown is the percentage after dialysis of the postsynaptic cell with BAPTA (10 mm in the recording pipette) and in their respective control solution in parallel cultures. In the histograms labeled MK-801 we caused a use-dependent block of NMDA receptors before stimulating astrocytes by incubating the cultures during 5 min in NMDA (200 μm) and MK-801 (5 μm) to cause a sustained block of this receptor subtype (see Results). After washout, astrocyte stimulation no longer modulated mPSC frequency. Significant differences with respect to control were established by the Student’s t test at **p < 0.01; ***p < 0.001.
- Fig. 6.
AP5-sensitive astrocyte-induced increase in mPSC frequency is not mediated by synaptic NMDA receptors.A, mPSCs recorded at a holding potential of −60 mV in control solution (left). To block postsynaptic NMDA receptors, we added MK-801 to the saline while the synaptic release of glutamate was stimulated by the pressure ejection of high osmolarity saline (center). Several 1- to 50-sec-duration pressure pulses of high osmolarity solution (obtained by the addition of 0.3m sucrose to the standard saline) were delivered, but only one is shown. Subsequently, MK-801 was washed out of the saline.Right, mPSCs recorded at a holding potential of −30 mV after the blockage of postsynaptic NMDA receptors with MK-801. Thetrace has been offset for illustration purposes. Mechanical stimulation of the astrocyte is indicated by theasterisk. Note that, despite the selective block of synaptic NMDA receptors, the stimulation of astrocytes still evoked an increase in the frequency of mPSCs. B, Averaged (n > 50) mEPSCs (dotted lines) in control solution and in MK-801 after several pressure pulses of high osmolarity solution. Synaptic activation with high osmolarity saline blocked postsynaptic NMDA receptors, because mEPSCs now exhibited only one time constant of decay. The decay time course of mEPSCs was fit to two and to a single exponential function in control and after MK-801 treatment, respectively (continuous lines).C, Proportion of astrocytes in which mechanical stimulation evoked an increase in the frequency of mEPSCs (left) and mIPSCs (right) in control solution and after the blockage of synaptic NMDA receptors with MK-801 and high osmolarity saline in the absence and in the presence of 50 μm AP5. **p < 0.01.


