

Article Figures & Data
Figures
- Fig. 1.
Unbinding from the GABAA receptor is agonist-specific, but gating is not. A, When brief (5 msec) and saturating agonist pulses were applied to outside-out patches, the time course of current decay (deactivation) depended on the agonist used. Pulses of GABA (10 mm) and either muscimol (10 mm) or β-alanine (100 mm) were alternated on a single patch. The lower traces are the averages of more than five records. The top traces are the liquid junction currents recorded at the open pipette tip at the end of the experiment and illustrate the speed of solution exchange. Piezoelectrical artifacts have been blanked. B, The amplitudes and time courses (desensitization) of currents during long (505 msec) pulses of GABA, muscimol, or β-alanine were indistinguishable from each other, suggesting that channel gating is similar across different agonists. However, the deactivation time course after agonist removal was agonist-specific, suggesting that the rate of return to the unbound state depends on agonist structure.
- Fig. 2.
Agonists span a wide range of affinities.A, Whole-cell currents were evoked by submaximal and maximal applications of agonists, at the concentrations shownabove the traces. The horizontal lines show the duration of agonist application.B, Concentration-response data from experiments like those shown in A were fit to the normalized form of the Hill equation: I/Imax = 1/(KH /[A]N+ 1) (Segel, 1976). I/Imax is the fraction of the maximal current, N is the number of agonist binding sites per receptor, and KH is a constant reflecting both the concentration at the half-maximal response and the degree of cooperativity between sites. Note thatKH must be expressed as a concentration raised to the power of N for units to balance. The fitted parameters are given in the text. C, A more precise estimate of EC50 was obtained by alternating approximately half-maximal (giving between 45 and 55% of the maximal peak current) and maximal concentrations at outside-out patches. The differences in desensitization kinetics reflect patch-to-patch variability and were not statistically significant (see Fig.1B). The upper traces are the liquid junction currents.
- Fig. 3.
Agonist unbinding rates contribute to deactivation and affinity. A, A previously established kinetic model was modified and used to estimate the microscopic unbinding rate constants for different agonists. The development and performance of the model are described in detail in Jones and Westbrook (1995,1997). B, Agonist-specific patch current deactivation (noisy lines) can be simulated (smooth lines) solely by changes in the unbinding rate. The model was optimized to fit 5 and 505 msec saturating GABA pulses and was then allowed to fit the deactivation phases for different agonists with only the unbinding rate (koff) as a free parameter. Records were averaged, normalized to the same maximum open probability (Po ) (Jones and Westbrook, 1995, 1997), and aligned at the peak. The rates were (in sec−1)kon = 5 × 10⁶m−1, α1 = 1100, β1= 200, α2 = 142, β2 = 2500,d1 = 13, r1 = 0.2, d2 = 1250,r2 = 25, p = 2, andq = 10−2m−1. The asterisk denotes a net counterclockwise motion at steady state (see Materials and Methods). The best-fitting unbinding rates were (in sec−1) 40 for muscimol, 131 for GABA, 1125 for THIP, and 4500 for β-alanine.C, D, The unbinding rate was closely correlated with both the patch-current deactivation rate (C) and the apparent affinity (D). Unbinding rates from fitting 5 msec (closed circles and solid line) and 505 msec (open circles and dashed line) pulse responses are shown with SEM bars for the y-axis and 95% confidence limits of the fit for the x-axis. InC, the lines are regression fits to the power function: 1/τ =akoffb, wherea was 0.56 and b was 0.61 for 5 msec pulses and a was 0.90 and b was 0.53 for 505 msec pulses. In D, EC50 =akoffb, wherea was 1.5 × 10⁻⁷ andb was 1.18 for 5 msec pulses and a was 3.2 × 10⁻⁷ and b was 1.05 for 505 msec pulses.
- Fig. 4.
GABA and β-alanine bind at different rates relative to SR-95531. A, Simultaneous application of equal concentrations of GABA and SR-95531 activates 11% of the patch current evoked by GABA alone, suggesting that the antagonist occupied many receptors before GABA could bind. B, Simultaneous application of β-alanine at a concentration a thousand times higher than that of SR-95531 activates only 28% of the current evoked by β-alanine alone, suggesting that β-alanine binds much more slowly than GABA, relative to SR-95531.
- Fig. 5.
The concentration and time dependence of block by SR-95531. A, The equilibration time course of SR-95531 in the absence of GABA was measured in outside-out patches. Thetop traces are the liquid junction currents measured at the open pipette tip after the experiment. After a brief pulse of saturating GABA to assay the channel availability, the patch was exposed to SR-95531 for a variable interval after which channel availability was assayed with a second GABA test pulse.B, The response to the test pulse from A, on an expanded time scale, shows that channel availability declined with increasing durations of SR-95531 exposure. C, Plots of channel availability versus the duration of SR-95531 exposure reveal that the rate and extent of block increase with antagonist concentration. The data for each concentration were fit to the equation: Availability = (1 − [Pn∞ − (Pn∞ −Pn0)e−t/τ])N(see Eqs. 2, 9), with Pn0 constrained to 1 and N constrained to be an integer. The parametersPn∞ and τ contain information about the microscopic binding and unbinding rates (see Fig. 6). In this and all subsequent figures, the pooled data have been corrected for any unbinding of SR-95531 that occurs during the agonist pulse according to the equation: Icorr = (Ferr −Iobs) / (Ferr − 1).Icorr is the corrected current,Iobs is the observed current, andFerr is the fractional unbinding that would occur over the length of the agonist pulse if all channels were initially bound with antagonist (see Fig. 7).
- Fig. 6.
SR-95531 appears to bind at a single site.A, The block at steady state (filled circles) from Figure 5 is plotted here versus SR-95531 concentration and suggests a single antagonist binding site. The data were fit to the normalized Hill equation:I/Imax = 1 − [1/(KH /[A]N+ 1)], in which N could be constrained to be an integer (solid line, N = 1; dashed lines, N = 2, 3, or unconstrained). The best fit occurred with N ≅ 1, yieldingKN = Kn = 216 nm. The inset shows the increasing error of the fit (χ2) as the assumed number of binding sites departs from 1. The circles are with Nconstrained, whereas the triangle is withN as a free parameter and occurs nearN = 1. B, To extractkon and koff from the onset time course of SR-95531 block (Fig. 5C), we plotted the reciprocal of the fitted time constant 1/τ versus the SR-95531 concentration, for fits in which N was constrained to be 1 (filled circles), 2 (open circles), or 3 (diamonds). These plots yield straight lines with slope equal tokon and intercept equal tokoff (Eq. 8). The table of the best fit values (inset) shows that the estimates ofkon and koff vary less than twofold between one and three assumed sites.
- Fig. 7.
Direct measurement of the SR-95531 unbinding rate.A, The SR-95531 unbinding time course was measured directly by pre-equilibrating a patch in a saturating antagonist concentration (10 μm) and measuring the channel availability with saturating (10 mm) GABA pulses at a variable interval after antagonist removal. The top traces are the open tip currents. The lower traces show the increasing channel availability at increasing intervals after SR-95531 is removed. B, A plot of availability versus the SR-95531 unbinding interval was fit to the same equation given in the legend to Figure 5C, withPn0 constrained to 0,Pn∞ constrained to 1, andN unconstrained or constrained to be an integer. Thesolid line is the fit for N = 1. Values of N > 1 produce a sigmoidal rising phase (dashed lines) because multiple antagonist molecules would need to unbind before the channel becomes available. However, the error of the fit increased as the number of sites assumed departed from 1 (inset; filled circles). The triangle represents the fit with N unconstrained, which occurred withN essentially equal to 1 and yielded an unbinding rate of koff = 1/τ = 9.1 sec−1, near the value obtained in Figure 6.
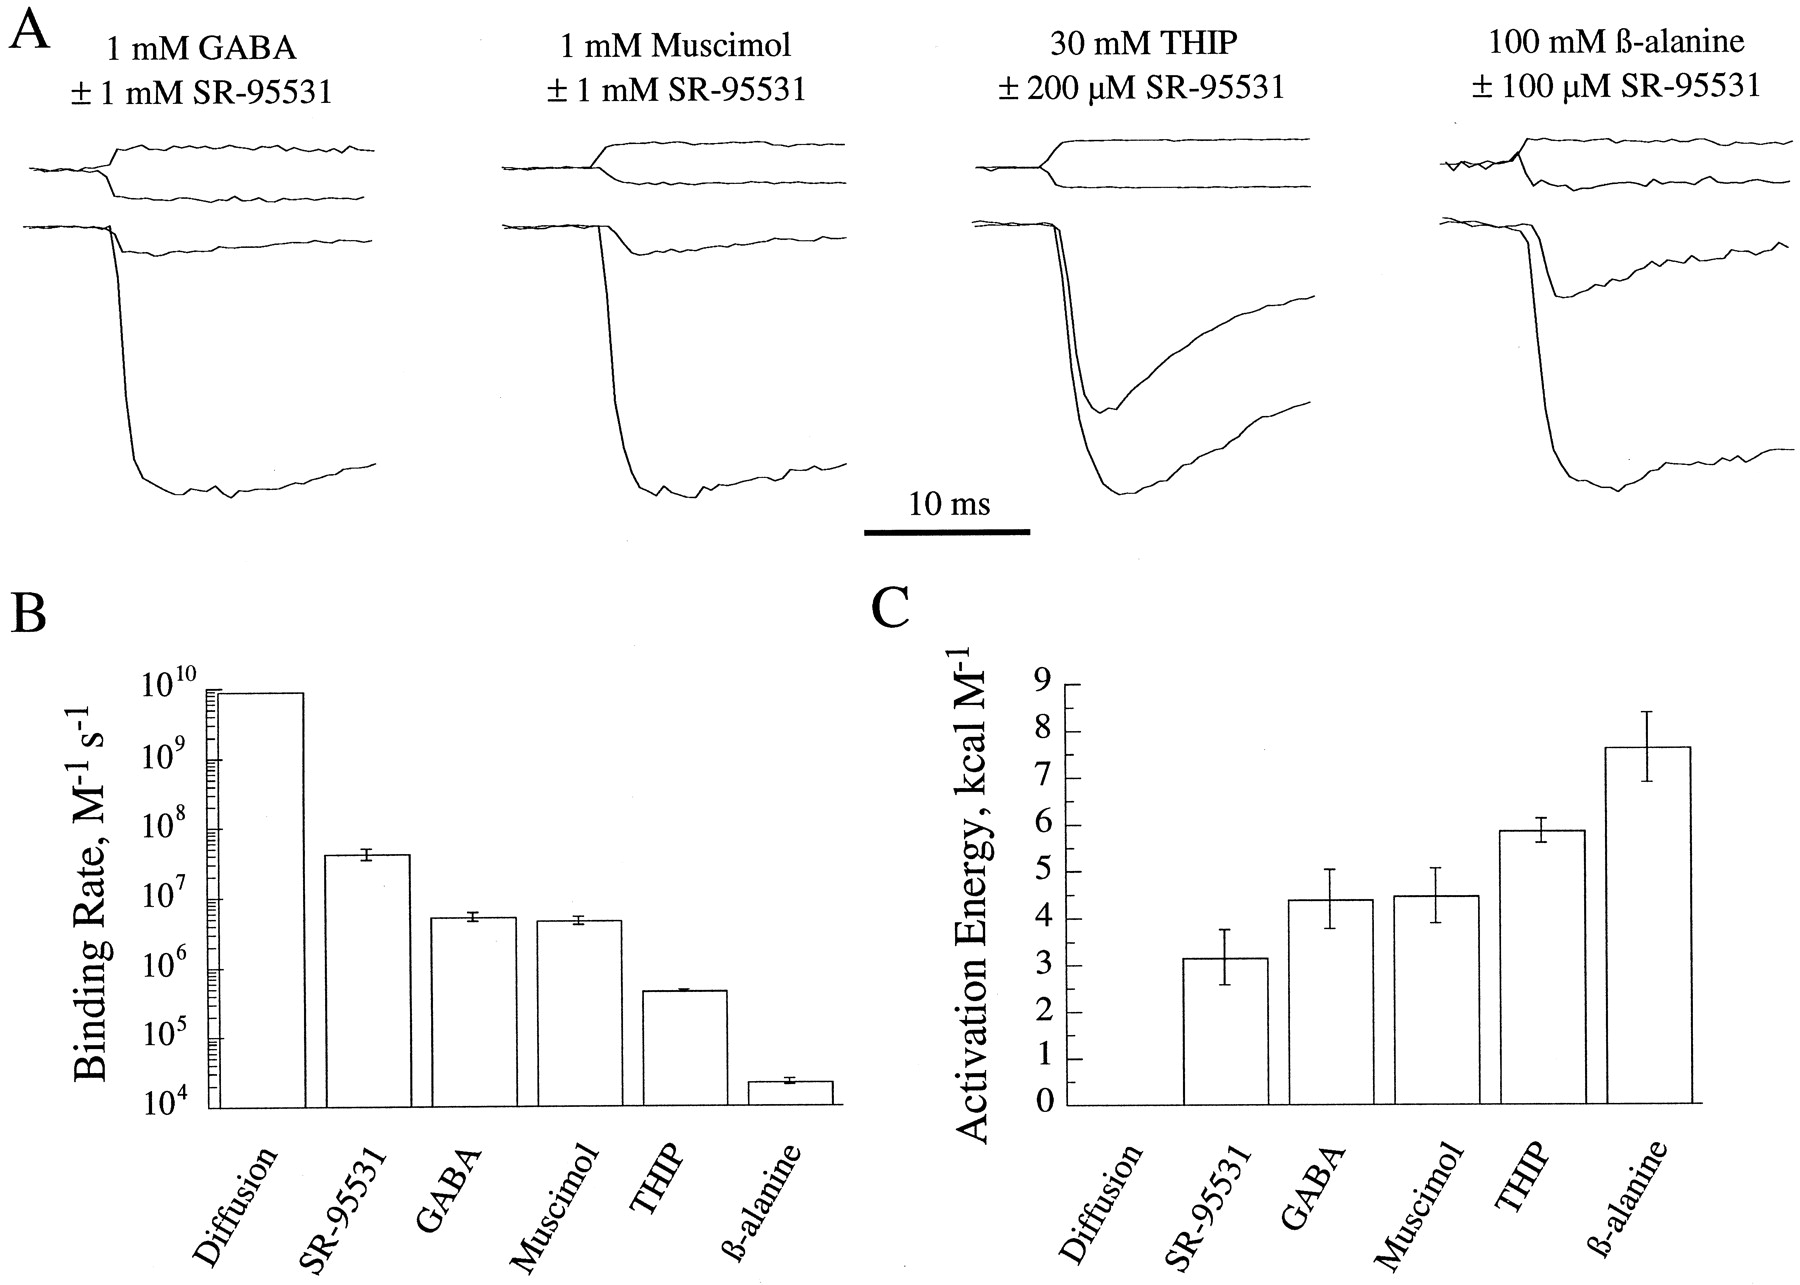
- Fig. 8.
Agonist binding rates are limited by an activation energy barrier. A, Agonist binding rates were measured by examining the instantaneous competition between agonists and SR-95531. Applications of agonist alone and agonist plus SR-95531 were alternated on the same patch, and responses for each condition were averaged. The top traces are the open tip currents.B, Agonist binding rates were calculated from the ratio of peak currents in the presence and absence of antagonist (Eq. 12). The rate for SR-95531 is from Figure 6B forN = 1, and the rate for a hypothetical agonist with diffusion-limited binding was calculated from Equation 13. All ligands tested had binding rates orders of magnitude slower than diffusion, and these rates were strongly agonist-specific. C, The ratio of ligand binding rates to the diffusion-limited rate was used to calculate the height of an activation energy barrier between the unbound and bound states using the Arrhenius equation (Eq. 14). As the height of this barrier increases, the binding rate decreases.
- Fig. 9.
The energy barrier between unbound and bound states defines affinity and deactivation kinetics. A, A plot of the predicted diffusion-limited binding rate and the actual binding and unbinding rates versus the affinity constant reveals that differences in affinity between ligands are related to differences in both binding and unbinding. However, binding rates were more steeply correlated with affinity than were unbinding rates. Thelines are regression fits to the power function:k =aC50b, wherea was 1528 and b was −0.69 forkon, a was 84786 andb was 0.61 for koff, and a was 9.1 × 10⁹ andb was 0 for kdiff.B, The directly measured macroscopic EC50values (triangles) (IC50 for the antagonist) and the kinetically estimated microscopic affinity constants (circles) both increase with the height of the energy barrier between the unbound and bound states. The deviation between the two curves is expected because unbinding rates are faster for lower microscopic affinities, allowing gating steps to become rate limiting in determining the macroscopic EC50. The small squares on the y-axis are the affinities predicted for the measured unbinding rates if diffusion-limited binding is assumed. The solid line is the linear regression to the microscopic values, with a slope of 1.3 and an intercept of −10.8, suggesting a theoretical maximum limit for GABAA receptor affinity of 15 pm. C, Both affinity and kinetics can be understood in terms of an energy barrier between the unbound and bound states. The energy of the ligand-receptor system is plotted as a function of affinity and a reaction coordinate that measures the progress of the binding (or unbinding) reaction. As a ligand undergoes binding, it travels along an energy surface fromleft to right (thick dark lines). A diffusion-limited ligand faces no energy barrier to binding (from I to II) but faces a large barrier in the reverse direction. Such a ligand would bind quickly, unbind slowly, and thus have the highest possible affinity. Lower affinity agonists such as β-alanine face a larger energy barrier to binding (from III to IV) but a smaller barrier to unbinding. The solid linesdescribe an empirically chosen surface fitted to the data: Energy = a(EC50 + 0.2)(bF6)(0.5 +F2)−1 + (EC50 + 10)(c−0.2−2(F− 0.5)2), where F is the fractional progress from unbound to bound and a,b, and c are fitting constants. All energies are with reference to that of the unbound state (0 kcalm−1), and the transition state is arbitrarily placed halfway through the reaction.
- Fig. 10.
Affinity is correlated with ligand length.A, The chemical structures of the ligands used in our experiments are arranged in order of decreasing binding rate fromleft to right. For each ligand, the length of the GABA-like region is given below the structure (as measured from the nitrogen to the hydroxyl oxygen in the most energetically favorable conformation; see Materials and Methods).B, A plot of ligand affinity [i.e., log(Kn )] versus the length of the GABA-like region reveals a strong linear correlation, suggesting a length-based selectivity mechanism for the GABA binding site. Theupper equation (solid line) is the regression for the four agonists. The lower equation(dashed line) is the regression for all five ligands.
- Fig. 11.
A flexible binding-site model can account for agonist selectivity. A, A flexible binding site can be envisioned as a pair of binding arms anchored to the rest of the protein by spring-like tethers. At rest, the arms are widely spaced (top), whereas they must move closer together to secure an agonist within the binding site (bottom). This movement requires energy, symbolized by stretching the springs.B, A flexible-site model was implemented by calculating the profile of energy wells from the Lennard–Jones equation (see Materials and Methods) for interactions between three kinds of particle: the anchors (out of view to the left andright), the movable arms (filled circles), and the agonist endpoints (open circles). The y-axis measures the energy experienced by each particle. The x-axis measures the distance from the center of the binding site. Only the left half of the symmetrical system is shown here, and for clarity the repulsive energy components are not displayed. Simulations were initialized with the arm particle resting in the well generated by the anchor (at −4.4 Å). The arm itselfgenerates a secondary well (thegray well at −3.65Å) that will bind the agonist. The agonist is centered in the binding site but is not secured at the bottom of a well in the unbound state (one endpoint is shown by the graycircles; the other is out of view to the right). As binding proceeds, the arm moves closer to the agonist (arrow at a), which requires energy because it involves climbing out of a well. The highest energy occurs partway through the movement, when neither the arm nor the agonist are in a well (i.e., the transition state,stippled lines and circles). Binding is complete when the agonist falls to the bottom of the well generated by the approaching arm (arrow at b,black lines and circles). The reaction energy can be divided approximately into activation energy expended by the agonist in lifting the arm from its rest level and deactivation energy gained by the agonist as it sinks into the binding well. The difference between these energies is exponentially related to the probability that the agonist will be found in the bound state and thus determines affinity. C, The graph shows the energy surface predicted by the model to account for the kinetics of agonist selectivity and is thus a reinterpretation of the kinetic data of Figure 9C in structural terms. The progress of the reaction is represented here by the fractional arm movement [multiply by (3.6 Å − 0.5 × agonist length) for the actual movement], and the agonist length has been substituted for the affinity constant. The model was optimized by iteratively varying the site lengthLsite, the well depths ε, and the well radii reqm to minimize the error between the experimental data (circles) and the model prediction (solid lines). The best-fitting parameters gave excellent agreement with the experimental data (root mean-squared error = 0.41 kcal m−1) and wereLsite = 14.2 Å;reqm = 2.65 Å and ε = 6.04 kcalm−1 for the anchors; andreqm = 0.82 Å and ε = 5.50 kcalm−1 for the arms (∼7.2 Å between arm energy wells at rest). Note that unlike the empirical surface used in Figure9C, the curvature and position of barrier peaks for this theoretical surface vary with agonist length.


