

Abstract
Oxytocin (OT) and vasopressin (VP) release from the neurohypophysis are correlated with the electrical activity of magnocellular cells (MNCs) in the supraoptic (SON) and paraventricular nuclei. Synaptic inputs to MNCs influence their electrical activity and, hence, hormone release. During lactation OT neurons display a synchronized high-frequency bursting activity preceding each milk ejection. In parallel to the adoption of this pattern of electrical activity, an ultrastructural reorganization of the SON has been observed during lactation. In the present study we performed a light microscopic, morphometric analysis of identified OT and VP neurons in the SON to determine whether the dendrites of these neurons participate in the plasticity observed during lactation. The dendritic trees of OT neurons shrunk during lactation (∼41% decrease in the total dendritic length) because of a decreased dendritic branching concentrated at a distance of 100–200 μm from the soma. No changes in the maximal distal extension were observed. The distribution pattern of dendritic length into branch orders also was affected. Strikingly, opposite effects were observed in VP neurons. The dendritic trees during lactation elongated (∼48% increase in the total dendritic length) because of an increased branching close to the soma. No changes in the maximal distal extension were observed. These results indicate that the length and geometry of the dendritic trees of OT and VP neurons are altered in opposite ways during lactation. These changes would influence the availability of postsynaptic space and alter the electrotonic properties of the neurons, affecting the efficacy of synaptic inputs.
The hypothalamic supraoptic nucleus (SON) contains magnocellular neurosecretory cells (MNCs) that synthesize the neurohypophysial hormones oxytocin (OT) and vasopressin (VP). These neurons send their axons to the neural lobe, where hormones are carried by anterograde axonal transport and released in response to physiological stimuli such as dehydration, parturition, and lactation.
A morphological plasticity has been observed in the SON during conditions of high hormonal demand (for review, see Hatton, 1990;Theodosis and Poulain, 1993). These dynamic changes include both neuronal–glial remodeling as well as synaptic rearrangement. An increase in the amount of somasomatic apposition, dendritic bundling, double synapses, and dye-coupling has been observed in SON neurons during late pregnancy, parturition, and lactation (Hatton et al., 1987;Hatton, 1990). These changes occur on a minute-to-hour time scale and reverse on the removal of the activating stimuli. Furthermore, a rearrangement of SON synaptic inputs involving an increment of both GABAergic (Gies and Theodosis, 1994) and glutamatergic innervation (El Majdoubi et al., 1996) also has been described, yet it has not been investigated in detail whether the dendritic trees of MNCs also undergo plastic changes during lactation. Changes in the size and branching patterns of the dendritic trees could effectively alter the electrotonic and thus the integrative properties of MNCs and also would place limitations on the available postsynaptic space.
The objectives of the present study were to characterize quantitatively the dendritic trees of SON OT and VP neurons to determine whether their structure is altered during lactation. Neurons from virgin diestrous and lactating rats were recorded with intracellular electrodes, labeled with neurobiotin, and reconstructed in three dimensions for morphometric analysis. Our results indicate that significant and opposite changes were observed in OT and VP neurons: the dendritic arborization was reduced and enlarged in OT and VP neurons, respectively, during lactation. How these changes might affect the integrative properties and the physiological responses of these neurons is discussed.
Some of these results have appeared in abstract form (Stern and Armstrong, 1996b).
MATERIALS AND METHODS
Explant preparation. Female virgin diestrous rats (assessed by vaginal smear the morning of the experiment) and lactating albino rats (200–390 gm; Holtzman, Harlan Laboratories, Indianapolis, IN) that had suckled at least 10 pups for 8–14 d were used as subjects. The rats were anesthetized with sodium pentobarbital (50 mg/kg, i.p.) and perfused through the heart with cold medium in which NaCl was replaced by an equiosmolar amount of sucrose (see Aghajanian and Rasmussen, 1989). A ventral hypothalamic explant was removed and placed in an incubation chamber, as described previously (Smith and Armstrong, 1990). The incubation medium consisted of (in mm): 25 NaHCO3, 3 KCl, 1.24 NaH2PO4, 124 NaCl, 10 glucose, 2 CaCl2, 1.3 MgCl2, 0.2 ascorbic acid, and 0.2 thiourea. The medium was saturated with 95% O2/5% CO2, with a pH of 7.3–7.4 and an osmolality of 290–300 mOsm/kg H2O; it was warmed to 32–34°C. All chemicals, unless otherwise stated, were purchased from Sigma (St. Louis, MO).
Electrophysiology. Intracellular recordings, signal digitization, and data analysis were made as previously described (Smith and Armstrong, 1990; Armstrong et al., 1994). Briefly, intracellular recording electrodes (100–150 MΩ) were pulled from 1.5 mm glass pipettes on a Sutter horizontal puller (Novato, CA). Recordings were obtained with the use of a Neurodata amplifier. Traces were acquired digitally, using the Labmaster TL-1 in conjunction with pClamp 6 software (Axon Instruments, Foster City, CA). All neurons included in the analysis had membrane potentials of −50 mV or more negative and action potentials of at least +55 mV. To unveil the presence of the sustained outward rectification (SOR) and rebound depolarization (RD) (electrophysiological properties specific to OT, but not VP, neurons), we current-clamped neurons at a depolarized membrane potential (range, −40 to −50 mV), and subjected them to increasing hyperpolarizations lasting 1.5 sec [see Stern and Armstrong (1995, 1977) for a detailed characterization of the SOR and RD]. As shown in the examples of Figure1B, when OT, but not VP, neurons were current-clamped at depolarized membrane potentials and subjected to hyperpolarizing pulses, a depolarizing sag to the voltage trajectory, followed by a rebound depolarization at the offset of the pulse, was observed. Current–voltage (I/V) plots were generated by passing 180 msec pulses through the electrode. Membrane resistance was taken as the slope of a linear regression measured at the linear part of the curve. Membrane time constant was estimated by exponential fits of the voltage transient generated from a current pulse sufficient to hyperpolarize the membrane 10–15 mV from rest.

Electrophysiological characterization of OT and VP neurons. A, Electrical recordings characteristic of an OT (dark trace) and a VP (gray trace) neuron. When neurons were current-clamped at depolarized membrane potentials, OT neurons were characterized by the presence of a sag during small hyperpolarizations (open arrow), followed by a rebound depolarization that produced spikes (filled arrow) at the offset of the pulses. On the other hand, VP neurons lacked a strong sag and exhibited no rebound depolarization. Traces shown are averages (n = 3).B, Nomenclature used to described the geometry of the dendritic trees of MNCs. Shown is an example of a soma with one tree displayed. Numbers represent dendritic branch order,filled circles represent nodes (branching points), anddashed lines trace an example of a path length.TB, Terminal branch; PTB, preterminal branch; E, branch endings.
Intracellular labeling, histology, and neuron reconstruction.For intracellular labeling, microelectrodes were filled with 1–2m potassium acetate containing 2%N-(2-aminoethyl) biotinamide (neurobiotin, Vector Labs, Burlingame, CA) (Kita and Armstrong, 1991). Intracellular injections were made with 200 msec, +0.5 nA rectangular pulses at 1 Hz for at least 20 min. After the recording session the explants were fixed in 4% paraformaldehyde and 0.2% picric acid overnight at 4°C. Horizontal sections (100 μm) were cut on a vibratome, rinsed in PBS, and incubated overnight in avidin–biotin complex (ABC, Vector Labs) diluted 1:100 in PBS containing 0.5% Triton X-100. After a thorough rinsing in PBS, the sections were reacted with diaminobenzidine tetrahydrochloride (60 mg/100 ml) in the presence of H2O2 (0.006%) and nickel ammonium sulfate (0.05%) for 10–20 min, rinsed, mounted on gelatin-coated glass slides, dried for 24 hr, and coverslipped with Permount.
Labeled neurons were reconstructed from serial sections with a drawing tube attached to a Nikon Optiphot microscope, reduced by photocopy, and scanned at 300 dpi (Hewlett Packard Scan Jet IIcx) for placement in figure layouts. Micrographs of filled neurons were captured digitally with a Kodak 460 camera (frame resolution, 2000 × 3000 pixels). Photo montages were constructed with Adobe Photoshop and printed to a Tektronic Phaser 440 color printer at 300 dpi. Software tools were used to adjust brightness and to blend borders that were created from cutting and pasting across focal planes.
For a morphometric analysis of the dendritic trees, neurons were reconstructed in three dimensions, using a computer-aided tracing system (Neurolucida, Microbrightfield, Colchester, VT). The detailed reconstruction of the dendrites was made with a 40× objective. In this system the course of each dendrite was traced by digitizing thex, y, and z coordinates and the width of the dendrite along its entire extent. All dendrites used for analysis were filled completely to their apparent natural endings. Analysis software allowed various numeric and graphical representations of the dendritic trees (see below). Computer-aided reconstruction of each neuron was made blind by using a code that was not broken until statistical comparisons were made.
Nomenclature and analysis of anatomical data. The terminology used in this study follows that of Ohara and Havton (1994)and is illustrated in Figure 1A. Dendrites branch atbranching points or nodes. In the present study all of recorded nodes gave rise to two daughter branches (e.g., dichotomous branching). Thus, branches as used herein correspond to segments in other nomenclatures (Sadler and Berry, 1988). The termination of a dendrite is called an ending. Branches originating from the last node and terminating in an ending are calledterminal branches (TBs), whereas branches between two branching points or between the soma and one branching point are calledpreterminal branches (PTBs). The portion of a dendrite from its origin at the soma to the first node is called a first order branch or primary dendrite. The daughter branches arising from the first node are second order branches, and so on. The branches arising from a common first order branch constitute a dendritic tree. The distance from the origin of a first order branch to the end point of a terminal branch corresponds to apath length. The length, surface area, and volume of the dendritic branches were calculated by algorithms provided by Microbrightfield software. The surface area for each cell (assuming a prolate spheroid) was calculated as (π/2) (B2 + AB (arcsinE)/E), where eccentricity E = (A2 −B2)1/2/A, andA and B equal the long and short Feret diameters, respectively (Russ, 1986). Global dendritic size parameters such as total dendritic length (TDL), total number of branches, total number of endings, etc., were obtained by summing the data for each dendritic tree. The mean dendritic length (MDL) is the average length of individual branches. In many cases these parameters were analyzed as a function of the branch order. When dendrites branch, each branch may give rise to dendritic subtrees that are of different sizes. A quantitative measure of such branching asymmetry may be obtained with a subtree partition analysis (Van Pelt and Verwer, 1983) in which each tree is divided into two subtrees after the first node. The number of terminal branches of the larger subtree is divided by the total number of terminal branches of the entire tree to arrive at the subtree partition ratio. A value of near 0.5 indicates symmetric branching, whereas a value toward 1.0 is indicative of asymmetric branching. The concentric sphere method of Sholl (Sholl, 1953) also was used to analyze branching patterns for the dendritic trees. Briefly, concentric spheres of a constant interval of 20 μm, with the center of the soma as the origin, were drawn for each filled neuron. The amount (length) of dendrite contained within each circle was counted, and the means and SEs were calculated and plotted as a function of the distance to the soma. The average dendritic diameter of each dendritic branch was back-calculated by using a standard formula for calculating surface area (2πrL) of a cylinder, where L is the length of the branch and r is the radius. The resolution of the system for diameter detection with a 40× lens was 0.31 μm. For all quantitative analysis, data were not corrected for tissue shrinkage (see Discussion). Because shrinkage occurred mainly in thez-plane (fixation to the slides prevents x–yshrinkage), we measured z-plane shrinkage for each cell and estimated its contribution to TDL. Shrinkage accounted for a similar percentage reduction of the TDL in all groups (OT-diestrous, 20.4 ± 3.0%; OT-lactating, 22.2 ± 3.1%; VP-diestrous, 23.4 ± 2.4%; VP-lactating, 20.7 ± 1.5%).
Statistical analysis. To assess a main effect of the cell type, the hormonal state of the animal, or the existence of significant interactions between these factors, we used a two-way ANOVA. Comparisons between diestrous and lactating states within each cell type were made with a single Student’s t test. When multiple comparisons were needed, as in the case of the analysis of various parameters as a function of the branch order, a Tukey’s test was used. In most of the cases the mean of each parameter was calculated for each neuron; for the statistical analysis,n = the number of neurons. To compare the incidence of a dendritic versus somatic axonal origin, we arranged frequencies of observations in a contingency table and used χ2 statistic for analysis (Zar, 1984). All results shown represent the mean ± SEM.
RESULTS
General appearance of filled neurons
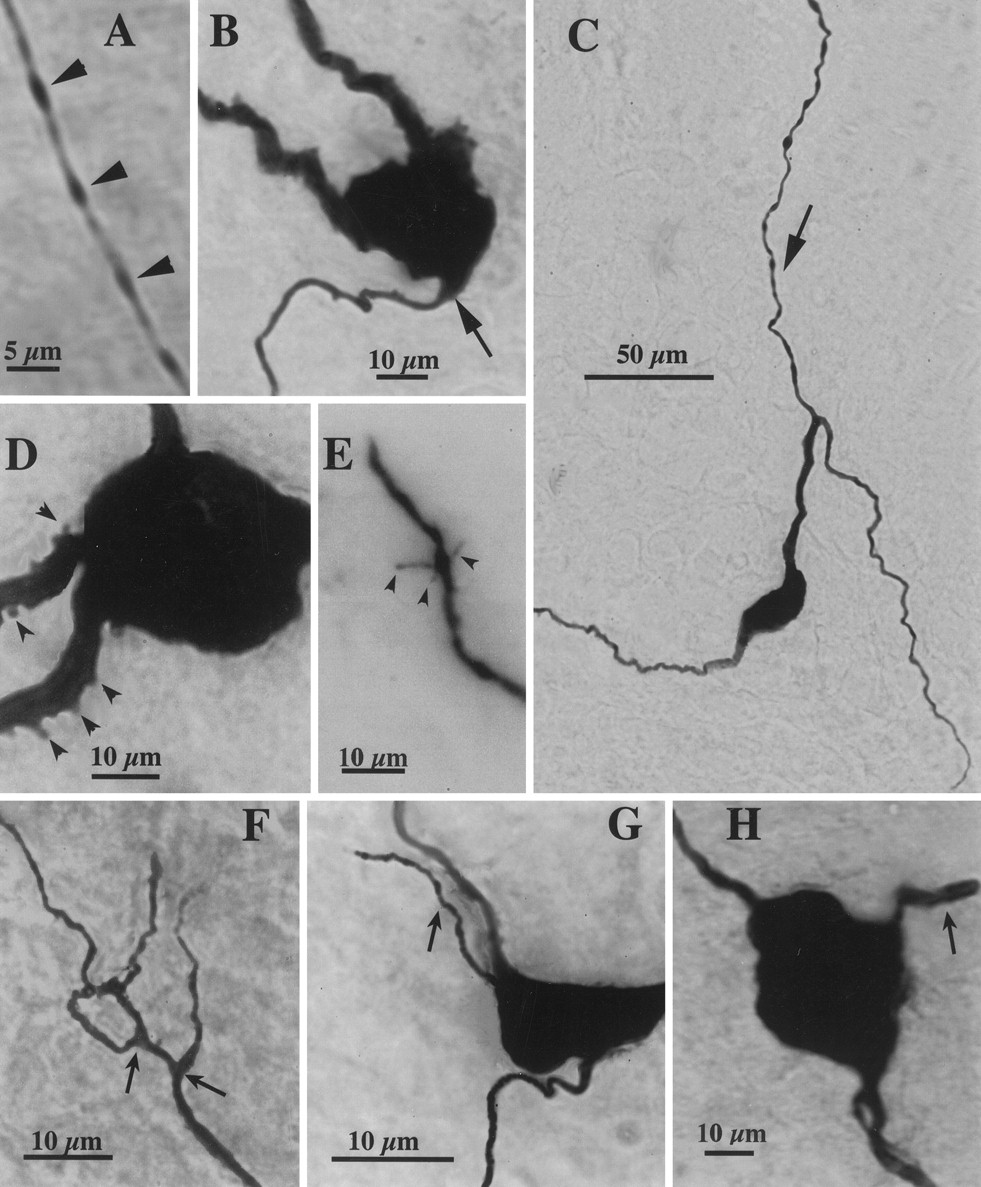
A total of 43 SON neurons obtained from diestrous (n = 20) and lactating (n = 23) rats was used in this study. Neurons were classified electrophysiologically as either OT (diestrous, n = 10; lactating,n = 10) or VP (diestrous, n = 10; lactating, n = 13) on the basis of the presence or absence of the SOR and RD, as explained in Materials and Methods (see Fig. 1B). Neurons subsequently were filled with neurobiotin and reconstructed in three dimensions for morphometric analysis. All filled neurons were located within the boundaries of the SON. In six cases (two from diestrous and four from lactating rats), dye-coupled neurons were encountered and discarded from the morphometric analysis. Figures2–5 display drawings of camera lucida reconstructed neurons for each experimental group. Photomicrographs showing details of filled neurons are shown in Figure 6. In general, and in agreement with previous work (for review, see Armstrong, 1995), filled neurons had an oblong soma with mean long and short axes of 28.1 ± 1.0 and 16.6 ± 0.6 μm, respectively. Each SON neuron had one to four primary dendrites, which usually coursed ventrally toward the ventral glial lamina (Armstrong et al., 1982). SON dendrites were often varicose and relatively aspiny, although in some cases dendritic spinous processes of various shapes were observed (Fig.6D,E).

Morphological structure of OT neurons obtained from diestrous rats. A–C show representative drawings of camera lucida reconstructed neurons. Arrows point to the axons. D, Dendrogram displaying the dendritic structure of the neuron shown in B.

Morphological structure of OT neurons obtained from lactating rats. A–C show representative drawings of camera lucida reconstructed neurons. Arrows point to the axons. D, Dendrogram displaying the dendritic structure of the neuron shown in B.
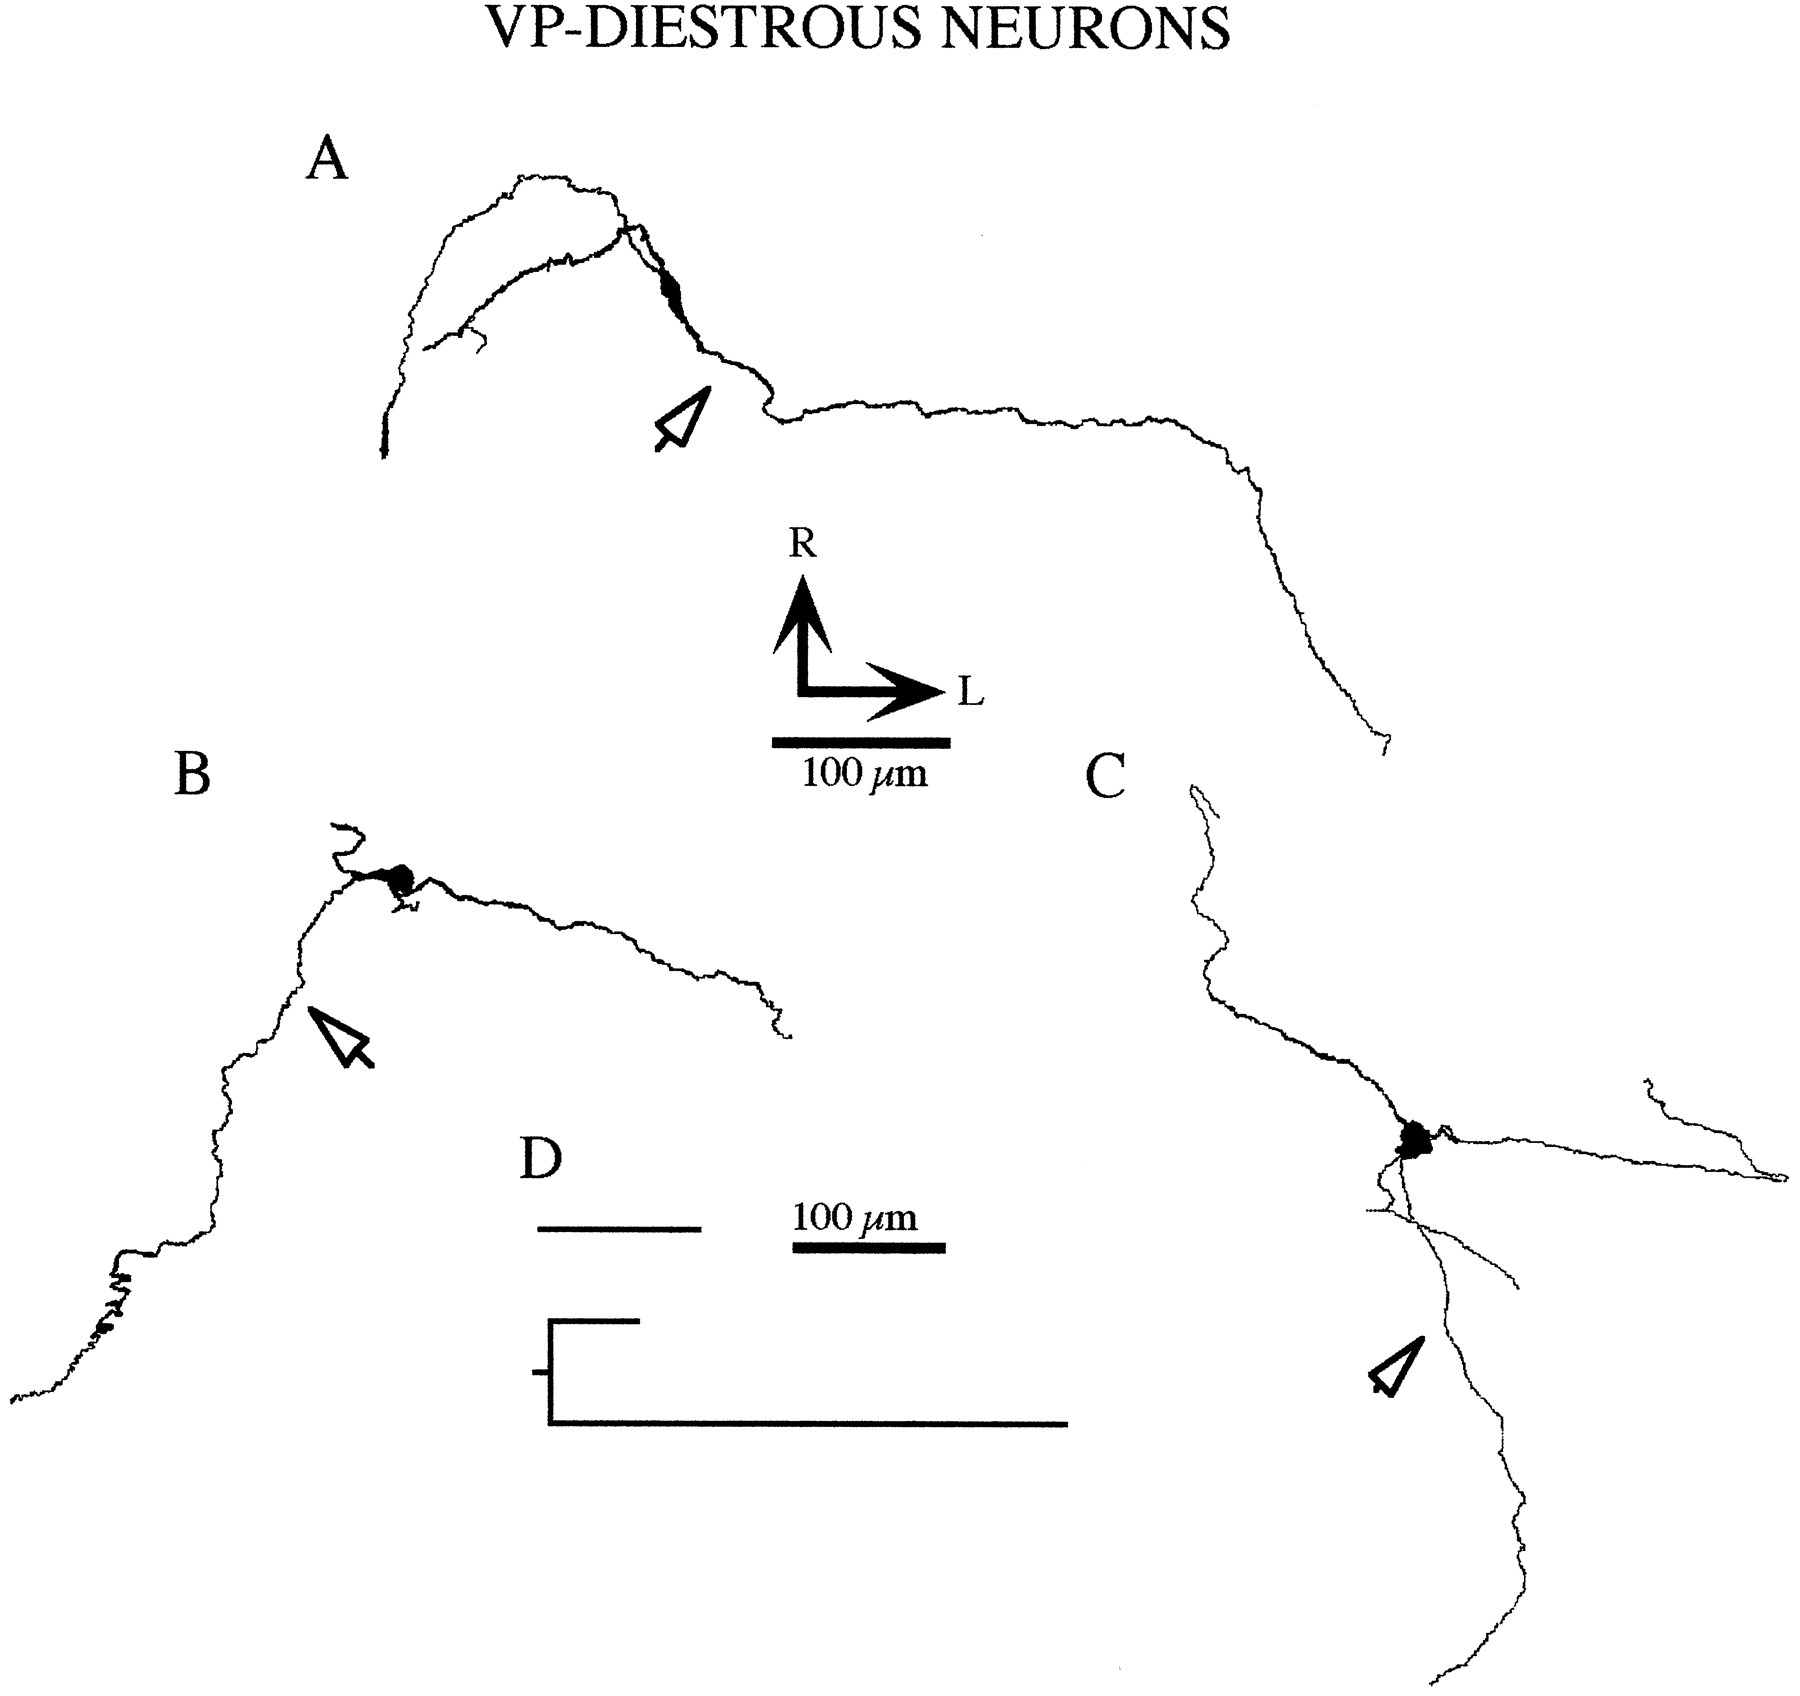
Morphological structure of VP neurons obtained from diestrous rats. A–C show representative drawings of camera lucida reconstructed neurons. Arrows point to the axons. D, Dendrogram displaying the dendritic structure of the neuron shown in C.

Morphological structure of VP neurons obtained from lactating rats. A–C show representative drawings of camera lucida reconstructed neurons. Arrowspoint to the axons. D, Dendrogram displaying the dendritic structure of the neuron shown in A.

Photomicrographs of filled SON neurons.A, Portion of an axon from a VP neuron from a diestrous rat, depicting its thin diameter and beaded appearance (arrowheads). B, Example of an axon arising from the soma (arrow) of an OT neuron from a lactating rat. C, Example of an axon (arrow) arising from a thick dendritic process at a relatively long distance from the soma of an OT neuron from a lactating rat. D, Examples of short, rounded spinous processes (arrowheads) present in proximal dendrites of a VP neuron from a lactating rat. E, Example of long, thin spinous processes (arrowheads) observed in a distal part of a dendrite of an OT neuron from a diestrous rat. F, Example of a dendritic ramification with two close branching points (arrows) in a VP neuron from a lactating rat.G, H, Examples of short primary dendrites (arrows) arising from the soma of two VP neurons from a lactating rat.
Axons were identified by their dorsomedial trajectory within the explant and were cut artificially at its dorsal surface (Randle et al., 1986; Smith and Armstrong, 1990). In general, they had a thinner diameter and beaded appearance (Fig. 6A). On average, the axonal length traced within the explant was 1185 ± 146 μm. In 63% of the cases the axon arose directly from the soma (Fig.6B), whereas in the rest of the cases the axon arose from a primary dendrite, at a mean distance from the soma of 37.4 ± 7 μm (Fig. 6C). No significant difference in the incidence of a dendritic axonal origin was observed either as a function of the cell type (OT, 40%; VP, 35%; p > 0.1, χ2 test) or the hormonal state of the animals (diestrous, 45%; lactating, 30%; p > 0.1, χ2 test).
The general qualitative aspects of the dendritic trees of the camera lucida reconstructed neurons, also exemplified in the dendrograms shown in Figures 2D–5D, suggest that considerable changes in the arborization of the dendritic trees of these neurons occur during lactation. This was confirmed and studied in further detail by a morphometric analysis (see below).
Soma size
Values obtained from somata of filled neurons of each group are shown in Table 1. A two-way ANOVA indicated that the long axis and soma surface area were significantly larger as a function of lactation (F = 7.2 and 9.0, respectively; p < 0.01). However, when specific cell type differences were searched, the enlargement observed during lactation was only significant in the VP group (p < 0.05 and p < 0.01 for long axis and soma surface area, respectively; Student’s ttest).
Surface area, long axis, and short axis of OT and VP somata of diestrous and lactating female rats
Dendritic branching pattern
The dendritic trees of the filled SON neurons branched sparsely, with an average of approximately six branches per neuron and branch orders ranging from first to sixth. To determine whether and how dendritic branching was dependent on the hormonal state of the animal, we analyzed several aspects of the dendritic arborization of OT and VP neurons in virgin and lactating rats.
Total number of branches
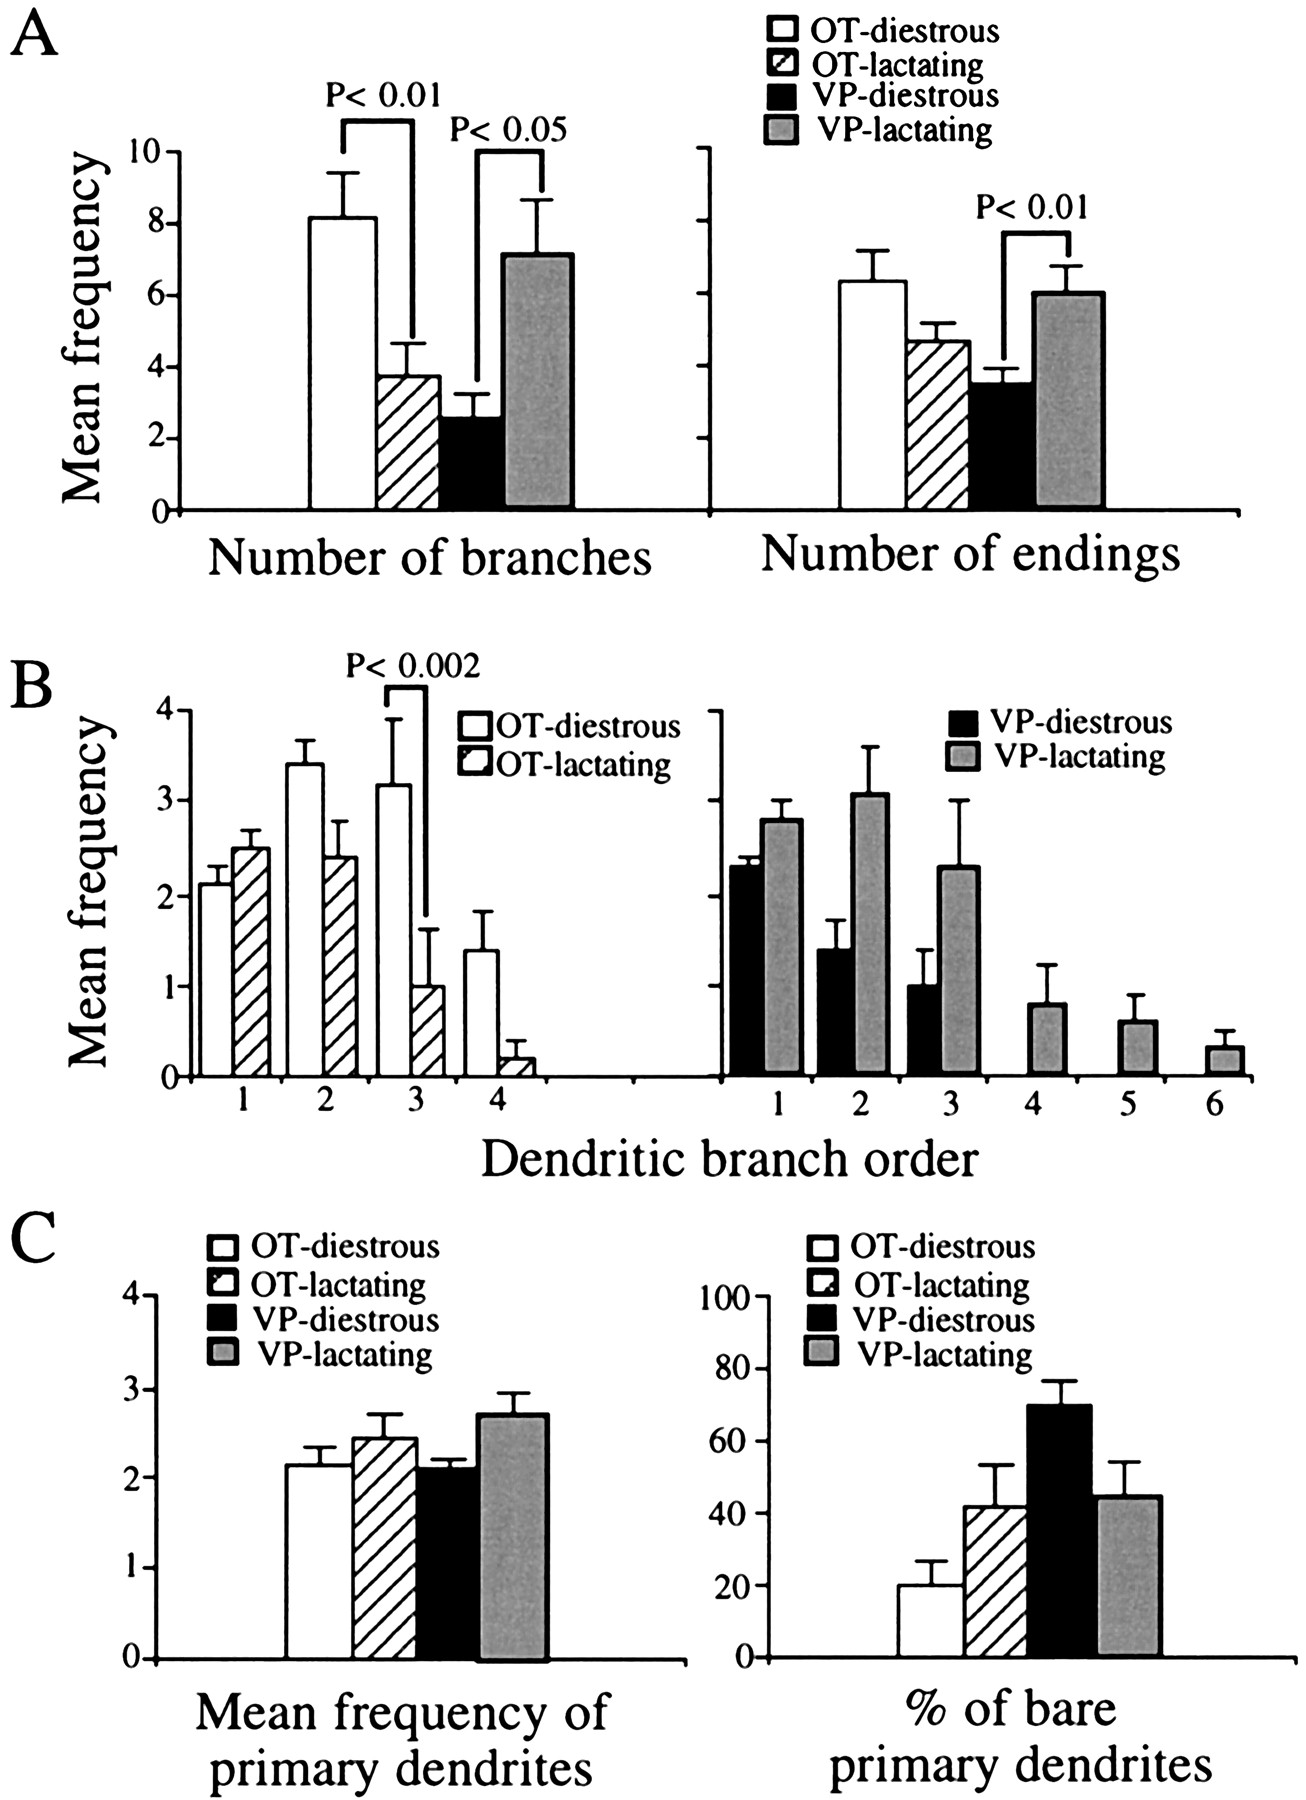
Lactation induced significant and opposite effects in the dendritic branching of OT and VP neurons. One of the most profound changes we observed was related to the number of dendritic branches. A significant and opposite change in the number of branches of OT and VP neurons was observed during lactation (F = 12.5;p < 0.002, interactions in a two-way ANOVA). As shown in Figure 7A, dendritic branching was decreased significantly in OT and increased in VP neurons during lactation (p < 0.01 andp < 0.05, Student’s t test).

Changes in the number and distribution of dendritic branches in OT and VP neurons during lactation.A, The number of branches (left panel) was significantly decreased and increased in OT and VP neurons, respectively, during lactation. The number of endings (right panel) was significantly increased in VP neurons, but no changes were observed in OT neurons during lactation.B, Frequency distribution of dendritic branches as a function of branch order in diestrous and lactating rats. In the case of OT neurons (left panel), the decreased branching observed during lactation was more pronounced in third and fourth branch orders. The addition of higher branch orders, as well as a tendency for an increment in middle branch orders, was observed in VP neurons (right panel) during lactation.C, Number of primary dendrites in OT and VP neurons in diestrous and lactating rats (left panel). The percentage of bare (i.e., unbranching) primary dendrites (right panel) increased and decreased in OT and VP neurons, respectively. The n for each column equals the number of neurons in each group, as given in Results.
Frequency distribution of the branches into branch orders
To determine whether the branching pattern also was affected during lactation, we studied the frequency distribution of branches into branch order. In OT neurons the mean frequency of dendritic branches varied significantly as a function of the branch order (F = 25.2; p < 0.0001, two-way ANOVA) (Fig. 7B, left panel). A post hocanalysis indicated that the decreased branching change observed during lactation was confined to the third dendritic branch order (p < 0.002, Tukey’s test). In VP neurons the mean frequency of dendritic branches also varied significantly as a function of the branch order (F = 15.8;p < 0.0001, two-way ANOVA) (Fig. 7B, right panel). The increased dendritic branching observed during lactation was attributable both to a tendency for an increment of middle order branches (second and third order) as well as to the addition of higher order branches, which were not present in diestrous rats.
Number and type of primary dendrites
The number of primary dendrites was increased significantly during lactation (F = 5.0; p < 0.05, ANOVA) (Fig. 7C, left panel), although a post hoctest failed to reveal significant differences between groups. When the proportions of branching versus bare (i.e., with no branches) primary dendrites were examined (Fig. 7C, right panel), an opposite effect was observed in OT and VP neurons during lactation (F = 6.9; p < 0.02, significant interactions in a two-way ANOVA). The percentage of bare primary dendrites increased in OT and decreased in VP neurons.
In accord with an increased number of branches and primary dendrites, the number of dendritic endings significantly increased in VP neurons during lactation (p < 0.01, Student’st test) (Fig. 7A, right panel). On the basis of the less branching observed in OT neurons during lactation, a decreased number of endings was expected to occur in this group. Although a tendency for this effect was observed, the difference was not significant (Fig. 7A, right panel), probably because of the balancing effect of the increased number of bare primary dendrites observed in this group during lactation (Fig.7C).
Branching symmetry: subtree partition analysis
To determine the degree of dendritic branching symmetry, e.g., the distribution of branches between two subtrees emerging from the same primary dendrite, we performed a subtree partition analysis (Van Pelt and Verwer, 1983), and we compared the ratios of terminal branches among groups (see Materials and Methods). The values obtained from the different groups were as follows: OT-diestrous, 0.58 ± 0.03 (n = 17); OT-lactating, 0.56 ± 0.02 (n = 13); VP-diestrous, 0.59 ± 0.03 (n = 7); and VP-lactating, 0.61 ± 0.03 (n = 20). These terminal ratio values indicate a relatively symmetric branching pattern in all groups. No significant differences were observed among groups (p > 0.05, two-way ANOVA), indicating that the changes observed during lactation in both groups were distributed equally among dendritic trees.
Dendritic length
Changes in the total and mean dendritic length during lactation
A significant and opposite change in the total dendritic length of OT and VP neurons was observed during lactation (F = 11.9; p < 0.002, interactions in a two-way ANOVA). The total dendritic length (TDL) was decreased significantly in OT and increased in VP neurons during lactation (p < 0.02 and p < 0.05, respectively; Student’st test) (Fig. 8A, left panel). On the other hand, the MDL of individual branches was not changed in either group (F = 0.21;p > 0.05) (Fig. 8A, right panel). Thus, the changes observed in the TDL presumably reflect the decreased and increased number of branches observed during lactation in OT and VP neurons, respectively (see above).

Changes in the dendritic length of OT and VP neurons during lactation. A, The total dendritic length was significantly decreased and increased in OT and VP neurons, respectively (left panel). No changes were observed in the mean dendritic length in either group (right panel). B, Changes in the distribution of the total dendritic length (top panels) and mean dendritic length (bottom panels) in OT (left panels) and VP (right panels) neurons. See Results for details. Unless stated between parentheses, the n for each column or point equals the number of neurons in each group, as listed in Results.
Frequency distribution of the dendritic length into branch orders
To investigate in more detail the changes observed in dendritic length, we analyzed the distribution of the TDL and MDL by branch orders (Fig. 8B). In OT-diestrous neurons the TDL significantly varied as a function of the branch order (F = 6.04; p < 0.002, one way ANOVA). A peak occurred at second order branches and accounted for ∼50% of the TDL (Fig. 8B, top left panel). The MDL of OT-diestrous neurons did not vary significantly as a function of the branch order, although a tendency for longer second order branches was observed (Fig. 9B, bottom left panel). The low numbers of events at higher branch orders prevented a statistical analysis of the data. During lactation OT neurons displayed a significant change in the pattern of dendritic length distribution. The TDL of OT-lactating neurons also varied significantly as a function of the dendritic order (F = 11.6; p < 0.0001, one way ANOVA), but in this case a progressive decrease in the length with increasing branch order was observed (Fig. 8B, top left panel). In this group most of the length was concentrated on primary dendrites (∼54%). As in the case of OT-diestrous neurons, the MDL of OT-lactating neurons did not vary significantly as a function of the branch order, although primary dendrites tended to be the longest. In fact, when only the primary dendrites were compared, we found an increased length during lactation (p < 0.02, Student’s t test) (see Fig. 8B, bottom left panel). These results clearly show that, in addition to the change in the absolute amount of dendritic length observed during lactation, the branching pattern of OT neurons was affected significantly.

Distribution of the dendritic length into terminal (TB) and preterminal (PTB) branches of OT and VP neurons in diestrous and lactating rats. A, The mean frequency of TBs and PTBs decreased and increased in OT and VP neurons, respectively, during lactation. B, The TDL of PTBs and TBs decreased and increased during lactation in OT and VP neurons, respectively. C, A tendency for an increased mean dendritic PTB and TB length was observed in OT and VP neurons, respectively. The n for each column equals the number of neurons in each group, as listed in Results.
For VP neurons, besides the addition of higher (fourth–sixth) branch orders during lactation, no significant differences were observed in the distribution pattern of the TDL and MDL (Fig. 8B, right panels). The TDL significantly decreased with increasing branch order in both groups (F = 14.6 andF = 9.4, p < 0.0001, one way ANOVA, for VP-diestrous and VP-lactating, respectively) (Fig.8B, top right panel). Although a statistical analysis was not applied because of low numbers of higher order branches, a similar pattern could be observed in the MDL.
Distribution of the dendritic length into terminal and preterminal branches
The effects of lactation on the dendritic arborization of MNCs described above may result in changes in collateral branching and/or be localized on terminal dendrites. To assess these possibilities, we analyzed the number and length of TBs and PTBs. The number of TBs and PTBs decreased and increased in OT and VP neurons, respectively (Fig.9A) (significant interactions: F = 11.9,p < 0.02 for TBs and F = 11.1,p < 0.02 for PTBs, two-way ANOVA). In both cell types most of the dendritic length was confined to TBs (OT-diestrous, 63.7 ± 6.1%; OT-lactating, 61.3 ± 9.7%; VP-diestrous, 85.4 ± 5.3%; VP-lactating, 74.6 ± 6.0%). No significant differences among groups were observed. The TDL of TBs and PTBs decreased and increased in OT and VP neurons, respectively (Fig.9B) (significant interactions: F = 6.9,p < 0.02 for TBs and F = 4.7,p < 0.05 for PTBs, two-way ANOVA). No significant differences were observed in the MDL of TBs and PTBs in either group (Fig. 9C), although a tendency for longer PTBs was observed in OT neurons and a tendency for shorter TBs was observed in VP neurons during lactation. These results suggest that the reduction of the TDL observed in OT neurons during lactation involved a reduction in the total length contributed by both PTBs and TBs. The tendency for the MDL of PTBs to increase would argue in favor of a collateral branch loss (see Discussion). In the case of VP neurons the growth in dendritic length was observed throughout both TBs and PTBs. The tendency for a shorter MDL of TBs observed in this group would indicate that shorter TBs were added during lactation. Thus, the changes occurring in OT and VP neurons during lactation involve different loci on their dendritic trees.
Dendritic path length
The study of the dendritic path length, e.g., the distance from the soma to each dendritic end point, also provides important information about dendritic branching pattern. The mean path length was similar in OT and VP neurons and did not change during lactation (Fig.10A) (F = 0.9 and F = 0.2, p> 0.05, two-way ANOVA, for cell type and hormonal state, respectively). The frequency distribution of the path length (Fig.10B) showed a large decrease in the number of path lengths of 350–400 μm length in OT neurons and a large increase in the number of path lengths of 300–500 μm length in VP neurons during lactation. An increased number of short (0–50 μm) path lengths also was observed in VP neurons during lactation. The fact that the changes in the TDL observed during lactation were not accompanied by changes in the average dendritic path length would further support the idea that in both cases the neurons changed size by altering the number of dendritic branches.

Path length and Sholl analysis of OT and VP neurons in diestrous and lactating rats. A, No changes in the mean path length were observed in either group during lactation.B, Frequency distribution of dendritic path length in OT (left panel) and VP (right panel) neurons. Each interval in the horizontal axis represents 20 μm. Note the increased number of short path lengths in VP neurons during lactation (arrow). C, Sholl analysis of the dendritic length of OT (left panel) and VP (right panel) neurons. The decreased and increased dendritic lengths observed during lactation in OT and VP neurons, respectively, were concentrated at ∼100–200 μm from the soma (*p < 0.05, Tukey’s test). The inset displays a diagram of the Sholl method. Concentric spheres of a constant interval of 20 μm, with the center of the soma as the origin, were drawn for each filled neuron, and the dendritic length contained within each sphere was counted. The n for each column or point inA and C equals the number of neurons in each group as listed in Results.
Sholl analysis of the dendritic trees of OT and VP neurons
To gain more insight into the spatial distribution and extension of the dendrites relative to the soma and to determine how this organization is changed during lactation, we analyzed the dendritic branching pattern of OT and VP neurons by Sholl’s method (Sholl, 1953) (see also Materials and Methods). Figure 10C shows a plot of the dendritic length as a function of the distance from the soma encountered in 20 μm concentric spheres from the center of the soma. In the case of OT neurons, a significantly different pattern was observed during lactation (F = 24.0; p< 0.0001, two-way ANOVA). A significant reduction of the dendritic length was observed between 80 and 140 μm from the soma (Fig.10C, left panel). Furthermore, the peak for dendritic length was shifted closer to the soma during lactation (OT-diestrous, 118.0 ± 25 μm; OT-lactating, 48.9 ± 9.5 μm; p < 0.02, Student’s t test). On the other hand, the maximal distal extension of the dendritic trees was similar in both conditions (OT-diestrous, 316.0 ± 32.9 μm; OT-lactating, 311.1 ± 29.1 μm; p > 0.05, Student’s t test).
As opposed to the changes observed in OT neurons, VP neurons displayed an increased dendritic length encountered in the concentric spheres during lactation (F = 26.9; p < 0.0001, two-way ANOVA) (Fig. 10C, right panel). As in the case of OT neurons, this change was concentrated at a distance of 80–180 μm from the soma, but the peaks for dendritic length occurred at a similar distance from the soma (VP-diestrous, 92.0 ± 14.7 μm; VP-lactating, 84.6 ± 10.9 μm; p > 0.05, Student’s t test). The maximal distal extension of the dendritic trees was also similar in both conditions (VP-diestrous, 268.0 ± 28.3 μm; VP-lactating, 327.7 ± 24.4 μm;p > 0.05, Student’s t test).
Dendritic area and dendritic diameter
On the basis of the dendritic lengths and diameters that we recorded, a significant and opposite change in the total dendritic area of OT and VP neurons would be expected during lactation (F = 6.9; p < 0.002, interactions in a two-way ANOVA). The estimated dendritic area decreased by 30% and increased by 45% in OT and VP neurons during lactation, respectively (OT-diestrous, 7338.8 ± 1149 μm2; OT-lactating, 5076.0 ± 543 μm2; VP-diestrous, 4396.3 ± 514 μm2; VP-lactating, 6380.2 ± 806 μm2). To compare the degree of dendritic dominance in OT and VP neurons, we calculated the ratios of the dendritic to soma area. A significant and opposite change in OT and VP neurons was observed during lactation (F = 4.5; p < 0.05, interactions in a two-way ANOVA). In OT neurons the ratio decreased by 44.5%, whereas a slight increase (4%) was observed in VP neurons (OT-diestrous, 7.3 ± 1.3; OT-lactating, 4.1 ± 0.8; VP-diestrous, 4.3 ± 0.6; VP-lactating, 4.47 ± 0.4). The actual dendritic surface area is certainly underestimated from these calculations because the contributing areas of spines, other similarly small appendages, and small membrane undulations, accurate measurements of which are beyond the limit of the light microscope, were not considered. However, SON neurons appear relatively aspiny, and we expect that the contributions of small appendages to the total membrane area are not great.
Figure 11 shows a plot of the mean dendritic diameter as a function of the branch order. In all groups the dendritic diameter decreased with increasing branch order. The low numbers of events at higher branch orders prevented a statistical analysis of the data. Our data indicate that the average dendritic diameter did not change with lactation.
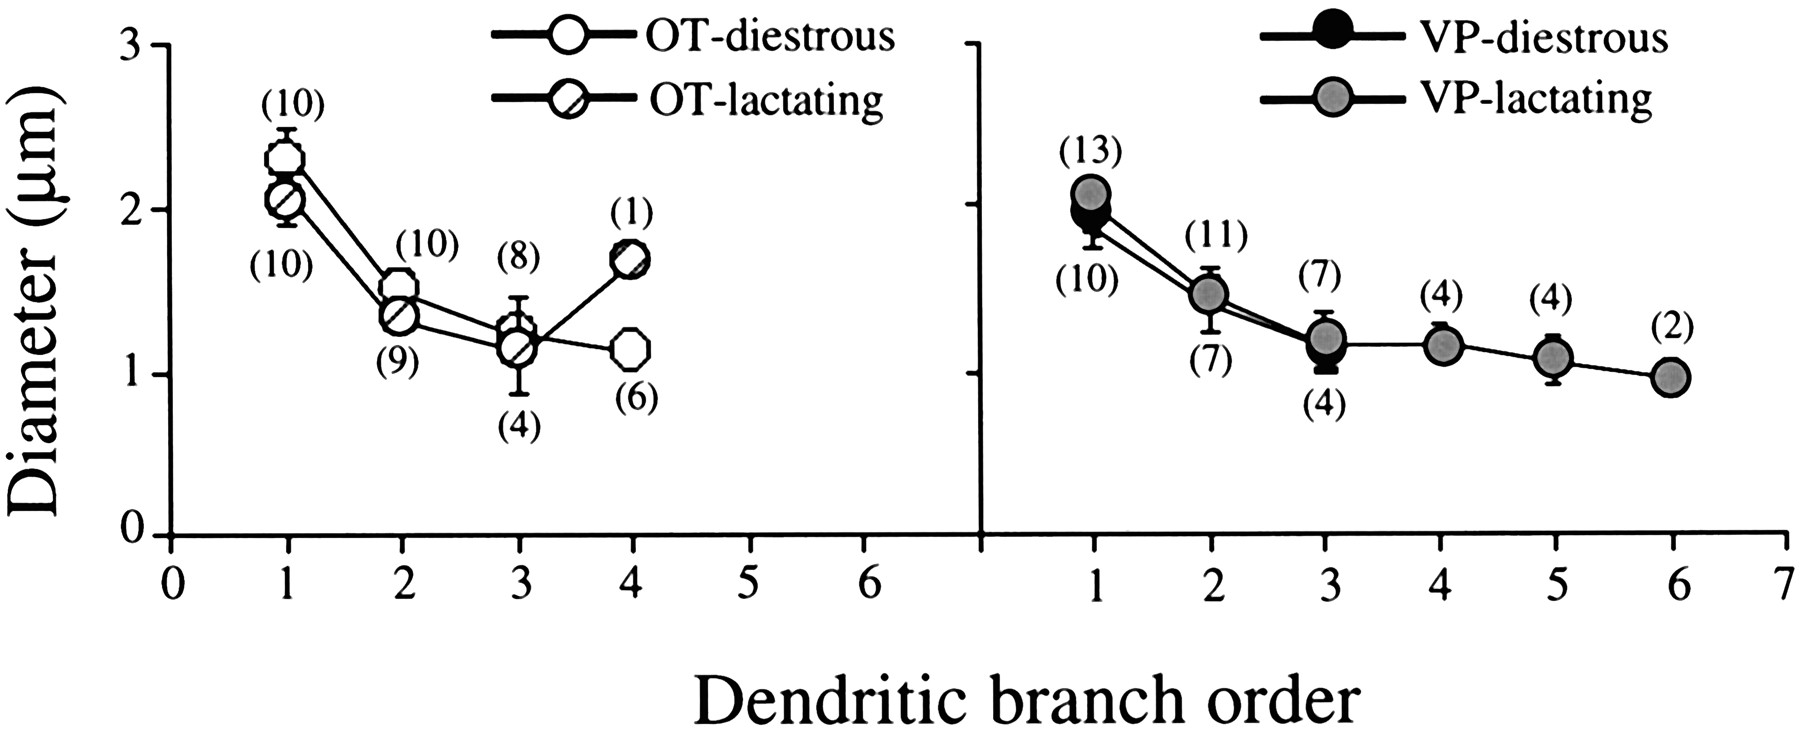
Dendritic diameter as a function of branch orders of OT and VP neurons in diestrous and lactating rats. The dendritic diameter in OT (left panel) and VP (right panel) neurons decreased with increasing branch orders. The number of events for each branch order is shown inparentheses.
Electrophysiology
Intracellular recordings of the subsequently reconstructed neurons were obtained to characterize some of their basic membrane properties. Average resting membrane potential, input resistance, and membrane time constant did not differ significantly among groups (Table2), although a tendency for a higher input resistance was observed during lactation in OT neurons. On the basis of the morphometric results described above, it is clear that input resistance does not necessarily reflect the significant changes in estimated total membrane area. For OT neurons the decrease in total surface area is ∼30%, and the tendency is for an increased input resistance of ∼20%. Thus, the sample size simply may be inadequate to detect the difference. Such an explanation is not tenable for VP neurons, which appear to increase their surface area >40% but show no expected reduction in input resistance. A further consideration of these mismatches should await more precise estimates of surface area, time constant (as an estimate of specific membrane resistivity), and input resistance. The first may be afforded with additional electron microscopic information and the latter two with whole-cell, tight-seal recording.
Resting membrane potential (Vm), input resistance (Ir), and membrane time constant (τ) of OT and VP neurons of diestrous and lactating female rats
DISCUSSION
In a recent study we have shown that the electrophysiological properties of SON MNCs are changed during lactation (Stern and Armstrong, 1996a). Besides, a profound cytoarchitectonic reorganization is well known to take place in the SON in response to physiological stimuli (for review, see Hatton, 1990; Theodosis and Poulain, 1993). Our present results demonstrate that the dendritic trees of SON neurons contribute to the plasticity during lactation. In general, opposite effects were observed in OT and VP neurons, the dendritic arborizations of which were reduced and enlarged, respectively, during lactation.
Changes in dendritic organization during lactation
The present results indicate that the dendritic trees of OT neurons shrunk during lactation. The fact that the decreased TDL was associated with a decreased number of branches without changes in branch MDL and in the mean path length would argue that the shrinkage was attributable mainly to the loss of dendritic branching. To gain more insight into the nature of this reorganization, we analyzed the dendritic branching pattern by different means. Significant changes were observed in OT neurons during lactation: the distribution of the TDL was shifted toward a smaller branch order, with most of the dendritic length concentrated now on primary dendrites. The decreased branching involved both preterminal and terminal branches. In addition, the MDL of primary branches was significantly larger. These results suggest that a reduction in side branching, involving second branch orders together with their daughter branches, took place during lactation. A loss in collateral branching is supported further by the tendency for an increased MDL of PTBs. A model depicting these changes is shown in Figure12A. The Sholl analysis indicated that the reduction of dendritic length occurred at ∼100–200 μm from the soma and that the maximal distal extension of the dendritic trees was unchanged. This was supported further by the absence of changes in the mean path length during lactation.

A simplified model depicting the changes observed in the dendritic trees of OT and VP neurons during lactation.A, Changes observed in OT neurons. A loss of collateral trees close to the soma (black dotted lines) involving second, third, and fourth branch orders, which include PTBs and TBs, is shown. Also, a new primary dendrite (continuous gray line) and the enlarged soma (gray oval) are shown. B, Changes observed in VP neurons. An increment in the number of preexisting branch orders as well as the addition of higher branch orders (continuous gray lines), which include PTBs and TBs as well, is shown. Note also the enlarged soma. In both cases continuous black linesrepresent the dendritic structure observed in diestrous neurons.
Strikingly, opposite changes were observed in the dendritic arborization of VP neurons during lactation. The dendritic trees elongated, mainly because of an increased dendritic branching, without concomitant changes in the MDL of individual branches. In addition to an increment in the number of second and third branch orders, higher orders were incorporated during lactation. This dendritic expansion, which involved both preterminal and terminal branches, did not result in an increased distal extension of the trees, as indicated by the Sholl analysis and by the absence of changes in the mean path length, but, rather, in a more dense dendritic arborization at a distance of ∼100–200 μm from the soma. A model depicting these changes is shown in Figure 12B.
During lactation the number of primary dendrites was increased in both OT and VP neurons. One possible explanation is that new dendrites emerged from the soma. Alternatively, because an enlargement of the soma area also occurred during lactation, the possibility that close branching points to the soma were absorbed by the hypertrophic somata, leading to a new primary dendrite, cannot be discarded. However, the fact that the enlargement of the soma observed during lactation represented only approximately one-third and one-fourth of the mean surface area of the primary dendrites of OT and VP neurons in diestrous rats, respectively, would argue against the absorption alternative.
It has been argued that the plasticity observed in MNCs in response to lactation and dehydration is restricted to OT neurons (for review, seeTheodosis and Poulain, 1993). However, others have shown that, in response to dehydration, the incidence of dye-coupled neurons and somasomatic or dendrodendritic contacts increased in VP neurons as well (Cobbett and Hatton, 1984; Marzban et al., 1992). Our results would further support the idea that both OT and VP neurons participate in the cytoarchitectonic reorganization of the MNC system in response to an increased hormonal demand but in different, even inverse, ways.
Functional consequences of the dendritic reorganization of OT and VP neurons
Synaptic inputs to OT and VP neurons in the SON influence their electrical activity and, therefore, hormone release from their terminals. A large proportion of these inputs is axodendritic (Meeker et al., 1993; Gies and Theodosis, 1994). Previous studies on the electrotonic properties of SON neurons reported a dendritic length of approximately one length constant and a significant dendritic dominance over the soma (Armstrong and Smith, 1990), emphasizing the importance of the dendritic trees of OT and VP neurons to their electrical behavior. The present study indicates that the pattern and size of the dendritic arborization of OT and VP neurons is dynamic across endocrine states, and this change in turn could influence the overall number and types of synaptic inputs available, as well as the electrotonic efficacy at which these inputs will reach the soma to determine the final output of the neuron (Rall, 1977). Both interpretations are in part conditional on whether the surface area of the dendrites is altered correlatively with dendritic length (see Results).
The morphology of the dendritic tree also shapes the size and form of synaptic potentials arriving at the soma (Rall, 1959, 1977). In the simplest interpretation the decreased branching observed during lactation would cause OT neurons to become more electrotonically compact, allowing isolated synaptic signals to propagate more efficiently to the soma. As far as the possible quantitative and/or qualitative changes in the distribution of synapses that follows this dendritic readjustment, different scenarios may arise. On one hand, dendritic shrinkage could be accompanied by a loss of synaptic contacts. If these inputs were carrying information about factors other than lactation, the neurons would be dealing with fewer, but more specific, inputs in a more efficient way. In fact, a decreased response of the oxytocinergic system during lactation to nonspecific stimuli such as hypovolemia (Koehler et al., 1993), hyperosmolality, and stress (Higuchi et al., 1988) was described. Alternatively, if no loss of synaptic inputs occurs, the density of synaptic inputs could be increased as a consequence of the decreased dendritic area. Recently, it has been reported that the number of GABAergic and glutamatergic axosomatic synapses in immunoidentified neurons in the SON is greater in OT neurons during lactation (Gies and Theodosis, 1994; El Majdoubi et al., 1996). Unfortunately, a similar analysis in immunoidentified dendritic profiles was not performed in any of these studies. An increased synaptic density could alter the spatial relationships among inputs and influence synaptic integration as well, because summations among spatially closer, synchronously active inputs are more nonlinear and less powerful (Rall, 1977).
In the case of VP neurons the enlarged dendritic length and branching observed during lactation would make these neurons less electrotonically compact; thus, isolated distal inputs would be less efficiently transferred to the soma. However, an expanded dendritic tree also increases the possibilities for synaptic integration, e.g., synchronous remote inputs have a better opportunity for linear summation at the soma. Little is known about the physiology of the vasopressinergic system during lactation. Köehler et al. (1993)reported that the threshold for VP release in response to changes in fluid balance is decreased during late pregnancy and increased during lactation. Whether these changes are related to the topological modifications observed during lactation remains to be established.
In summary, the present results indicate that during lactation the length and geometry of the dendritic trees of OT and VP neurons in the SON are affected significantly in opposite ways. These changes would alter the electrotonic properties of the neurons, affecting the strength of synaptic inputs and possibly their number and types as well. Furthermore, it was reported recently that changes in the dendritic structure of a neuron could be correlated with the expression of different firing patterns (Mainen and Sejnowski, 1996). Whether the reorganization of the dendritic arborization of OT neurons that occurs during lactation contributes to the bursting firing pattern displayed by this population during this stage (Wakerly and Lincoln, 1973) remains to be established.
Footnotes
This work was supported by National Institutes of Health Grant NS23941 to W.E.A. and by the Neuroscience Center for Excellence in the Department of Anatomy and Neurobiology, University of Tennessee, Memphis, TN. We thank Mr. Emin Kuliyev and Mr. Daniel Keuter for valuable technical assistance and Dr. Charles Wilson for commenting on this manuscript.
Correspondence should be addressed to Dr. Javier E. Stern, Department of Anatomy and Neurobiology, College of Medicine, University of Tennessee, 855 Monroe Avenue, Memphis, TN 38163.


