

Article Figures & Data
Figures
- Fig. 1.
Morphological and physiological identification of neostriatal cholinergic interneurons. A, Synthetic projection micrograph of a cholinergic neuron prepared from a 300-μm-thick whole mount is shown. The large soma and thick primary dendrites that branch to form fine-diameter secondary and higher order processes are characteristic of cholinergic interneurons. In this particular example, the axonal arborization gives rise to a dense plexus that innervates the area surrounding the soma and dendrites.B, During whole-cell recording, cholinergic cells are readily identified by their response to intracellular current injection. Injection of a negative current pulse produces an initial hyperpolarization followed by anIh -dependent sag in the membrane potential. Depolarizing current induces regular spiking and results in a long-lasting afterhyperpolarization after cessation of current injection. C, In the absence of applied current, spontaneous regular spiking (rate = 2.87 Hz; CV = 0.157) was observed in this particular neuron. The membrane potential is indicated for the initial point of each trace in Band C, and the recording was made at 35 ± 2°C.
- Fig. 2.
The spectrum of firing patterns observed during whole-cell recording at 25 ± 1°C in slices from 2 to 3 week postnatal rats. A–C, Cholinergic interneurons exhibited a continuum of firing patterns including regular (CV = 0.159), irregular (CV = 0.715), and burst (CV = 3.059) firing.D, Histogram of the mean firing rate illustrates that the majority of cholinergic cells are spontaneously active at 25 ± 1°C and exhibit a range (0.00–3.06 Hz) of firing rates.E, Plot of the relationship between the mean firing rate and the CV of the interspike intervals reveals that, in general, neurons firing with higher rates exhibit more regular spiking patterns. The CV was only calculated in neurons that fired at >0.33 Hz and was generated from a 1 min sample period.
- Fig. 3.
Cholinergic cells exhibit a range of firing rates and patterns during cell-attached recordings at 35 ± 2°C from 3 to 4 week postnatal rats. A, B, Regularly spiking cells were readily identified during cell-attached recording and exhibited a narrow unimodal Gaussian distribution in the ISI histogram (bin width = 5 msec; 2 min sample). C,D, Irregularly spiking cells were recognized by the large variability in the ISI and gave rise to unimodal ISI histograms with a large variance (bin width = 10 msec; 2.5 min sample). The fluctuations in the baseline of the cell-attached voltage-clamptrace result from the opening of large conductance channels. E, F, Burst firing was characterized by the clustering of spikes and produced a very skewed ISI histogram, with the peak corresponding to the modal intraburst interval and variable, long-duration ISIs corresponding to the interburst intervals (bin = 25 msec; 4.5 min sample).G, Cholinergic cells exhibited a range (0.00–9.52 Hz) of firing rates with the majority of cells (69%) spiking at >0.2 Hz.H, The relationship between CV and firing rate shows a general trend for more rapidly firing cells to be more regular.
- Fig. 4.
Spontaneous excitatory synaptic inputs are not responsible for the tonic firing of cholinergic interneurons in vitro. A, B, Cell-attached voltage-clamp recordings show that pharmacological blockade of AMPA and NMDA receptors had no obvious effect on the spike rate or pattern.C, D, Application of CNQX (20 μm) and CPP (50 μm) did not produce any change in the ISI histogram (bin width = 10 msec; 2 min sample), and accordingly the firing frequency and CV were unaltered. Control data are in C. E, F, Group data illustrate that spontaneous excitatory inputs do not have any detectable effect on the firing rate (E; control = 1.25 ± 0.98 Hz; CNQX + CPP = 1.46 ± 1.04 Hz;n = 17; p > 0.2) or CV (F; control = 0.703 ± 0.373; CNQX + CPP = 0.595 ± 0.334; n = 17;p > 0.2).
- Fig. 5.
Cholinergic interneurons receive minimal tonic excitatory input in vitro. A, At a holding potential of −60 mV in the presence of BMI (30 μm) and APV (50 μm), very few spontaneous inward currents were detected. Application of 4-AP (100 μm) caused the appearance of many, fast EPSCs that were blocked by DNQX (40 μm). B, The rapid kinetics of the 4-AP–induced AMPA receptor–mediated EPSCs is shown using a faster sweep speed. C, D, Further confirmation that the 4-AP–induced EPSCs are mediated by AMPA receptors is provided by the voltage-dependent reversal of these events. E, Cholinergic cells do not receive detectable spontaneous NMDA receptor–mediated synaptic inputs at 0 mV in the presence of BMI (30 μm) and CNQX (20 μm). Addition of 4-AP (100 μm) produced many slow, inward currents, which were confirmed by blockade with CPP (50 μm) to be caused by activation of NMDA receptors.F, Superimposed 4-AP–induced NMDA receptor–mediated EPSCs are shown at a faster sweep speed to illustrate their slow kinetics. G, H, Further confirmation that the 4-AP–induced events are mediated by NMDA receptors is provided by their voltage dependence.
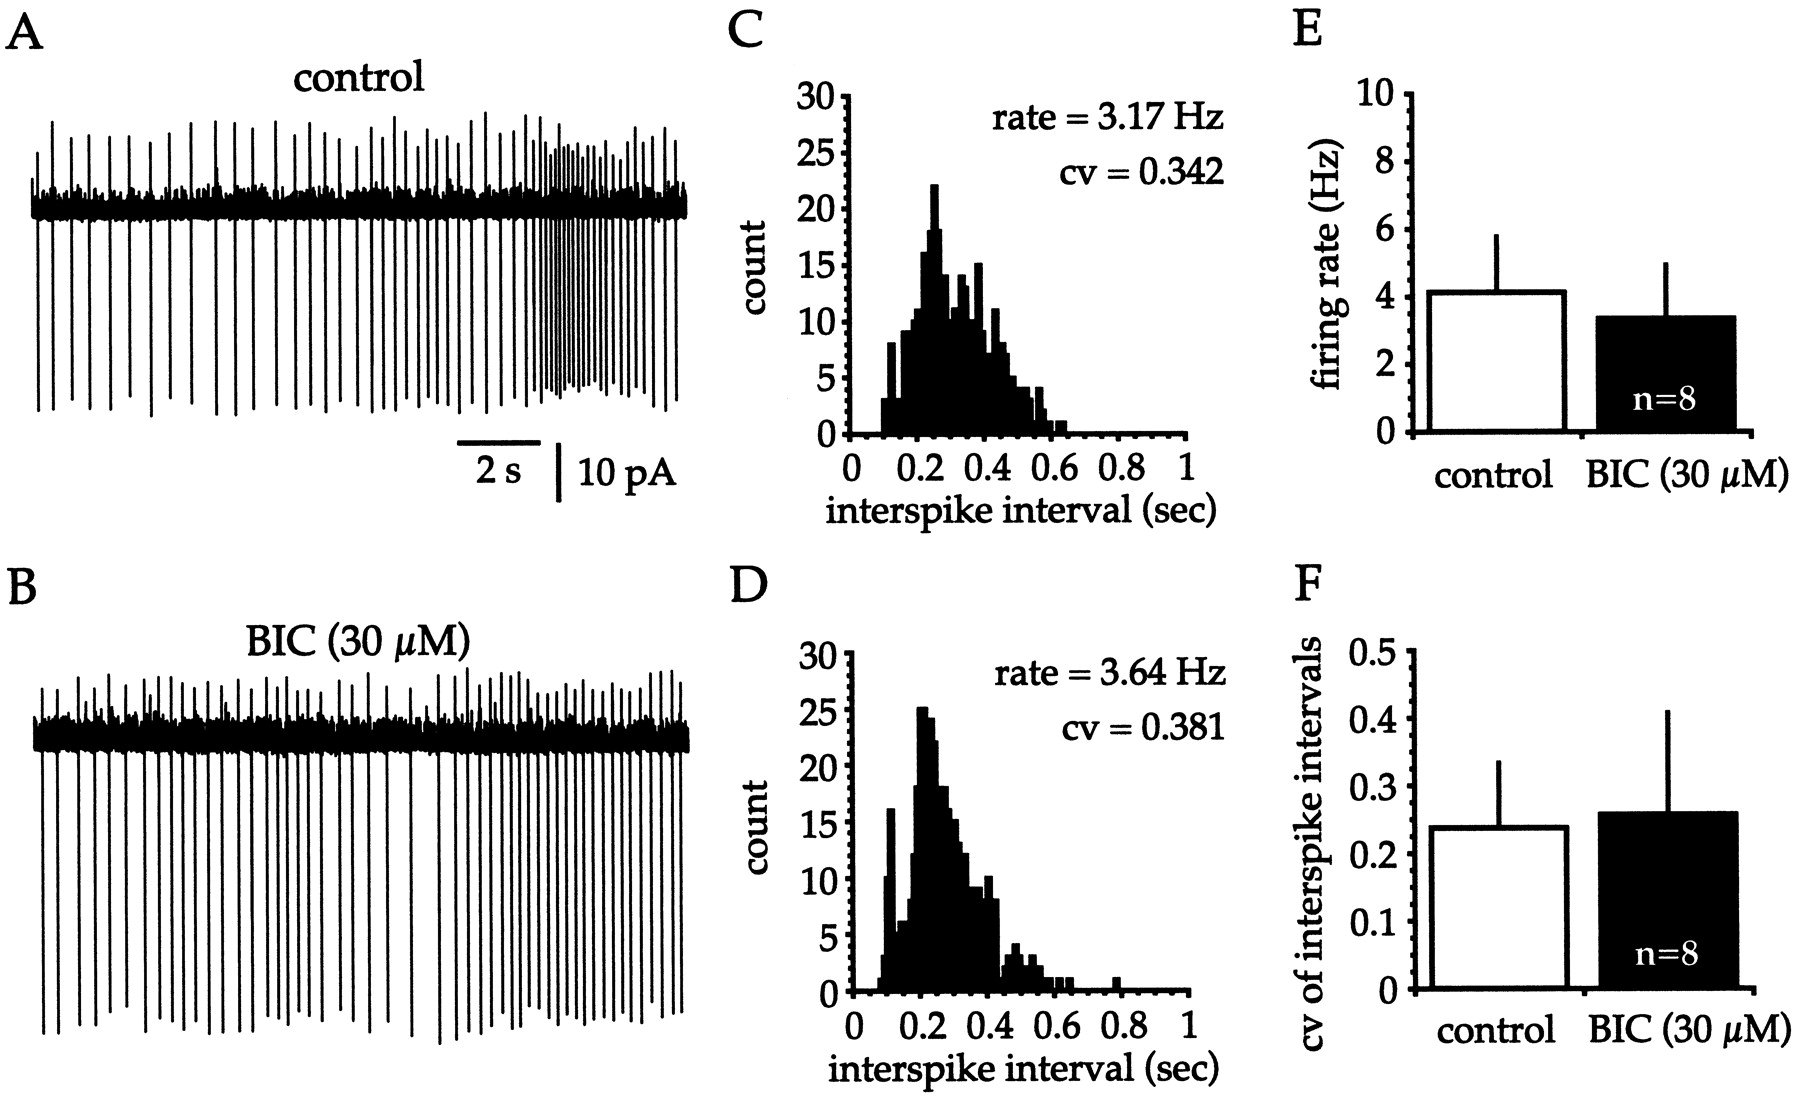
- Fig. 6.
Irregular spiking of cholinergic cells is not attributable to spontaneous inhibitory inputs in vitro.A, B, No discernible alteration in the firing rate or pattern of this cholinergic cell occurs after blockade of GABAA receptors with BIC (30 μm).C, D, Examination of the ISI histograms (bin width = 10 msec; 2 min sample) generated from data from which the spike trains were taken (control data in C) reveals that BIC (30 μm) produces no obvious effect on the spiking rate or pattern. E, F, Grouped data reveal that blockade of GABAA receptors with BIC (30 μm; n = 4) or SR-95531 (30 μm; n = 4) does not produce a significant alteration in the firing frequency (E; control = 4.13 ± 1.64 Hz; BIC or SR-95531 = 3.35 ± 1.57 Hz; n = 8; p > 0.2) or CV (F; control = 0.237 ± 0.097; BIC or SR-95531 = 0.257 ± 0.150; n = 8;p > 0.2) of cholinergic cells.
- Fig. 7.
Cholinergic interneurons receive minimal spontaneous inhibitory synaptic input in vitro.A, In the presence of DNQX (40 μm) plus APV (50 μm) at a holding potential of −10 mV, a few small-amplitude outward currents are detectable. Application of 4-AP induced a large increase in the amplitude and frequency of spontaneous IPSCs, and their sensitivity to BMI (10 μm) indicates that they are mediated by GABAA receptors.B, Superimposed sweeps at a faster speed are shown to illustrate the kinetics of the 4-AP–induced IPSCs. C,D, The IPSCs are confirmed by their voltage-dependent reversal close to the chloride equilibrium potential to be caused by GABAA receptor activation.
- Fig. 8.
Extracellular single-unit recordings of cholinergic cells in vitro. The ISI histogram (B, E, H,K) and autocorrelogram (C,F, I, L) accompanying eachtrace (A, D,G, J) are shown. Bin width is 10 msec. A–C, Regularly spiking cholinergic cells give rise to a narrow, unimodal Gaussian distribution in the ISI histogram (12.5 min sample). The autocorrelogram (2.5 min sample) exhibits multiple, uniformly spaced peaks, owing to the stationarity and regularity of the spike train. D–F, Irregularly firing cholinergic cells exhibit relatively stationary ISIs interspersed with periods of more variable spike timing. The corresponding ISI histogram (15.5 min sample) is unimodal but skewed toward theright. The autocorrelogram (5 min sample) shows a single peak, caused by the increased likelihood of firing at the end of the afterhyperpolarization, and little additional structure.G–I, Cholinergic cells also exhibit bursting or clustered firing that was characterized most clearly by an obvious bimodal distribution in the ISI histogram (10 min sample). The autocorrelogram (10 min sample) exhibits two clear peaks, the first corresponding to the intraburst intervals and the second to the interburst intervals. J–L, Cholinergic cells that fired in a seemingly random manner were also encountered. The ISI histogram (28 min sample) displays a clear modal value but is very skewed, and examination of the autocorrelogram (10 min sample) reveals that, other than the decreased probability of spike generation during the afterhyperpolarization, there is no structure to the spiking pattern.


