

Article Figures & Data
Figures
- Fig. 1.
Delayed outward currents of mouse hippocampal neurons and patterns of changes observed during and after exposure to 100 μm1S,3R-ACPD. These currents demonstrate the immediate increase in current amplitude seen on application of 1S,3R-ACPD, and acceleration of delayed current inactivation observed after the exposure to agonist. Note that the changes in inactivation rate and steady-state amplitude were most evident at voltages positive to approximately −10 mV.A1, Control currents recorded under conditions that will maximize observation of delayed outward currents,ID,IK, and various forms ofIK(Ca), and minimize the contribution of IA (see Results). Currents were recorded at voltages between −50 and +40 mV (in 10 mV increments), as illustrated in the schematic. A2, Currents recorded 1 min after initiating exposure to 100 μm1S,3R-ACPD. A3, Currents recorded 10 min after termination of the 3-min-long exposure to 1S,3R-ACPD. B1, Voltage dependence of fractional inactivation of delayed outward currents [1 − (Iend/Ipeak)], illustrating the 1S,3R-ACPD-induced increase seen at voltages positive to −10 mV and the broad bell-shape of the change in fractional inactivation with voltage (difference). B2, Ratio of mean fractional inactivation for each test voltage; 1S,3R-ACPD increased mean fractional inactivation by ∼35% except at the most positive voltage. Data are mean ± SD; n = 7. Statistical significance is indicated in this and all subsequent figures: ns, not significant; *p < 0.05; **p < 0.01; and ***p < 0.001.
- Fig. 2.
Time course of increase in delayed outward current amplitude followed by acceleration of inactivation, during and after 3-min-long exposures to 1S,3R-ACPD (100 μm). Control records in A, taken during test depolarizations to +40 mV, demonstrate the stability of currents when the standard internal solution was used (see Materials and Methods). Sixteen traces taken over an 8-min-long interval are shown inA1, and their peak and end amplitudes (end amplitude is the amplitude just before repolarization) are plotted inA2. The vertical dotted lines inA2 refer to the times at which mGluR agonist would be applied to and removed from experimental neurons, and the selected traces in A3, and the aggregate data presented inA4 and A5, are all from the times at which data were taken from experimental cells. Experimental records inB illustrate the increase in peak current amplitude seen immediately after application of 1S,3R-ACPD (compare beforeand first ACPD in B3) and the amplitude reduction and acceleration of inactivation that became evident after a few minutes and was maintained after removal of agonist (after ACPD in B3). Also shown in B3 is the waveform of the ACPD-sensitive current (computed by point-by-point subtraction as the difference between before andafter ACPD traces and multiplied by 3 for clarity), illustrating its progressive increase throughout the duration of the 800-msec-long test pulse. B4, Under normal recording conditions 1S,3R-ACPD increased peak current amplitude to ∼106% of control and reduced current amplitude at the time of repolarization to ∼83% of control. The decrease in current amplitude at the time of repolarization was reflected in an increase in fractional inactivation after exposure to 1S,3R-ACPD (B5). Data are mean ± SD; n = 9 for control,n = 6 for 1S,3R-ACPD.
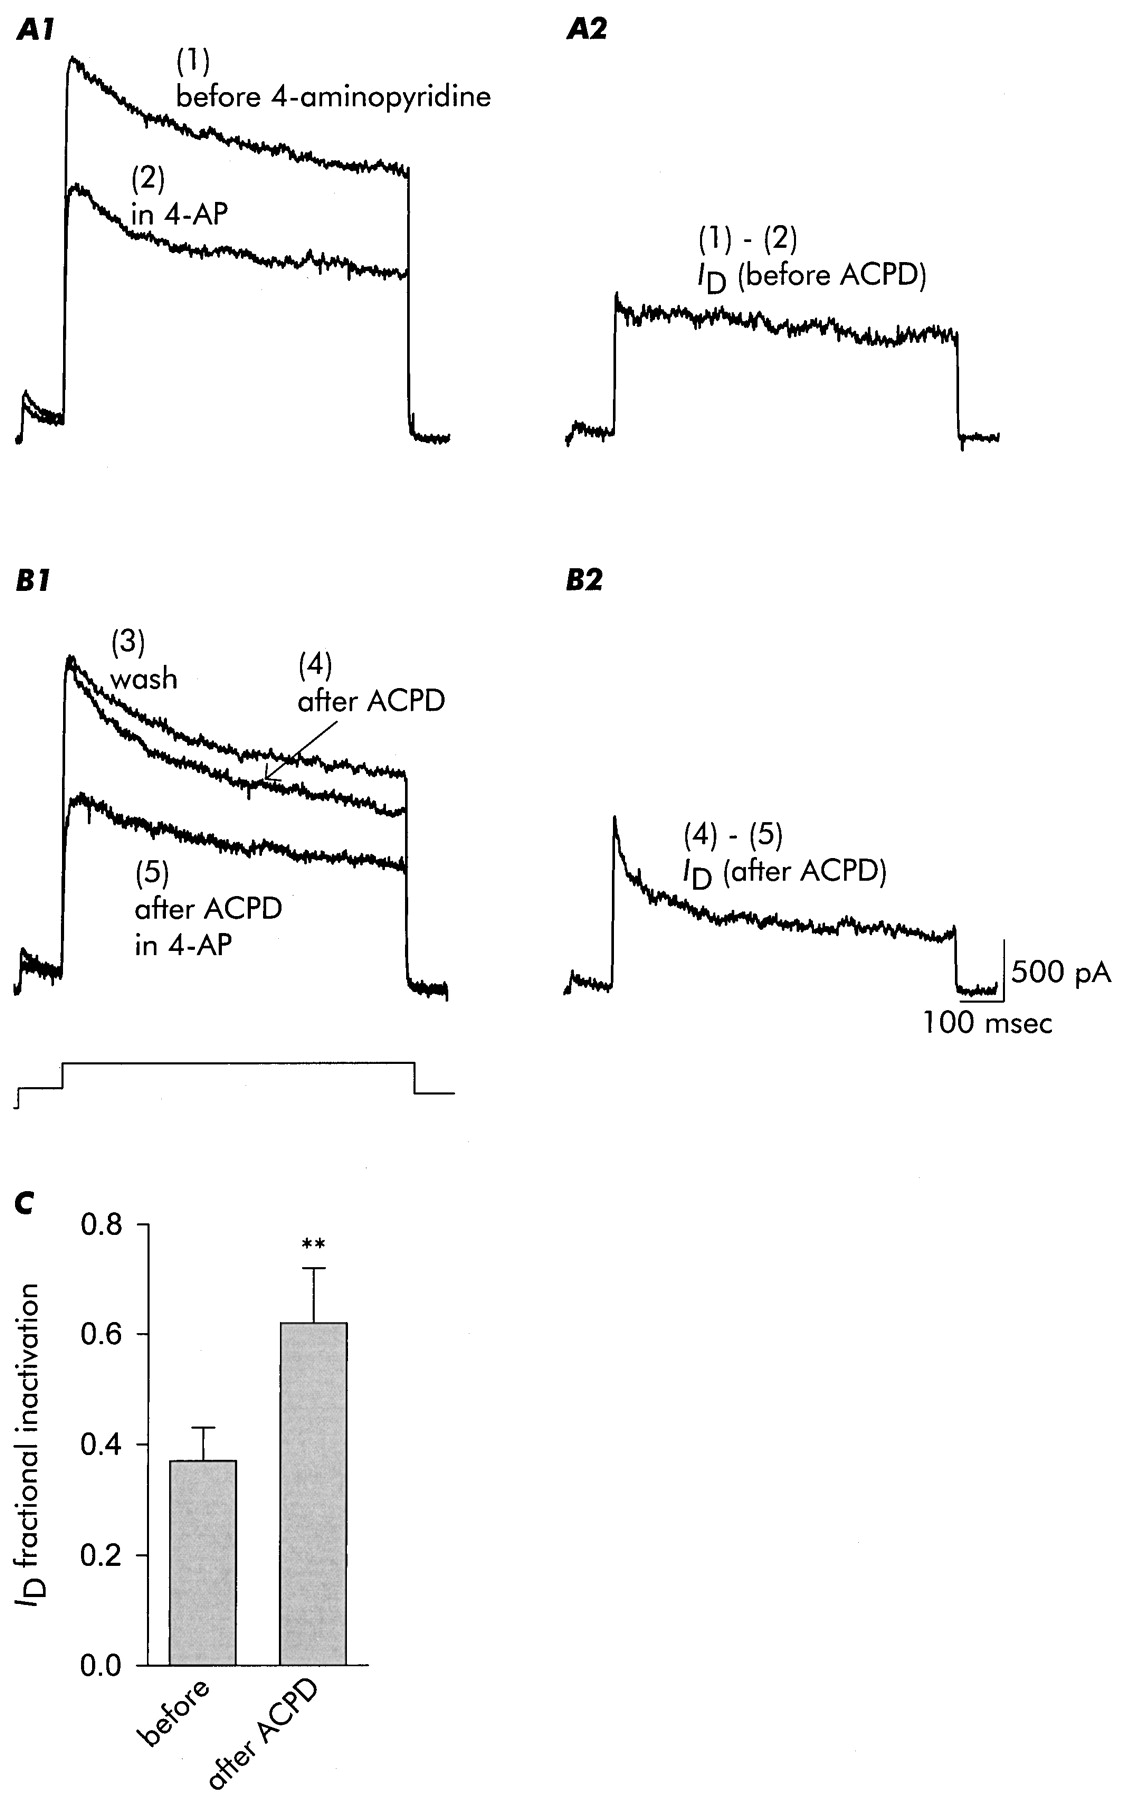
- Fig. 3.
Inactivation ofID, as isolated by its sensitivity to 4-AP (100 μm), is accelerated after exposure to 1S,3R-ACPD. The five traces shown in this figure were acquired in the order indicated from the same neuron.A1, Currents recorded before (trace 1) and in the presence of 4-AP (trace 2).A2, ID isolated by subtraction as the difference between the two traces in A1. B1, After removal of 4-AP and recovery of outward current (trace 3), the neuron was exposed to 1S,3R-ACPD for 3 min as in the previous figure. After removal of 1S,3R-ACPD, inactivation of outward current was enhanced (trace 4). Outward current was then recorded in the presence of 4-AP (trace 5). B2,ID, again isolated as the 4-AP-sensitive current [trace (4) - (5)], inactivates more rapidly after exposure to 1S,3R-ACPD. C, Increase in fractional inactivation of ID, isolated by subtraction in each case, after exposure to 1S,3R-ACPD. Data are mean ± SD;n = 4.
- Fig. 4.
After block ofID, 1S,3R-ACPD-induced changes in outward current inactivation were occluded. A1, A2, In the presence of 4-AP (200 μm), an increase in outward current was observed in the presence of 1S,3R-ACPD, but no acceleration of delayed current inactivation or reduction of current amplitude at the time of repolarization was observed. B1, B2, TEA (1.5 mm) also occluded 1S,3R-ACPD-induced changes in delayed current inactivation but spared the initial current increase. Data are mean ± SD; n = 5 for 4-AP,n = 3 for TEA.
- Fig. 5.
Recovery from inactivation, in contrast to onset of inactivation, was not affected by 1S,3R-ACPD. A two-pulse protocol was used in which an initial 750-msec-long conditioning depolarization to +40 mV (to induce inactivation) was followed, at intervals incremented by 15 msec during which the cell was held at −120 mV, by a 150-sec-long test depolarization (see pulse schematic). Although inactivation was clearly accelerated by exposure to 1S,3R-ACPD (the dotted trace in A2 is a control trace from A1 for reference), the time course of recovery from inactivation was not altered (B). Data are mean ± SD; n = 4 for control,n = 4 for 1S,3R-ACPD.
- Fig. 6.
Evaluation of G-protein analogs on the actions of 1S,3R-ACPD. A1, A2, Inclusion of the nonhydrolyzable analog GTPγS (250 μm) in the internal solution resulted in almost maximal acceleration of delayed current inactivation immediately on application of 1S,3R-ACPD. B1, B2, In contrast, inclusion of the nondisplaceable analog GDPβS (500 μm) in the internal solution blocked any actions of 1S,3R-ACPD. Data are mean ± SD;n = 5 for GTPγS, n = 5 for GDPβS.
- Fig. 7.
Effects of 1S,3R-ACPD were not observed when agonist was applied in the presence of the broadly acting mGluR antagonistS-MCPG (1 mm). The small reduction in steady-state current (after ACPD; A), although seen consistently (B), was not statistically significant. Data are mean ± SD;n = 4.
- Fig. 8.
Evaluation of agonists acting preferentially on group I (3,5-DHPG), group II (DCG-IV), or group III (L-AP4) mGluRs.A1, A2, Application of 3,5-DHPG (100 μm) resulted in acceleration of inactivation in the presence of agonist and after its removal. B1, B2, Application of DCG-IV (100 μm) elicited a small increase in delayed current amplitude as well as acceleration of inactivation. In contrast, application of L-AP4 (100 μm) (C1, C2) failed to elicit change either in peak current amplitude or in inactivation rate and current amplitude at the time of repolarization. Data are mean ± SD; n = 9 for 3,5-DHPG, n = 11 for DCG-IV, n= 5 for L-AP4.
- Fig. 9.
Reduction of whole-cell conductance near the resting potential by 1S,3R-ACPD, and occlusion by 4-AP. A, Slope conductance, measured between −60 and −40 mV, before, during, and (3 min) after exposure to 1S,3R-ACPD. B, Occlusion of 1S,3R-ACPD-induced suppression of resting conductance by addition of 4-AP to the external solution. 4-AP reduced whole-cell conductance at voltages positive to approximately −60 mV, and no further change was seen on application of 1S,3R-ACPD. Note that neither 4-AP nor 1S,3R-ACPD induced changes in conductance at voltages negative to −60 mV. Data are mean ± SD;n = 8 for 1S,3R-ACPD,n = 3 for 1S,3R-ACPD in 4-AP.
- Fig. 10.
Exposure to 1S,3R-ACPD ultimately increases pyramidal neuron excitability. A series of short (duration 2.5 msec) depolarizing current injections of increasing amplitude (2, 4, 6, and 8 nA) were delivered, separated by 100 msec. The initial resting potential, −62 mV, is indicated by the dotted line. Before application of 1S,3R-ACPD, only the two largest current injections were sufficient to elicit action potentials. Exposure to 1S,3R-ACPD resulted in a transient hyperpolarization (1.5 min in ACPD), but excitability was reduced even after the return of the resting potential to near its initial value (2 min in ACPD). Note also the enhanced repolarization seen in the action potential recorded after 2 min in ACPD. In thebottom trace, recorded 5.5 min after washing off 1S,3R-ACPD, excitability was enhanced, as judged by the ability of the second current injection to elicit an action potential. The durations of these action potentials were also affected, as illustrated in Figure 12. Records are representative of six neurons that were similarly examined.
- Fig. 11.
Exposure to 1S,3R-ACPD ultimately reduces the delay to onset of repetitive firing in response to sustained depolarizing current injection. Before application of 1S,3R-ACPD, a depolarizing current injection rapidly shifted voltage from the resting potential (−74 mV, indicated by the dotted line) to a slowly rising plateau from which an action potential was eventually generated. In the presence of 1S,3R-ACPD, a small positive shift in the resting potential resulted in initial generation of an action potential during the rapid depolarizing phase, but there was a long delay until the next action potential. After removal of ACPD (2 min wash) the delay to firing was completely eliminated, and the neuron fired steadily during the depolarizing current injection. Note that the response to the hyperpolarizing current injection (−80 mV, indicated by the second dotted line) was not altered during or after exposure to 1S,3R-ACPD. Records are representative of seven neurons that were similarly examined.
- Fig. 12.
Exposure to 1S,3R-ACPD ultimately increases action potential duration. A, Action potentials recorded in response to short (duration 2.5 msec) depolarizing current injections at times equivalent to those presented for the experimental neuron inC. In control neurons action potential waveforms remained stable, and neither resting potential (B1) nor action potential duration (B2) showed spontaneous changes. C, Action potentials recorded before, during, and after exposure to 1S,3R-ACPD, illustrating initial enhancement of repolarization, followed by increase in action potential duration (the trace shown was recorded 18 min after removal of agonist). A transient negative shift in the resting potential was followed by eventual recovery (D1), whereas action potential duration (measured at half amplitude) showed an initial decrease followed by progressive and sustained increase after wash off of 1S,3R-ACPD (D2). Records are representative of three control and four 1S,3R-ACPD-exposed neurons.


