

Abstract
In this paper we show that the discharges of sympathetic neurons innervating an identified peripheral target are driven by multiple oscillators that undergo dynamic synchronization when an entraining force, central respiratory drive (CRD), is increased. Activity was recorded from postganglionic sympathetic neurons (PGNs) innervating the caudal ventral artery of the rat tail: (1) at the population level from the ventral collector nerve (VCN); and (2) from pairs of single PGNs recorded simultaneously using a focal recording technique. Autospectral analysis of VCN activity revealed a more prominent rhythmical component in the presence of CRD than in its absence, suggesting that (1) multiple oscillators drive the discharges of PGNs and (2) these oscillators can be entrained and therefore synchronized by CRD. This interpretation was supported by analysis of the firing behavior of PGN pairs. Autocorrelation and cross-correlation analysis showed that pairs were not synchronized in the absence of CRD but showed significant synchronization when CRD was enhanced. Time-evolving spectral analysis and raster plots demonstrated that the temporal stability of PGN-to-PGN and CRD-to-PGN interactions at a given level of CRD were also dynamic in nature, with stable constant phase relationships predominating as CRD was increased. This is the first reported example of dynamic synchronization in populations of single postganglionic sympathetic neurons, and we suggest that, as in sensory processing and motor control, temporal pattern coding may also be an important feature of neuronal discharges in sympathetic pathways.
- postganglionic sympathetic neuron
- central respiratory drive
- neural oscillator
- synchronization
- entrainment
- blood vessel
- in vivo
- Sprague Dawley rat
Recent evidence indicates that the nervous system may use transient periods of synchronization as an information-encoding mechanism (for review, see Fetz, 1997; Farmer, 1998). This poses questions about the functional importance of synchrony and the nature of the underlying neuronal circuitry. Although this phenomenon has been studied in the CNS, particularly with regard to sensory processing and skeletal muscle motor control (Farmer, 1998), synchronous firing has not been examined in a functionally defined sympathetic pathway where it is likely to have important implications for neuroeffector transmission and consequently the end organ response (Sneddon and Burnstock, 1984; Sjöblom-Widfelt et al., 1990; see also, McAllen and Malpas, 1997). In this paper, using an application of a focal recording technique developed in this laboratory, we test the idea that synchronous neuronal firing is a feature of postganglionic sympathetic neurons (PGNs) innervating an identified blood vessel [the caudal ventral artery (CVA) of the rat tail].
Our previous work revealed that CVA PGN activity exhibits a dominant rhythm (frequency range, 0.4–1.2 Hz): this was given the generic term, T-rhythm (Johnson and Gilbey, 1996). It was observed that the frequency of the T-rhythm could be the same or different from that of the CRD. Importantly, when CRD was absent, the T-rhythm persisted, indicating that it could be generated by autonomous oscillator or oscillators (defined here as an entity or entities with periodic activity) that could be entrained by CRD. This raises important questions about whether the discharges of PGNs are driven by single oscillator obligatorily coupled oscillators or multiple independent oscillators and whether these discharges can be synchronized through entrainment by CRD. The oscillator substrate might be the PGNs themselves or antecedent neuronal oscillators and/or oscillating neural networks (for review, see Selverston and Moulins, 1985; Marder and Calabrese, 1996). In this study, by recording both population and single PGN activity, we sought to discriminate between a single/obligatorily coupled versus multiple oscillator model of T-rhythm generation and investigated the temporal relationship of PGN to PGN and CRD to PGN activity.
Population activity was recorded from the ventral collector nerve (VCN), which contains ∼80% of the PGN axons that innervate the CVA (Sittiracha et al., 1987). The absence of a rhythmical component would be consistent with the idea that the discharges of PGNs are driven by separate oscillators with little or no global synchronization. We also recorded from pairs of PGNs using the focal recording technique, which enabled the findings of the whole-nerve analysis to be tested at the level of “target identified” PGNs. In both whole-nerve and paired recordings we manipulated CRD to investigate whether dynamic synchronization of rhythmical PGN activity can occur through entrainment.
The findings of this study demonstrate that the rhythmical discharges of PGNs innervating a blood vessel can arise from multiple oscillators that can be entrained by a periodic neural activity, CRD. These results show for the first time that like, for example, cortical neurons in the CNS, rhythmical discharges of PGNs are capable of dynamic synchronization. In the same way that temporal coding in the CNS is thought to be important in sensory processing and skeletal muscle motor control, we suggest that dynamic synchronization of PGN activity may have significant functional implications for sympathetic cardiovascular control.
Part of this work has been published previously as abstracts (Chang and Gilbey, 1998; Chang et al., 1998a,b).
MATERIALS AND METHODS
General preparation and maintenance
Experiments were conducted on 33 male Sprague Dawley rats (255–355 gm) anesthetized initially with sodium pentobarbitone (60 mg/kg, i.p.) supplemented with α-chloralose (5–10 mg, i.v.) when required. Anesthetic level was monitored, and an appropriate depth was indicated by the stability of blood pressure and phrenic nerve (PN) activity and the absence of both corneal and paw-pinch withdrawal reflexes. The femoral artery and vein were cannulated for recording blood pressure and infusing drugs, respectively. The trachea was cannulated. The oesophageal temperature was monitored and maintained at 36.5–37°C using a heating blanket (and/or a lamp). The urinary bladder was cannulated to ensure an unobstructed urine flow. Figure1 summarizes the main surgical procedures performed.

The experimental preparation and signal processing procedures used for recording neural activities. The femoral artery/vein, trachea, and urinary bladder of the rats were cannulated. A pneumothoracotomy was performed, and the vagi were cut (not shown) in the experiments in which animals were ventilated artificially. Whole-nerve activity of PN was recorded from the neck. Activity was recorded from the VCN in the tail by cutting the nerve and placing the cut ends on bipolar electrodes (top insert). The cauda equina was transected in the VCN whole-nerve experiments (not shown). It should be noted there is one VCN on either side of the tail, but only the right one is shown here for simplicity. Single PGN activity was recorded from the surface of the CVA through a focal suction glass microelectrode (bottom insert). Two focal electrodes were used simultaneously in most experiments in which two PGNs were recorded, but only one is shown here for simplicity. For PN and VCN activity, the raw activity was filtered, rectified, and smoothed, and spectral analysis was performed on this smoothed data. TTL pulses representing the rising (inspiratory) phase of PN activity were generated from the smoothed data using a low-frequency threshold trigger interface. For PGN activity, the raw signal was filtered and passed through a window preset in a spike processor to generate TTL pulses. For further details, see Materials and Methods.
In experiments in which rats were artificially ventilated (n = 25), vagotomies and pneumothoracotomies were performed (Fig. 1), and an end-expiratory pressure (2–3 cm H2O) was applied to prevent atelectasis. During periods of data collection, animals were paralyzed (gallamine triethiodide, 15 mg · kg−1 · hr−1), and the depth of anesthesia was assessed by monitoring the stability of the blood pressure and phrenic discharges. Blood gas samples were taken immediately before data were collected. In experiments performed on spontaneously breathing rats (n = 8), the vagi were left intact, and the animals were supplied continuously with O2-enriched room air.
In all animals, peak expiratory CO2 was monitored in every breath using a CO2 meter (model FM1; The Analytical Development Company). Arterial blood gases were sampled regularly (0.5–1 hr) using a blood gas analyzer (model M238; Ciba-Corning Ltd.), and if necessary sodium bicarbonate (1 m) was given to counter metabolic acidosis. PN activity was recorded routinely in all preparations, and the inspiratory-related activity was taken as an indication of CRD (Johnson and Gilbey, 1994, 1996).
Recording from the VCN
The VCNs are mixed nerves that contain both sympathetic and somatic sensory–motor axons. The central connection of somatic motor efferents projecting through the VCNs were interrupted by cutting the cauda equina at the L5 level, thereby leaving only sympathetic efferents intact (Sittiracha et al., 1987; Smith and Gilbey, 1998a;Smith et al., 1998). A VCN was then exposed, cut, and desheathed. Monophasic activity was recorded differentially by placing the central and peripheral nerve ends on bipolar platinum electrodes in a paraffin oil-filled bath (Fig. 1). The peripheral nerve end was crushed. In ten experiments, the sympathetic nature of VCN activity was confirmed by the abolition of ongoing nerve activity after intravenous injection of the ganglionic blocker chlorisondamine (3 mg/kg).
Focal recording of the activity of PGNs
Glass microelectrodes (internal diameter of the tip, 20–100 μm), filled with Krebs’ solution, were placed on the surface of the CVA, and gentle suction was applied to “seal” the tip (Johnson and Gilbey, 1994, 1996). The discharges of two PGNs were either recorded simultaneously through two independent electrodes or discriminated from multiunit activity recorded through one electrode. Previous studies have confirmed that all units recorded from the surface of the CVA are sympathetic in nature with characteristic discharge patterns (Johnson and Gilbey, 1994, 1996). Activity from single PGNs was identified by a consistent spike waveform and amplitude. In each experiment in which paired recordings were made, we were careful to establish that the latency between the firing of the two PGNs was not constant, because this would be evidence that both recordings arose from the same PGN (either its axon or branches). Although constant latency firing was occasionally seen in single-patch recordings between pairs of “PGNs” (and these were therefore discarded), the latency between PGNs recorded from separate electrodes (physical separation, 2.5–5.5 cm) was always variable.
Data collection
All neuronal activity was recorded using high impedance headstages (model NL100; Neurolog, Digitimer Ltd), amplified (model NL104; Neurolog) and filtered (bandpass 300–1 kHz; model NL125; Neurolog). PN activity and VCN activity were rectified and smoothed (Fig. 1) with a “leaky integrator” (time constant: PN, 0.1 or 0.2 sec; VCN, 0.1 sec; model NL703, Neurolog). Such narrow-band filtering followed by rectification and smoothing (or integration) is a well established procedure for generating an envelope of the activity (for examples, see Haselton and Guyenet, 1989; Czyzyk-Krzeska and Trzebski, 1990). One of the main advantages is that it removes movement-related artifacts that frequently appear as slow wave activity (Kenney and Fedde, 1994). However, the filtering causes little attenuation of individual action potentials because the instantaneous frequency of single fiber activity is higher than the high-pass cutoff value (see Fig.7Ai,Aii,Aiii). All data were stored on tape using a video recorder (model V-404B; Toshiba) for off-line analysis. In addition, the blood pressure, tracheal pressure, smoothed phrenic and VCN activity, and single PGN activity were converted into digital signals via an analog-to-digital converter interface (model 1401, Cambridge Electronic Design; sampling frequency: 13.3 kHz for PGN activity; 100 Hz for VCN and PN activity) and sent to a computer for analysis. A spike processor (model D130; Digitiser) and an interface (model NL515; Neurolog) were used to generate transistor-to-transistor logic (TTL) pulses from single PGN action potentials and the rising phase of rhythmical (inspiratory) PN activity, respectively (Fig. 1). These TTL pulses were also sent to the computer and used to generate autocorrelograms, cross-correlograms, and correlation raster plots of PGNs and PN activity (SPIKE2, Cambridge Electronic Design; MATLAB, MathsWorks).
Whole-nerve analysis
Spectral analysis of VCN and PN activity. The presence of rhythmical components in VCN and PN activity and the degree of correlation between them were assessed using spectral analysis. A 480 sec data set of integrated nerve activity was sampled at 100 Hz and divided into 45 half-overlapped subsections with 2048 data points in each. The linear trend was removed in each subsection. The autospectrum and cross-spectrum averaged from these subsections were calculated according to the Welch Method (size of fast Fourier transformation, 2048) (Bendat and Piersol, 1986). The autospectrum, plotted as relative power density (RPD) against harmonic frequencies, was only displayed between 0 and 5 Hz because the power at frequencies above this level was negligible. The coherence spectrum was used to investigate the linear correlation between PN and VCN activity at different frequencies. The squared coherence coefficient (abbreviated as coherence) at each harmonic frequency was estimated by normalizing the cross-spectrum between the PN and VCN activity (Bendat and Piersol, 1986).
Assessing temporal changes in VCN activity. Time-evolving autospectra were generated to examine temporal changes in VCN and PN activity. A 480 sec data set was divided into twelve 40 sec segments, and spectral analysis was performed on each. The magnitude of the RPD for each segment was then coded using a 64-grade gray scale. The time-evolving spectrum was plotted as harmonic frequency against time history. Changes in the gray scale represent the change of the RPD across both the recording time and frequency range. To quantify the dynamic change of the RPD, the time evolving autospectrum was normalized by its maximal value, and the sum of RPD variance of all the frequencies across the twelve 40 sec segments was taken as a measure of the stability of VCN activity.
Single-unit analysis
T-rhythm frequency determination. For event series composed of PGN or PN occurrences, the event-triggered cumulative histograms, correlograms, were used to assess the correlation of occurrences between neural activities (Perkel et al., 1967a,b). For autocorrelograms the histograms are self-triggered, and for cross-correlograms the trigger events and the dependent events come from different event series. Series of 300 sec data sets of neuronal activity were used to generate autocorrelograms and cross-correlograms. The 5 sec post-trigger period in the autocorrelogram was inspected visually to establish the presence of a dominant rhythmicity. The exact frequency was determined from the spectrum of the envelope of the autocorrelogram across the 300 sec post-trigger interval as follows: the envelope of the autocorrelogram (bin width, 0.05 sec; duration, 300 sec) was first smoothed using a moving average method [weight factor, (0.15, 0.2, 0.3, 0.2, 0.15)]. The gain of the frequency response function of this moving average process was monotonically decreased, and there was no net phase shift in the frequency range in which we were primarily interested (0–5 Hz). Consequently, the rhythmical components in the envelope are not artifacts arising from the smoothing process (“Slutsky effect”, see Koopmans, 1995). The smoothed envelope of the autocorrelogram was subjected to spectral analysis using a similar method to that described for VCN and PN activity (sampling rate, 20 Hz; fast Fourier transformation size, 1024). Because the bin width of the discrete spectrum is 0.02 Hz, the frequencies of two PGN T-rhythms were considered to be the same if the difference between them was <0.02 Hz.
Evaluation of synchronization between two PGNs (represented by PGN→PGN). By definition, synchronization is a state of constant phase difference between two activities (Winfree, 1980). If the phase difference between two rhythmical activities, such as PGNs, is constant, a periodic pattern will appear on their cross-correlogram. Thus, in this study, the state of PGN→PGN synchronization, termed rhythmical synchronization, is assessed by the cross-correlogram (divided into 200 bins, bin-width, 0.05 sec). To quantify the degree of synchronization, the spectrum of the envelope of the cross-correlogram was generated using a method analogous to that described for autocorrelogram spectral analysis. The RPD of the dominant peak shown on the envelope spectrum was taken and used as a measure of synchronization. As a gauge of the significance of the rhythmicity in each cross-correlogram, we calculated a 95% confidence interval, based on a novel analysis method described below.
The confidence interval is calculated for a single peritrigger bin. When there are N triggers, the random variable,Xij (i = 1, 2… Nand j = 1,2,… 200) represents the number of dependent events in the jth peritrigger bin after theith trigger. In total, there are 200 * N random variables. The null hypothesis for the statistical inference is: all the Xij random variables are independent and identically distributed with finite variance. The random variable,Yi = Σ Xij(j = 1… N), represents the number of events in the ith bin in the cross-correlogram. If N > 30, the distribution ofYi is approximately normal according to the central limit theorem (Papoulis, 1991). The parameters to be estimated are the expectation and the variance of Yi.E(Yi) = E(ΣXij) = ΣE(Xij) (j = 1… N). Var(Yi) = Var(ΣXij) = Σ Var(Xij) (j = 1… N). The estimators ofE(Xij) and Var(Xij) are the unbiased sample mean,mx, and variance,s2x, calculated from the empirical data (200 * N samples,xij, i = 1, 2,…N; j = 1,2,… 200). The 95% confidence interval for Yi is [−1.96 * (N *s2x)1/2 +N * mx, 1.96 * (N *s2x)1/2 +N * mx]. This confidence interval is applied to all the Yis because the distributions of the Yi (i = 1… 200) are identical under the null hypothesis. It should be noted that it is possible for the event number in several bins (5% of 200) to exceed the 95% confidence interval by chance. In this study we were concerned primarily with the rhythmical T-rhythm oscillator or oscillators, and we define significant synchronization between two neural activities as the existence of rhythmicity in the envelope of the cross-correlogram in which the peaks and/or troughs exceed the 95% confidence interval.
Assessing temporal changes in synchronization. PGN→PGN correlation raster plots were used to elucidate dynamic temporal changes in synchronization between PGNs. The raster plot, as with the cross-correlogram, shows the temporal relationship between the triggers and dependent activity, but differs because the peritrigger event series are plotted against each trigger. To quantify the stability of the phase relation between two PGNs, the raster plot was divided into small quadrats (0.1 sec × 10 trigger events), and the number of events in each (the event density) was counted. The event density was normalized by the maximal event density in all the quadrats. The sum of the normalized event density variance at each peritrigger time across the trigger occurrences represents the inhomogeneous phase change across time (termed density variance). If the phase difference remains relatively constant across time, a dense vertical striation will be present on the raster plot against a low-density background. The RPD of the cross-correlogram envelope (spectral density) provides a measure of the density of the rhythmical vertical striation. The parameter, density variance/spectral density, termed the phase variation factor, is a measure of the level of unstable rhythmicity plus the degree of variation of phase difference across time and was taken to assess the stability of rhythmical synchronization between two PGNs.
Experiment protocol
Manipulating CRD. Activity of the PGNs innervating the CVA was recorded under three conditions, absence of CRD, control, and enhanced CRD. The control condition was achieved by maintaining the blood gas parameters within a normal physiological range (see Results). The absence of CRD (apnea) was induced either by raising the oxygen concentration (60–90%) of the inflow and/or by hyperventilation hypocapnia. CRD was enhanced by raising inspired CO2 to 5% and inducing a hypercapnic state (St-John and Bianchi, 1985).
Whole-nerve experiments. VCN activity was recorded from sixteen animals. Thirteen of these were ventilated artificially, and the other three breathed spontaneously. In each experiment, nerve activity was recorded initially in control conditions. Of the thirteen artificially ventilated rats, eight animals were tested under enhanced CRD conditions and eight in the absence of CRD. Six of the thirteen animals were tested in all three conditions.
Single PGN experiments. Action potentials of single PGNs were recorded from seventeen animals. Twelve of these were ventilated artificially, and the remainder breathed spontaneously. At least one pair of PGNs was recorded in each animal during control conditions. Six artificially ventilated and four spontaneously breathing subjects were tested under enhanced CRD conditions. Neuronal activity was also recorded in six artificially ventilated rats in the absence of CRD. Five of the eleven artificially ventilated animals were tested in all three conditions.
Statistics
Results are expressed as mean ± SD when a parametric test was used or median and interquartile intervals (first and third quartiles) when a nonparametric test was used. Either one-way ANOVA followed by Bonferroni multiple comparison test, Student’s t test, or Wilcoxon rank-sum test was used to assess statistical significance. The comparison was considered to be significant if p < 0.05.
RESULTS
Condition of animals
The animals were maintained in a consistent physiological state in each of the experimental conditions, as indicated by measurements of four parameters. Figure2A summarizes the mean arterial blood pressure (MAP) (Fig. 2Ai), pH (Fig.2Aii), PaCO2 (Fig.2Aiii), and PaO2 (Fig.2Aiv) for the whole-nerve recording experiment for four conditions: artificially ventilated, absence of CRD (AVA); artificially ventilated, control (AVC); artificially ventilated, enhanced CRD (AVE); and spontaneously breathing, control (SBC) animals. Figure 2, Bi–Biv, summarizes the same parameters for the single PGN recording experiments for the four conditions stated above plus an additional condition: spontaneously breathing, enhanced CRD (SBE).

Physiological parameters under different experimental conditions. Conditions: AVA, AVC, AVE, SBC, and SBE. A, Whole-nerve experiments.AVA, n = 8; AVC,n = 13; AVE, n = 8; and SBC, n = 3. B, Single PGN experiments. AVA, n = 6;AVC, n = 13; AVE,n = 6; SBC, n = 6; SBE, n = 4. Ai, Bi, MAP. Aii, Bii, pH. Aiii, Biii, PaCO2. Aiv, Biv, PaO2. Data are presented as mean ± SD. Statistical differences between the three subgroups of artificially ventilated animals were assessed using ANOVA followed by Bonferroni multiple comparison tests. A Student’s t test was used to test the difference between the two subgroups in spontaneously breathing animals. Parameters that are significantly different from control conditions are indicated by an asterisk(*p < 0.05).
Whole-nerve activity recorded from the VCN in artificially ventilated animals
Rhythmical and sympathetic nature of VCN activity
The nerve activity recorded from the VCN appeared as burst discharges with variable frequency and amplitude. A typical example (artificially ventilated, control) is shown in the neurogram in Figure3A. The major rhythmical component of the activity is revealed by the presence of a prominent peak at 0.63 Hz in the autospectrum (Fig. 3Bi). To establish the sympathetic nature of VCN activity, we tested the effect of the sympathetic ganglionic blocker chlorisondamine on the activity (n = 10). In all cases, this led to abolition of most of the activity and power in the autospectra (Fig.3,Bii,C).

The bursty and sympathetic nature of the VCN activity in an artificially ventilated animal under control conditions.A, Rectified and smoothed neurogram of VCN activity shows burst discharges with variable frequency and amplitude.Bi, Autospectrum of VCN activity shows a peak at 0.63 Hz with its first harmonic peak at 1.26 Hz. Bii, Autospectrum of activity of the same VCN in Bi, after chlorisondamine (3 mg/kg, i.v.), a sympathetic ganglionic blocker. The abolition of the peaks after this treatment shows that the nerve activity was sympathetic in nature. C, Real time neurogram of the same VCN activity before and after application of chlorisondamine.
Synchronous components in VCN activity become more prominent with increased CRD
VCN activity was recorded in animals under three different respiratory conditions, absence of CRD, control, and enhanced CRD. In each condition, autospectra for VCN and PN activity were generated, and coherence spectra were produced to identify correlated components in their activity. Here, the results are presented first in the absence of CRD, then control, and finally enhanced CRD, to emphasize the trend toward synchronization with increasing CRD.
In animals in which the CRD was abolished, a single prominent peak (median, 0.83 Hz; interquartile interval, 0.79–0.88 Hz) was observed in the VCN autospectra in all cases (n = 8). This peak is in the frequency range of the T-rhythm (Johnson and Gilbey, 1996), and we refer to it in this paper as the T-peak. A typical example, in which the T-peak frequency is 0.82 Hz, is shown in Figure4Ai. The absence of CRD is indicated by the flatness of the autospectrum of the PN (Fig.4Aii), and the lack of correlation between VCN and PN activity is shown by the coherence spectrum (Fig.4Aiii).

The autospectra and coherence spectra of the VCN and PN in an artificially ventilated animal under three conditions of CRD. A, Absence of CRD. Ai, Autospectrum of VCN activity reveals a peak at 0.82 Hz. Aii, Autospectrum of PN activity shows no rhythmical components.Aiii, The coherence spectrum of VCN and PN shows lack of correlation between the two nerves. B, Control condition. Bi, Autospectrum of VCN activity shows two peaks, one (filled circle) at 0.59 Hz was the same as the frequency of CRD, revealed in the autospectrum of the PN (Bii) and a second, (asterisk) at 0.79 Hz. Bii, Autospectrum of PN activity.Biii, The coherence spectrum between VCN and PN reveal high coherence at the frequency of CRD. C, Enhanced CRD.Ci, Autospectrum of VCN is dominated by a peak at 0.63 Hz (and its first harmonic component), which is the same as the frequency of CRD. Note the scale of relative power density is different from that in Ai and Aii. Cii, Autospectrum of PN activity. Comparison of the relative power density of the peak with control conditions shows that the level of CRD was increased.Ciii, VCN and PN activity show a high coherence.
Thirteen animals were examined under control conditions. In six (46%) of these, the VCN autospectra revealed a T-peak (median frequency, 0.79 Hz; interquartile interval, 0.74–0.82 Hz). Statistical comparisons between animals in the absence of CRD and in control conditions (in which a discrete T-peak was present) demonstrated that the T-peak frequencies were not significantly different (p= 0.44; Wilcoxon rank-sum test). In twelve (92%) of the animals, a peak at the CRD frequency was present (median frequency, 0.63 Hz; interquartile interval, 0.59–0.68 Hz). The coherence at the frequency of CRD between VCN and PN activity, revealed by the coherence spectrum, was high (median, 0.73; interquartile interval, 0.63–0.88). The VCN autospectrum from one of the animals displaying both the T-peak and the respiratory-related peak is shown in Figure 4Bi (this is the same animal as in Fig. 4A). The first peak at 0.59 Hz (filled circle) corresponds to the main peak in the PN activity (Fig. 4Bii), and this is confirmed by the coherence spectrum shown in Figure4Biii. The additional peaks in the PN autospectrum are harmonics of the first peak, and these also display high coherence with VCN activity. Lack of coherence between VCN and PN at the frequency of the second peak (asterisk, 0.79 Hz) was also demonstrated in Figure 4Biii.
A condition of enhanced CRD was induced in a subset of the animals (n = 8) examined in control conditions. In all cases, there was a prominent respiratory-related peak in the VCN autospectra (median frequency, 0.59 Hz; interquartile interval; 0.53–0.63 Hz) that showed a very high coherence with the phrenic autospectra (median coherence, 0.90; interquartile interval, 0.76–0.92). In two (25%) of the animals there was also a separate T-peak (frequency, 0.73 and 0.68 Hz, respectively). The RPD of the respiratory-related peak when the CRD was enhanced (median of the RPD, 14.2; interquartile interval, 9.75–19.8) was higher than that of the T-peak when CRD was abolished (median of the RPD, 4.14; interquartile interval, 3.7–6.4) (p < 0.02; Wilcoxon rank-sum test). This suggests that the dominant rhythmical activity became more prominent when the condition was switched from absence of CRD to enhanced CRD. A typical example of the VCN autospectrum in an animal with enhanced CRD is shown in Figure 4Ci (this is the same animal as in Fig.4A,B). There is a prominent peak at 0.63 Hz that has a high coherence with the PN discharge (Fig.4Cii,Ciii); other peaks at harmonic frequencies of PN activity are also visible.
Stability of VCN rhythmical activity increases when the CRD is enhanced
VCN activity was also examined using time-evolving autospectra, which provide information about the dynamics of the rhythmicity across time. When the CRD was abolished, VCN rhythmical activity was relatively unstable (see below). The example shown in Figure5Ai (same animal as in Fig.4), shows a band containing relatively high- and low-density components at the T-rhythm frequency, indicating periods of strong and weak synchrony of rhythmical firing in the PGN population. No prominent bands were visible in the phrenic time-evolving autospectra confirming that CRD was abolished (Fig. 5Aii). In control conditions, as shown in the example in Figure 5Bi (same animal as in Fig. 4), the VCN band was dense and more stable across time than in CRD-abolished conditions. Part of the prominent dense band in VCN activity fell within the frequency range of the band observed in the phrenic time-evolving autospectra (Fig. 5Bii). However, although the phrenic activity produced a dense, stable band, the VCN showed transient periods in which band density was reduced, indicating periods of frequency drifting. In conditions of enhanced CRD, the VCN time-evolving autospectra (example in Fig. 5Ci from the animal shown in Fig. 5B,C) was similar to the phrenic autospectra (Fig. 5Cii), exhibiting stable dark bands at the phrenic frequency and its harmonics. This suggests that a substantial proportion of the PGNs were entrained with phrenic activity throughout the time period examined. The level of stability in each condition was quantified using a measure of the power density variance across time (see Materials and Methods). The data are summarized for the absence of CRD (n = 8), control (n = 13), and enhanced CRD (n = 8) groups in Figure 6. Comparisons between conditions of absent CRD and enhanced CRD revealed a significant difference (p < 0.05; Wilcoxon rank-sum test).

Time-evolving autospectra of the VCN and PN under three conditions of CRD from the same animal and across the same time periods as in Figure 4. The data were divided into twelve 40 sec subsections. Spectral analysis was performed on each subsection. The relative power density across time is coded by a 64 grade gray scale (note scale bar on right of each figure is different).A, Absence of CRD. Ai, VCN autospectrum shows that the relative power of the VCN was concentrated at a band around 0.82 Hz, but the power density varied across time.Aii, PN autospectrum shows little or no power across time. B, Control condition. Bi, VCN autospectrum shows that the power of the VCN is concentrated in a relatively well defined band between 0.54 and 1.05 Hz, including the frequency of CRD (0.59 Hz, see Bii). It should be noted that the two dominant peaks of the VCN autospectrum revealed in Figure4Bi are not constant across time; it is a feature arising from dynamic change of the power density within the narrow frequency band. Bii, PN autospectrum. C, Enhanced CRD. Ci, VCN autospectrum reveals that the relative power density of the VCN is very constant across time and centered at the frequency of CRD (0.63 Hz; Cii).Cii, PN autospectrum.
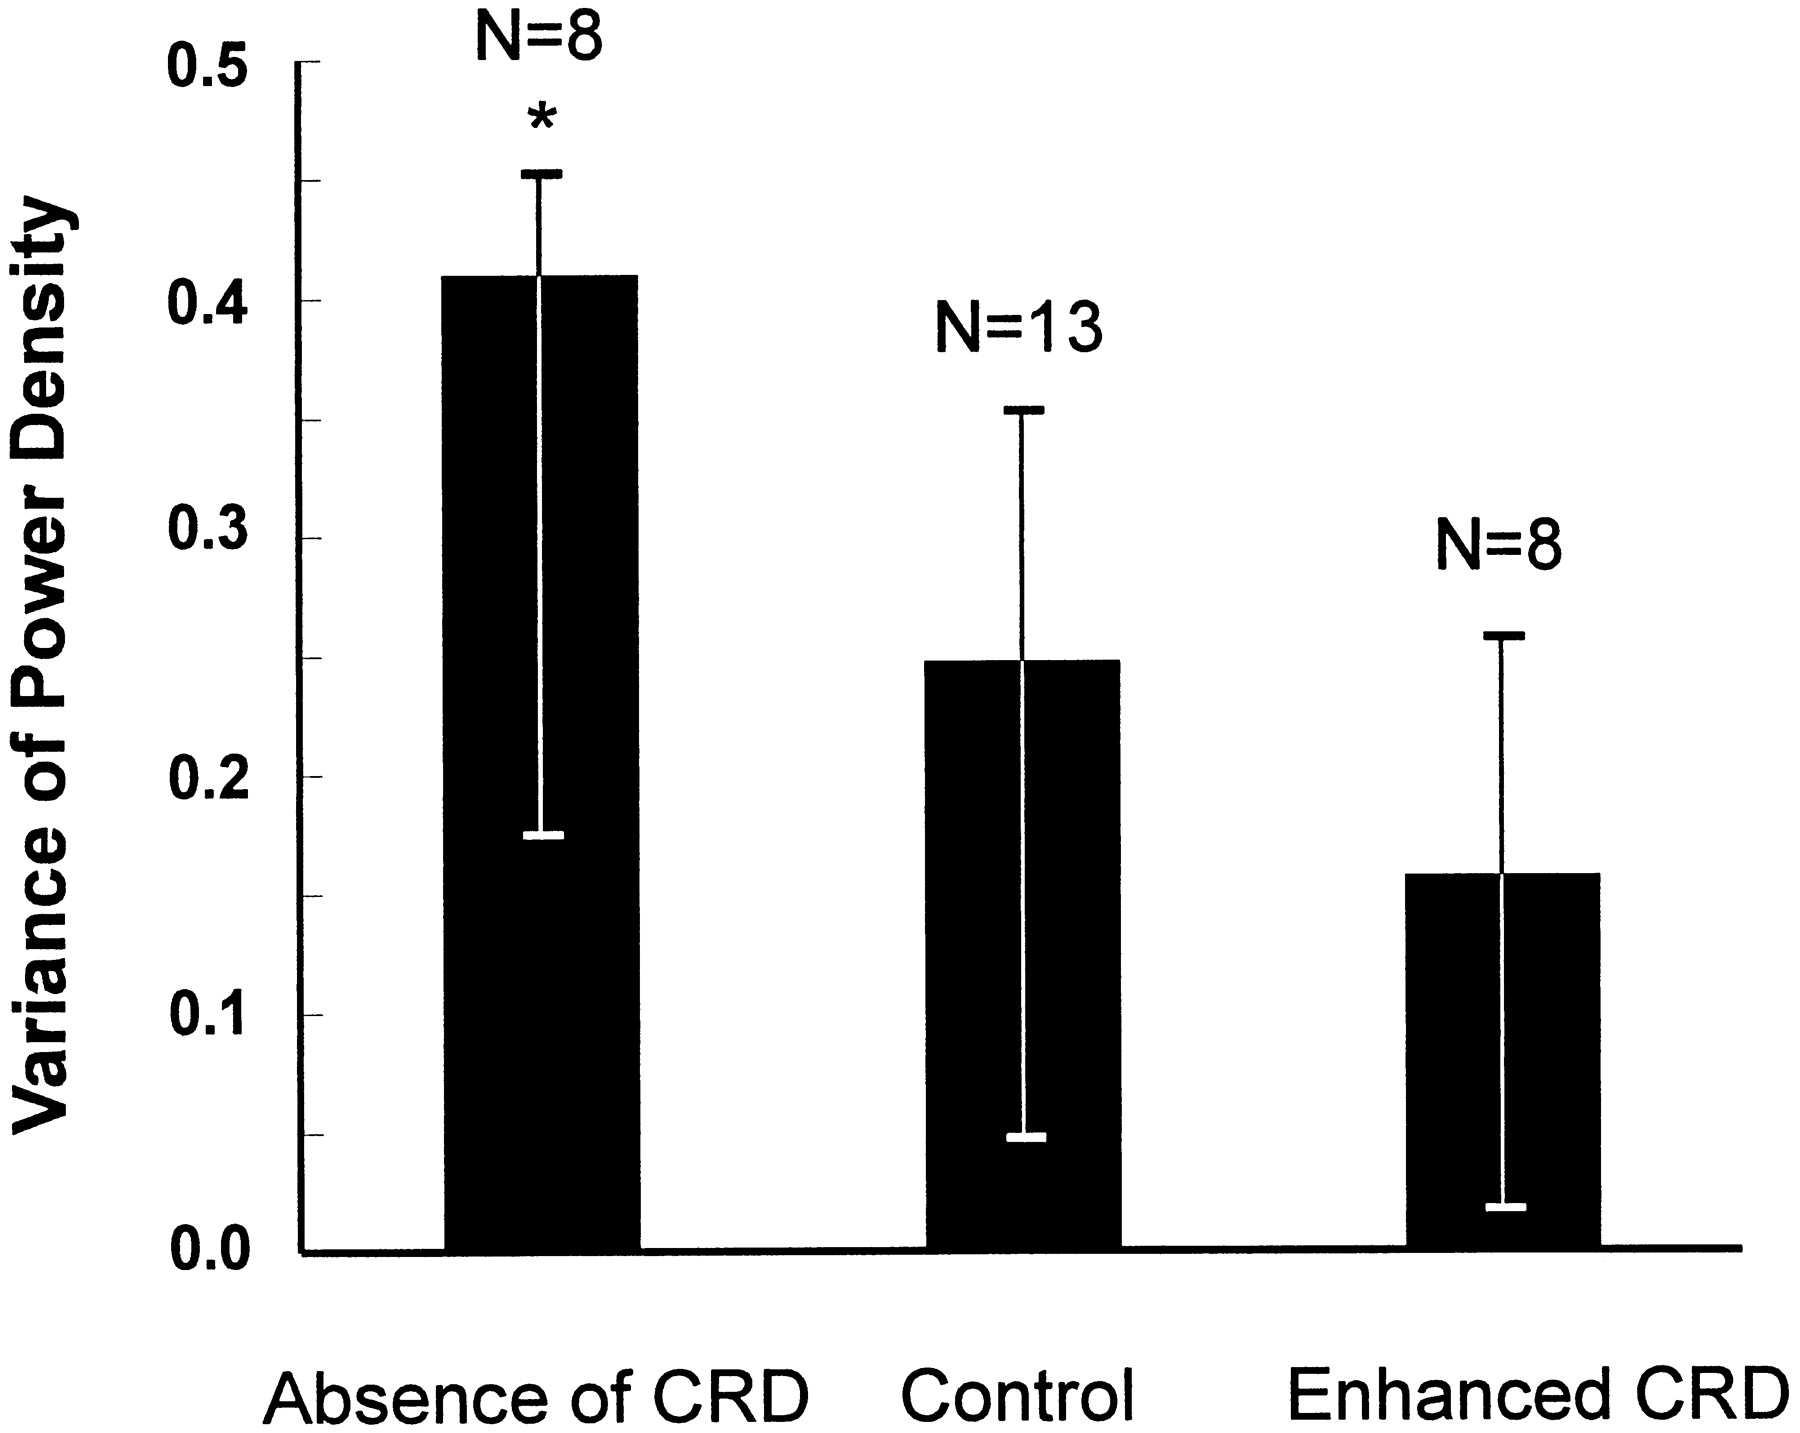
Dynamic stability of rhythmical components evaluated by the variance of the relative power density of VCN activity across time in artificially ventilated animals under three conditions of CRD. Data are presented as medians and first and third quartiles. The level of power density variance is inversely proportional to the level of stability. The asterisk indicates that the power density variance in the absence of CRD is significantly higher than the variance in conditions of enhanced CRD (Wilcoxon rank-sum test; *p < 0.05).
Whole-nerve activity recorded from the VCN in spontaneously breathing animals
Three animals were recorded under spontaneously breathing conditions to determine whether VCN activity behaved in a similar way to that seen in artificially ventilated animals. In all three, the VCN autospectra revealed a T-peak with a median frequency of 0.6 Hz (interquartile interval, 0.56–0.66 Hz) and a second peak with a median frequency of 0.93 Hz (interquartile interval, 0.9–1.1 Hz) that showed high coherence with the PN activity (median, 0.52; interquartile interval, 0.51–0.62). We concluded that in spontaneously breathing animals, VCN activity included rhythmical components similar to those identified in artificially ventilated preparations.
Paired recordings of PGNs innervating the CVA in artificially ventilated animals
In the absence of CRD, the T-rhythms seen in PGNs recorded simultaneously show a low probability of synchronization
The activity of six pairs of PGNs (six animals), each from separate electrodes, were recorded in the absence of CRD. The discharges of individual PGNs, examined by generating autocorrelograms, were rhythmical in nature. The median frequency of the T-rhythm was 0.61 Hz (interquartile interval, 0.55–0.68 Hz). Although the activity of all PGNs showed a dominant peak in the range of T-rhythm frequency in the envelope spectrum (median of RPD, 4.9; interquartile interval; 3.7–5.8), neither of the PGNs in a pair had the same T-rhythm frequency, and cross-correlogram analysis revealed that no significant synchronization was displayed in PGN→PGN activity.
Figure 7, Ai andAii, shows ten superimposed action potentials for each of a pair of PGNs, illustrating the consistency of the spike shape and amplitude. A section of the real time neurograms of these two PGNs and PN is shown in Figure 7Aiii. The autocorrelograms from these two PGNs, in the absence of CRD, are shown in Figure 7, Biand Bii. These PGNs both exhibit characteristic rhythmicity, but the frequencies are different (0.55 Hz for PGN1; 0.70 Hz for PGN2). The PGN1→PGN2 cross-correlogram shown in Figure8A does not show a significant rhythmicity (i.e., peaks passing through the 95% confidence level at regular intervals), demonstrating that the rhythmical component of the discharges of this pair of PGNs is not synchronized.

Neurograms and frequency relationships of two PGNs and PN activity recorded simultaneously in an artificially ventilated animal under three conditions of CRD. Ai,Aii, Ten superimposed spikes recorded from the PGNs demonstrate the consistency of the shape and amplitude of the action potentials. Aiii, Typical example of a real time neurogram showing the temporal relationship between PGN and PN activity under control conditions. B–D, The autocorrelograms and the spectra of the autocorrelogram envelopes (insets) of the PGN and PN activity. The envelope spectra, displayed as frequency versus RPD, were used to assess the frequency of the T-rhythm (see Materials and Methods). The dashed lines across the spectra allow comparisons between the frequencies of the T-rhythms and PN activity. B, Absence of CRD. Bi, PGN1 autocorrelogram (167 triggers) and spectrum. Bii, PGN2 autocorrelogram (252 triggers) and spectrum. C, Control condition. Ci, PGN1 autocorrelogram (199 triggers) and spectrum. Cii, PGN2 autocorrelogram (298 triggers) and spectrum. Ciii, PN autocorrelogram (227 triggers) and spectrum. D, Enhanced CRD. Di, PGN1 autocorrelogram (235 triggers) and spectrum. Dii, PGN2 autocorrelogram (324 triggers) and spectrum. Diii, PN autocorrelogram (215 triggers) and spectrum.

Rhythmical PGN→PGN and PN→PGN synchronization revealed by cross-correlograms under three conditions of CRD. The PGNs and the period of analysis are the same as in Figure 7. If rhythmical synchronization exists between two neural activities, a periodic pattern should be observed in the cross-correlogram. The dashed lines in the cross-correlograms define the upper and lower limits of the 95% confidence interval. In this study, we were interested in the significance of correlation only when there was a periodic pattern in the cross-correlogram because uncorrelated activities may occasionally exceed the confidence interval by chance (see Materials and Methods). A, Absence of CRD. PGN1→PGN2 cross-correlogram, no rhythmical synchronization was present in the absence of the CRD. B, Control condition.Bi, PGN1→PGN2 cross-correlogram, no rhythmical synchronization was present. Bii, PN→PGN1 cross-correlogram and Biii, PN→PGN2 cross-correlogram show that significant rhythmical synchronization was present.C, Enhanced CRD. Ci, PGN1→PGN2 cross-correlogram, a significant periodic pattern appeared in the cross-correlogram, indicating rhythmical synchronization.Cii, PN→PGN1 cross-correlogram andCiii, PN→PGN2 cross-correlogram show that the rhythmical synchronization between PGNs and PN are prominent.
In control conditions some pairs show PGN→PGN synchronization through entrainment by CRD
The activity of pairs of PGNs (thirteen from twelve animals) were recorded in control conditions, either using separate electrodes (n = 9) or discriminated from multiunit activity recorded through a single electrode (n = 4). All the PGNs displayed a T-rhythm with a median frequency of 0.72 Hz (interquartile interval, 0.66–0.75 Hz). The spectra of the envelope of cross-correlograms in all pairs showed a dominant peak (median of RPD, 12.5; interquartile interval, 11.0–26.4). In seven (54%) pairs of PGNs, each PGN had the same T-rhythm, and there was significant PGN→PGN synchronization. The T-rhythm frequencies of these PGNs were the same as the frequency of CRD (median frequency, 0.73 Hz; interquartile interval, 0.68–0.77 Hz). The cross-correlogram between PN and these PGNs (represented as PN→PGN) showed that they were significantly correlated. Six (46%) pairs of PGNs had different T-rhythm frequencies and no significant PGN→PGN synchronization. In four of these pairs, one PGN of each pair showed a T-rhythm frequency the same as CRD but the other did not. In the remaining two pairs, the frequencies of the T-rhythms of the PGNs in each pair were different from each other and from CRD. An example of the autocorrelograms of a pair of PGNs in control conditions is shown in Figure 7, Ciand Cii (these are the same units as in Fig.7Bi,Bii). Figure 7Ciii shows the PN autocorrelogram in this animal (CRD frequency, 0.74 Hz). The two PGNs have different T-rhythm frequencies (0.53 Hz for PGN1; 0.74 Hz for PGN2), and there is no PGN→PGN synchronization as revealed by the cross-correlogram in Figure 8Bi. PGN1 has a T-rhythm frequency that is different to the CRD frequency, but the PN→PGN1 cross-correlogram shows a significant correlation (Fig.8Bii). This arises from the dynamic nature of PN→PGN interaction (see section “The stability of rhythmical synchronization of PGNs increases when CRD is enhanced”). Although some discharges of PGN1 are phase-locked to CRD, which produced the periodic pattern in the cross-correlogram, the overall activity that produced the T-rhythm did not had a fixed phase difference to CRD. PGN2 has a T-rhythm that is at the same frequency as CRD, and the cross-correlogram reveals a significant 1:1 synchronization (Fig.8Biii).
Enhanced CRD leads to PGN→PGN synchronization of T-rhythms
Six animals were recorded in conditions of enhanced CRD, and six pairs of PGNs were recorded through separate electrodes. All the PGNs exhibited robust rhythmicity, as revealed by their autocorrelograms, with a median T-rhythm frequency of 0.67 Hz (interquartile interval, 0.64–0.7 Hz). The dominant peak in the envelope of the cross-correlogram (n = 6) had a median RPD of 19.4 (interquartile interval, 12.0–36.5). Notably, in five (83%) of the pairs of PGNs, the activities of both PGNs had the same T-rhythm frequency and were significantly synchronized. These pairs were also locked in a 1:1 manner with CRD (median frequency, 0.67 Hz; interquartile interval, 0.64–0.69 Hz) and had significant PN→PGN synchronization. The dynamic nature of this synchronization is demonstrated by the fact that three (60%) pairs of PGNs synchronized during enhanced CRD were not significantly synchronized in control conditions.
The same PGNs examined during the absence of CRD (Fig. 7B) and control conditions (Fig. 7C) are shown under enhanced CRD conditions in Figure 7D. Both PGN1 and PGN2 and the PN show the same frequency (0.71 Hz) as revealed by their autocorrelograms (Fig. 7Di,Dii,Diii). These PGNs show significant PGN→PGN (Fig. 8Ci) and PN→PGN synchronization (Fig. 8Cii,Ciii).
Summary of the data from paired recordings under various respiratory conditions
The data presented here revealed a significant increase in the probability of synchronization of the rhythmical activity of PGN pairs as animals were moved from conditions when CRD was absent to conditions with enhanced CRD. In the absence of CRD, PGN→PGN activity never showed rhythmical synchronization. Although all these PGNs showed a T-rhythm, the T-rhythm frequency of each PGN of a pair was different as revealed in the scatter plot (Fig.9A). During control conditions, in which CRD was present, a proportion of PGN pairs (∼55%) had the same T-rhythm frequency (Fig. 9B) that was also the same as that of CRD. The T-rhythms of PGNs of these pairs were phase-locked. When the PGNs of a pair had different rhythms, there was no synchronization. In conditions of enhanced CRD, the majority of pairs (>80%) of PGNs had T-rhythms that were synchronized to each other at the frequency of the CRD. The T-rhythm frequencies of each PGN in each pair in this condition are shown in Figure 9C. For all the synchronous pairs of PGNs either under control conditions or when the CRD was enhanced, the peak nearest to lag zero in the PGN→PGN cross-correlograms always straddled the lag zero (as shown in Fig. 8Ci), indicating that statistically, the phase difference between synchronous PGNs was nearly zero. Furthermore, PN→PGN cross-correlograms reveal that activity of the two PGNs of a synchronous pair have similar phase differences relative to PN activity (Fig. 8Cii,Ciii) and this, given the fact that the frequencies of the PGNs are the same as that of PN, strongly suggests that the in-phase synchrony of PGN discharges may arise from the synchronization through CRD.

Summary scatter plots showing T-rhythm frequencies of pairs of postganglionic neurons (PGN1 and PGN2) in three conditions of CRD. The shaded diagonal bands indicate where the T-rhythm of both PGNs have frequency differences <0.02 Hz and by definition are considered to have the same frequency (see Materials and Methods). A, Absence of CRD. Zero of six pairs of PGNs had the same frequency. B, Control condition. Seven of 13 pairs of PGNs (54%) had the same frequency. C, Enhanced CRD. Five of six pairs of PGNs (83%, two pairs were superimposed as indicated by the circle) had the same frequency.
The degree of synchronization, as evaluated by the spectrum of the cross-correlogram envelope (see Materials and Methods), was also significantly higher when CRD was enhanced than when CRD was absent (p < 0.02; Wilcoxon rank-sum test; Fig.10).

Degree of rhythmical PGN→PGN synchronization in artificially ventilated animals under three conditions of CRD evaluated by the relative power density of the spectrum of the cross-correlogram envelope (see Materials and Methods). Data are presented as median and first and third quartiles. The level of relative power density is proportional to the level of rhythmicity. The asteriskindicates that the relative power density in conditions of enhanced CRD is significantly higher compared to that when CRD is absent (Wilcoxon rank-sum test; *p < 0.02).
The stability of rhythmical synchronization of PGNs increases when CRD is enhanced
Time-evolving raster plots were used to investigate the temporal stability of the rhythmical synchronization in PGNs. The density of the striations on the raster plot, which are a measure of the stability of the phase relationship between two oscillators, were quantified by calculating the phase variation factor (see Materials and Methods for details).
When CRD was absent, raster plots of PGN→PGN activity displayed no obvious striations, indicating that no constant phase relationship existed between PGN firing activity, although occasionally transient phase-locked periods could be observed. A typical example is shown in Figure 11A (this is the same animal shown in Figs. 7, 8). Three transient phase-locked periods are indicated by arrowheads. In control conditions, raster plots of PGN→PGN activity revealed a higher probability of striation, although this was not apparent for many of the pairs recorded. The example in Figure 11Bi (from the animal in Figs. 7, 8) illustrates a raster plot with no evidence of a striated appearance. By contrast, time-evolving raster plots of PN→PGN activity revealed some striations, indicative of a relatively constant phase difference during these periods. In the typical examples shown in Figure 11, Bii and Biii, there are also periods of asynchrony (Fig. 11Bii, arrowhead) and changes in the phase difference (Fig. 11Biii,arrow), suggesting that the entrainment to CRD is relatively dynamic. In conditions of enhanced CRD, the PGN→PGN raster plots of the PGN pairs showed some clear periods of striation, but also periods in which a constant phase difference between the PGN activities was not so apparent. The example shown in Figure11Ci (from the animal in Figs. 7, 8) shows obvious striations (Fig. 11Ci, period betweenarrows), suggesting periods of strong phase locking, preceded and followed by periods in which the synchronization is not so strong. The majority of PN→PGN raster plots in enhanced CRD conditions showed dense striations indicative of a constant phase relationship (Fig. 11Cii,Ciii). There was little evidence of phase hopping, suggesting that the entrainment by CRD was strong.

Dynamic change of rhythmical PGN→PGN and PN→PGN synchronization evaluated by the correlation raster plot under three conditions of CRD. The two PGNs and the period of analysis are the same as those in Figures 7 and 8. If the phase difference between two activities is relatively constant across time, a vertical striation will be observed in the raster plot. A, Absence of CRD: no definite pattern is present in the PGN1→PGN2 raster plot, although transient phase-locked periods can be observed (arrowheads). B, Control condition.Bi, PGN1→PGN2: the phase difference of the two units varies across time. Bii, PN→PGN1 andBiii, PN→PGN2, in some parts during data collection, the PGNs are synchronized with PN but periods of asynchrony (Bii, arrowhead) or changes of the phase difference (Biii, arrow) are also observed.C, Enhanced CRD. Ci, PGN1→PGN2: although phase drifting is still apparent (as in the absence of CRD and in control), there are also periods of rhythmical synchronization indicated by vertical striations (between arrows).Cii, PN→PGN1 and Ciii, PN→PGN2: rhythmical synchronization between the PN and PGNs is more apparent across time than previously.
Comparison of the phase variation factor for PGN→PGN raster plots is shown in Figure 12. The data illustrates that the phase variance is significantly lower in the condition of enhanced CRD versus absence of CRD (p < 0.02; Wilcoxon rank-sum test).

Dynamic stability of rhythmical synchronization between PGNs evaluated by the phase variation factor (see Materials and Methods) in artificially ventilated animals under three conditions of CRD. Data are presented as medians and first and third quartiles. The level of phase variation factor is inversely proportional to the level of stability. The asterisk indicates that the phase variation factor in the absence of CRD is significantly higher than in conditions of enhanced CRD (Wilcoxon rank-sum test; *p < 0.02).
Paired recordings of PGNs innervating the CVA in spontaneously breathing animals
Six pairs of PGNs were recorded from five spontaneously breathing animals under control conditions. Of the 12 PGNs recorded, only one unit did not show rhythmical discharges. The median frequency of the T-rhythm in the remainder was 0.67 Hz (interquartile interval, 0.5–0.8 Hz). One pair (8%) were synchronized and also showed 1:1 phase locking with the CRD (median frequency, 0.91 Hz; interquartile interval, 0.85–0.98 Hz).
Four pairs of PGNs were recorded from four animals in conditions of enhanced CRD. Rhythmical discharges were found in all the PGNs (T-rhythm median frequency, 0.68 Hz; interquartile interval, 0.64–0.71 Hz), and significant PGN→PGN synchronization was found in three (75%) of the pairs. All these PGNs were synchronized with CRD (median frequency, 0.92 Hz; interquartile interval, 0.71–1.18 Hz).
The data presented here indicate that the rhythmical firing behavior in PGNs of spontaneously breathing animals is consistent with the findings from the artificially ventilated preparations.
The mean discharge rate of PGNs does not significantly change with increases in CRD
The discharge rate of the PGNs in each of the groups was calculated to test the hypothesis that entrainment of PGNs might be accompanied by changes in their excitability. Because the mean discharge rate of single PGNs was highly variable, the median values with the range for each group are presented. Paired Wilcoxon signed-rank tests were used for statistical comparisons. In artificially ventilated rats, the median discharge rate of PGNs was 0.88 Hz in the absence of CRD (n = 12; range, 0.42–1.33 Hz), 1.37 Hz in control (n = 26; range, 0.51–4.19 Hz), and 0.91 Hz in conditions of enhanced CRD (n = 12; range, 0.51–2.0 Hz). Paired statistical comparisons showed that the discharge rates were not significantly different between pairs in the absence of CRD versus conditions of enhanced CRD (p = 0.41; paired Wilcoxon signed-rank test; n = 10).
In spontaneously breathing rats, the median discharge rate of PGNs was 1.15 Hz in control conditions (n = 12; range, 0.48–2.5 Hz) and 1.04 Hz in conditions of enhanced CRD (n = 8; range, 0.49–3.18 Hz). A statistical analysis between pairs recorded in control and conditions of enhanced CRD revealed that the discharge rates were not significantly different (p = 0.14; paired Wilcoxon signed-rank test; n = 4).
DISCUSSION
In this study we have demonstrated that the activities of PGNs making up the population innervating an artery, the CVA, are capable of dynamic synchronization. Our experimental evidence suggests that this is achieved by synchronization of multiple (T-rhythm) oscillators through entrainment by CRD. This conclusion is reached on the basis of a number of key observations. First, sympathetic activity supplying the tail, recorded from the VCN, showed a more prominent rhythmical component when CRD was enhanced than that seen when CRD was absent. Second, simultaneous recordings from pairs of CVA PGNs demonstrated that their T-rhythm frequencies could be different, and their activity was not necessarily synchronous. This indicates that the discharges of PGNs are driven by multiple T-rhythm oscillators. Although the primary source of this oscillatory activity has not yet been established, recent work from our laboratory has provided evidence to indicate that the T-rhythm may be generated in the CNS (Smith and Gilbey, 1998b). However, at present we do not rule out the possibility that the sympathetic ganglia could play an important role in both the generation and modulation of the rhythmical outflow. Third, studies of the degree of synchronization between two PGNs under the conditions of different CRD revealed that in the absence of CRD, PGN→PGN rhythmical discharges were uncorrelated (i.e., asynchronous), whereas when CRD was enhanced there was a high probability of synchronization. This change in the level of synchronization was not accompanied by a significant change in the discharge rate of PGNs. We also demonstrated that the temporal interaction between these oscillators is not static at a particular level of CRD, because PGN→PGN and PN→PGN synchronization was observed to undergo considerable dynamic variation. In the absence of CRD, although there was no PGN→PGN rhythmical correlation, there were transient phase-locked periods revealed by the raster plots. The high level of this dynamic variation was also reflected in the marked power density variation in the VCN autospectrum. By contrast, when CRD was enhanced, PGN→PGN rhythmical correlation was strong, as reflected in the rhythmicity of cross-correlograms and the frequently observable vertical striated patterns in the raster plots. This strong entrainment by CRD was also indicated by a reduced variation of power density across time in the VCN autospectrum. Thus, CRD appears to minimize the fluctuation of phase difference between PGN discharges and stabilize the frequencies of the T-rhythm oscillators.
We propose that the principle of dynamic synchronization revealed at the single neuron level in this study may also operate at the whole-nerve level of the sympathetic nervous system. In fact, this is indicated in a series of experiments by Gebber and colleagues (Gebber, 1980; Gebber et al., 1994a,b; Zhong et al., 1997) in which analysis of whole-nerve activity revealed that activity of different nerves may be driven by separate oscillators capable of coupling. They demonstrated that the coherence between the activities of different nerves was found to vary between experiments. This observation is consistent with the observed dynamic coupling seen in the results from the present study.
We hypothesize here that dynamic coupling may reveal one important mechanism whereby appropriate patterns of sympathetically mediated cardiovascular response are effected that support, for example, complex behaviors. Indeed dynamic coupling in sympathetic control may be regarded as an extension of the idea of “binding” (Farmer, 1998) into the dimension of autonomic control, and this is considered further below.
Differences between population and PGN→PGN activity profiles
The dual approach of examining correlations both in whole-nerve (VCN) activity and in PGN→PGN activity allowed us to explore the relationship between the activity profile of a neuronal population and its individual components. Importantly, our comparisons indicate that the emergent properties of multiunit activity can be different from those that would be predicted from PGN→PGN relationships.
One apparently paradoxical observation was that in the absence of CRD, although the autospectra of VCN activity revealed a rhythmical component suggesting that some of the rhythmical discharges of PGNs were synchronized (Fig. 4Ai), no significant PGN→PGN rhythmical synchronization was observed (Fig.8A). This paradox can be explained, however, as the autospectrum of a population composed of many weakly coupled or uncoupled oscillators with similar frequencies can still have a peak in the frequency range of its constituents. The power density around the peak depends on the number of units in the population, the strength of correlation between units, and the distribution of phase difference (Christakos, 1986, 1994).
The findings of the present study showing that separate oscillators driving the discharges of PGNs innervating the same target organ can be asynchronized provide an explanation for the frequently observed broad, rather than sharp, configuration of whole sympathetic nerve activity autospectra (Kocsis et al., 1990; Gootman et al., 1991; Allen et al., 1993). Consequently, it is no longer necessary to question whether the rhythm seen in sympathetic nerves arises from a well defined biological oscillator in view of its seemingly aperiodic nature (Bachoo and Polosa, 1987). Based on the observations reported in this paper, we suggest that the aperiodic or quasiperiodic nature of whole-nerve activity may be explained through dynamic synchronization of multiple sympathetic oscillators with “free-run” frequencies that may not be exactly the same.
Functional significance of synchronization of sympathetic activity
Our observations on synchrony in conjunction with those of others (Vallbo et al., 1979; McAllen and Malpas, 1997) can be viewed from at least two perspectives when considering possible functional implications. First, the dynamic synchrony observed in a functionally defined population of PGNs may be a manifestation of neural processes that provide the necessary plasticity that enables the nervous system to generate appropriate patterns of sympathetic response to support various behaviors. Second, synchrony may have important consequences for neuroeffector transmission and the end organ response.
With regard to synchrony and central processing, previous work has indicated that synchronous (bursty) sympathetic activity may be related to, for example, cardiac and respiratory rhythms (Adrian et al., 1932), intermittent isometric exercise (Victor et al., 1995), and in pathological conditions, epileptiform discharges (Lathers et al., 1987). Such synchrony may be purely caused by imposition of other oscillating activities on the sympathetic nervous system, “irradiation” (Koepchen et al., 1981). However, the results of the present study support the view that synchrony of sympathetic discharge may sometimes indicate coupling of multiple oscillators. If this is the case, our observations are consistent with the idea that the nervous system may use oscillatory neural activity to bind together various pools of neurons to produce patterned sympathetic responses: different combinations of neurons being bound according to the required autonomic response. Furthermore, our results suggest that under some conditions, for example when the CRD is enhanced, the sympathetic and respiratory networks may bind together through correlated firing to form a highly coordinated network. It has been proposed that such binding is particularly easily achieved in oscillating networks (Singer, 1993;Farmer, 1998). The concept of binding is not a novel one and has been promoted by sensory physiologists for a number of years and recently in relation to skeletal muscle motor control (Farmer, 1998). Although the synchronization of single PGNs controlling other cardiovascular targets has not been examined, the dynamic coupling of multiple oscillators reported in this study probably applies to other targets because robust rhythmicity and phenomena suggesting entrainment have been reported in a number of studies, in several different species, in which multiunit sympathetic activity has been recorded (e.g., cat, Taylor and Gebber, 1975; dog, Camerer et al., 1977; and goat, Toda et al., 1996). For example, Gebber and colleagues (Gebber, 1980; Zhong et al., 1997) have proposed, on the basis of correlation studies, that sympathetic oscillators driving sympathetic activity to a variety of sympathetic nerves may be entrained by phasic input from arterial baroreceptors and CRD.
Concerning the idea of synchrony and neuroeffector transmission, enhanced sympathetic synchrony (burst discharges) has been reported in humans under conditions of stress (Callister et al., 1992; Nordin and Fagius, 1995; Morgan et al., 1996; Katragadda et al., 1997), and it has been proposed that the bursts of sympathetic activity may have important consequences for neuroeffector transmission and therefore the end organ response (Sneddon and Burnstock, 1984; Sjöblom-Widfelt et al., 1990). We propose that synchrony may bring about widespread depolarization of electrotonically coupled smooth muscle in blood vessels via ATP released from sympathetic nerve endings (Morris and Gibbins, 1992). This will lead to fast depolarizations via ligand-gated ion channels (North and Barnard, 1997) and consequent vascular constriction. Thus, enhanced synchronization under conditions of stress will result in a relatively rapid increase of vascular resistance and redistribution of blood flow.
In conclusion, the concept of synchrony as an encoding mechanism in nervous control is an emerging principle from a variety of studies. Importantly, our work is the first to demonstrate dynamic synchrony at the single neuron level in the sympathetic (peripheral) nervous system. We suggest that in addition to discharge frequency, the dynamic synchrony observed in this study may indicate another important encoding parameter in the sympathetic nervous control of the cardiovascular system.
Footnotes
H.-S.C. was supported by Chang Gung Memorial Hospital, K.S. and work was supported by Wellcome Grant 05115, and J.E.S. was supported by British Heart Foundation Grant FS/96009. We thank Bruce Cotsell for his excellent technical support.
Correspondence should be addressed to Dr. Michael P. Gilbey, Autonomic Neuroscience Institute, Department of Physiology, Royal Free Hospital School of Medicine, Rowland Hill Street, London NW3 2PF, UK.


