

Article Figures & Data
Figures
- Fig. 1.
Morphology of freeze-lesion-induced focal cortical malformations. A, Adult rat brain that received a freeze-lesion at the day of birth, resulting in a longitudinal microgyrus. The microgyrus is macroscopically characterized by an infolding of the brain surface (arrowheads).B, Cresyl violet-stained coronal sections through the cortical malformation associating a loss of deep cortical layers and formation of a microsulcus (frame). The depth of the microsulcus increased in the anteroposterior direction.C, Higher magnifications of the sections displayed inB. In rostral parts of the brain, the dysplastic cortex is typically characterized by a three- to four-layered cortex. Because of the increase in depth, a nearly complete division of the neocortex is observed more occipitally. Scale bars: A, 2 mm;B, 1 mm; C, 500 μm.
- Fig. 2.
Distribution of GABAA receptor subunits α1, α2, α3, α5, and γ2 in sham-operated (A) and freeze-lesioned (B) rats. Color-coded images from immunohistochemically processed sections. For each subunit, the optical density of the immunoreactivity product was color-coded using a standard 256-level scale, ranging fromblack for background to violet,blue, green, yellow, andred for the most intense signals. Sham-operated rats (A) show the typical distribution pattern of subunits α1, α2, α3, α5, and γ2 with symmetric intensities on both hemispheres. Animals with freeze-lesion-induced cortical malformations (B, microgyrus marked with anarrow) display widespread reduction in immunoreactivity for all subunits, most prominently for subunits α1 and γ2, involving the area of the dysplastic cortex, but also surrounding neocortical areas and the ipsilateral hippocampal formation (see Fig.6).
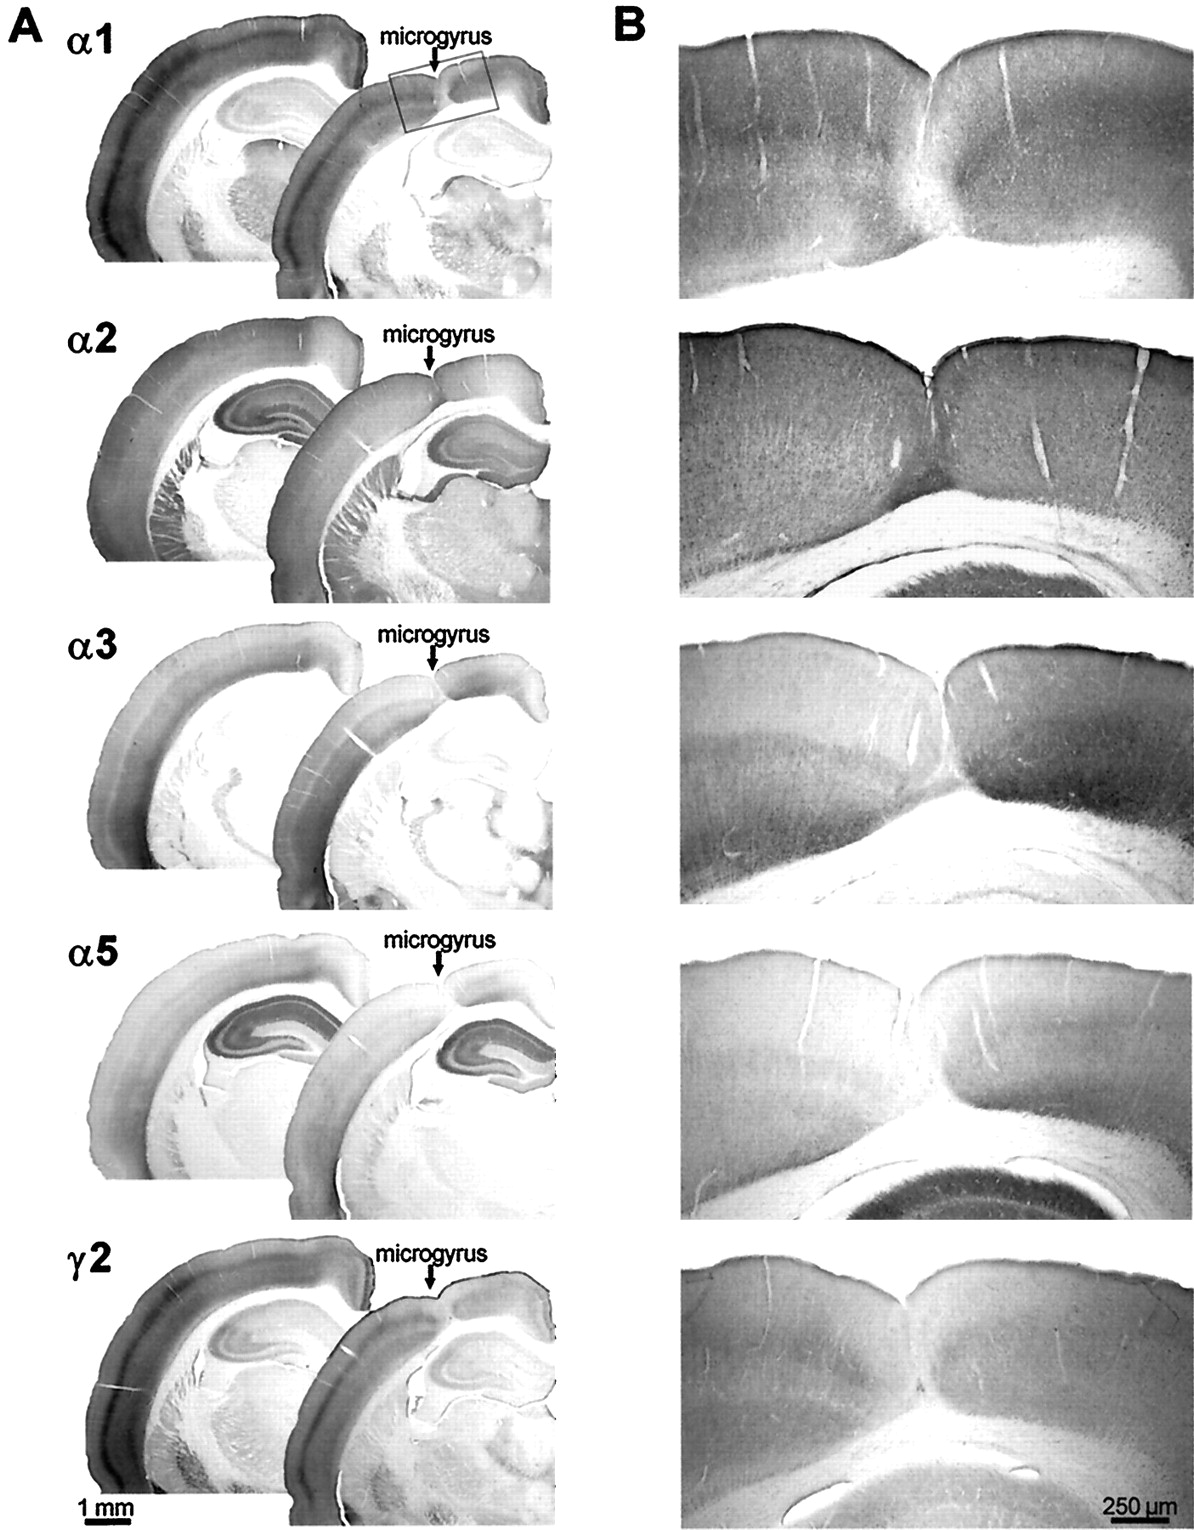
- Fig. 3.
Comparison of neocortical distribution of GABAA receptor subunits α1, α2, α3, α5, and γ2 in sham-operated and freeze-lesioned rats. A, Photomicrographs of coronal sections at low magnification showing a freeze-lesion-induced cortical malformation (microgyrus marked with anarrow) and corresponding sections from a sham-operated animal. Animals with cortical malformations show a decreased immunoreactivity in the lesioned area and in adjacent neocortical areas, whereas the characteristic laminar distribution pattern of the different subunits is conserved. The reduction in staining intensity is most prominent for subunits α1 and γ2, moderate for subunits α2 and α5, and only mild for subunit α3. B, Higher magnification of the cortical malformation (framein A) showing the laminar distribution of GABAA receptor subunits within the lesion. Note the differential immunoreactivity for subunits α3 and α5 on the lateral and medial wall of the microgyrus.
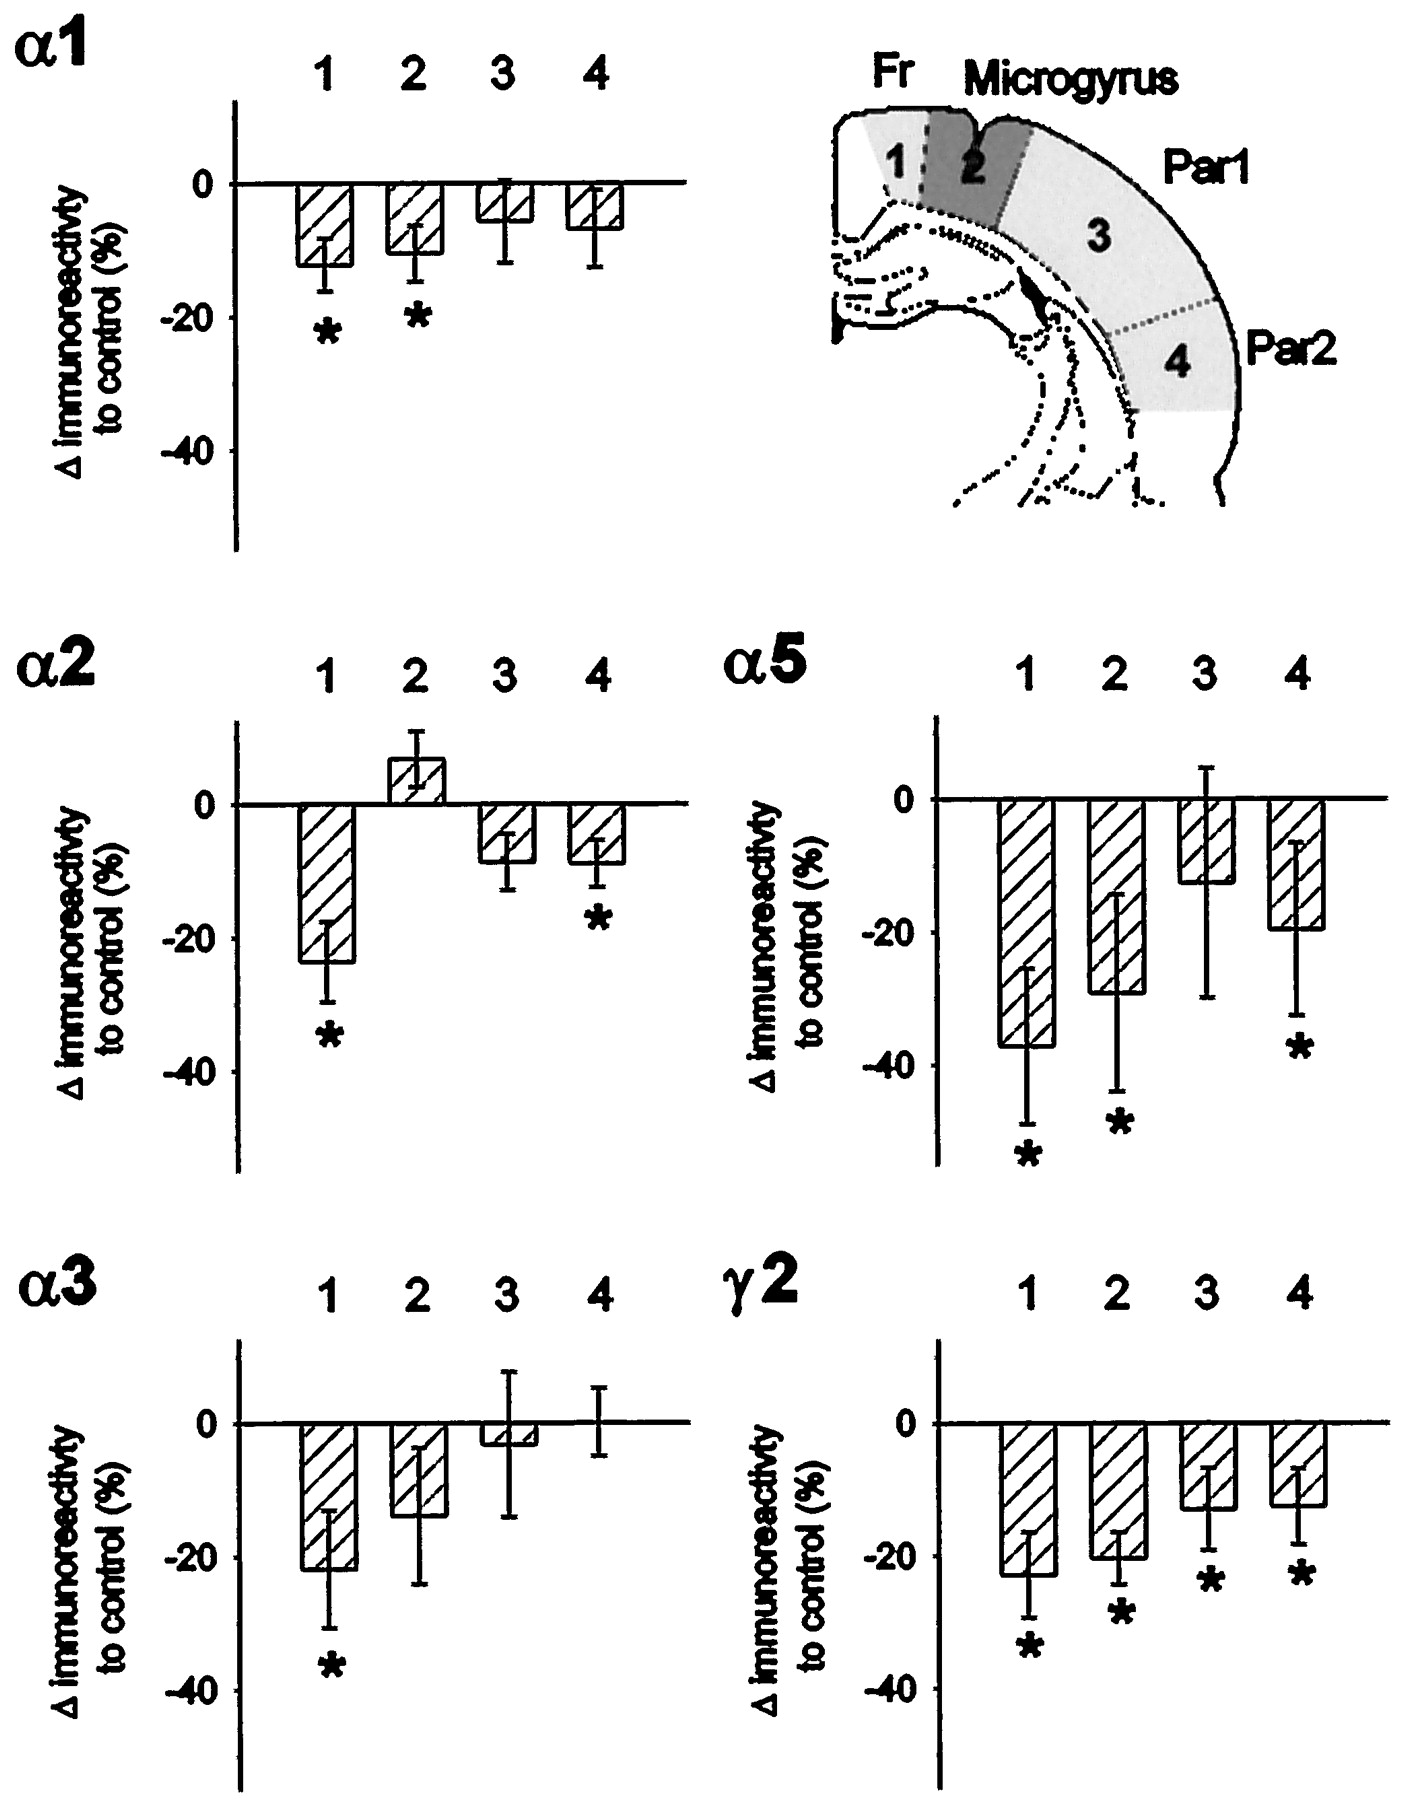
- Fig. 4.
Semiquantitative analysis of regional alterations in immunoreactivity of GABAA receptor subunits. The relative differences of staining intensities measured as optical densities in sections from animals with focal cortical malformations compared with sham-operated animals are displayed for different neocortical areas. A schematic drawing of the evaluated regions is shown in the inset. Significant differences (p < 0.05) are indicated byasterisks. Within the microgyrus, receptor subunits α1, α5, and γ2 showed a significant decrease in immunoreactivity compared with sham-operated animals. In the adjacent Fr, a significant reduction is measured for all subunits, whereas in Par1 and Par2, subunits α2 and α5 were significantly decreased in Par2 and subunit γ2 was reduced in both areas.
- Fig. 6.
Alterations in the distribution of GABAA receptor subunits α1, α2, α5, and γ2 within the ipsilateral hippocampal formation in animals with focal cortical malformations. A, The relative differences of staining intensities measured as optical densities in sections from animals with microgyri compared with sham-operated animals. Significant differences (p < 0.05) are indicated byasterisks. B, Color-coded images of the hippocampal formation from an animal with a freeze-lesion-induced microgyrus and a sham-operated control using a standard 256-level scale, ranging from black for background toviolet, blue, green,yellow, and red for the most intense signals. Note the prominent downregulation for subunits α1 and γ2.
- Fig. 7.
Schematic illustration of the development of a freeze-lesion-induced microgyrus (modified from Zilles et al., 1998). Cytoarchitectonical layers of the adjacent neocortex are specified withroman numerals and with arabic numeralswithin the dysplastic cortex. Arrows indicate the direction of migration of layer II–III neurons during the first postnatal days. For details, see Discussion.


