

Article Figures & Data
Figures
- Fig. 1.
Localization of native and transfected mGluR7 in cultured cerebellar granule cells. A, Native mGluR7 immunolabeling in permeabilized cultured cerebellar granule cells.B, Nonpermeabilized cultured cerebellar granule cell transfected with the Myc-mGluR7 expression plasmid and labeled with an anti-Myc antibody. Note the presence of neuritic clusters inA and B and presence of somatic immunolabeling only in B.
- Fig. 2.
Inhibitory effect of d,l-AP-4 on Ba2+ currents in mGluR7-transfected cerebellar granule cells. A, Each bar of the histogram represents the mean (± SEM; n = 10 to 18) of fractional reduction of whole-cell Ba2+ current induced byd,l-AP-4 (500 μm) applied alone, in cultured cerebellar granule cells transfected with GFP alone, or cotransfected with GFP + mGluR7. Note that d,l-AP-4 alone inhibited Ba2+ currents only in cotransfected cells.B, Ba2+ currents recorded in a mGluR7-transfected cell, in the absence and presence of 10 μm, 100 μm, 500 μm, or 1 mmd,l-AP-4. Please note the absence of change in activation kinetics in the presence of the agonist.C,D, Activation (C) and inactivation (D) curves of whole-cell Ba2+ currents obtained from two different granule cells, in the absence (control) and presence ofd,l-AP-4 (500 μm). Similar results were obtained from five other cells. E, Time course and concentration-dependent effect of d,l-AP-4 on Ba2+ currents in a mGluR7-transfected cerebellar granule cell. F, Inhibitory effects of ω-Agatoxin-IVA (250 nm), ω-Conotoxin-GVIA (1 μm), and nimodipine (1 μm) on Ba2+ currents obtained in nontransfected cultured cerebellar granule cells or transfected with GFP alone or cotransfected with GFP + mGluR7. Each bar of the histogram represents the mean (± SEM) of at least seven experiments. G, Inhibitory effects of ω-Agatoxin-IVA (250 nm), ω-Conotoxin-GVIA (1 μm), and nimodipine (1 μm) on Ba2+ currents obtained in the presence of d,l-AP-4 (500 μm), in cultured cerebellar granule cells transfected with GFP alone or cotransfected with GFP + mGluR7. Each bar of histogram represents the mean (± SEM) of at least 10 experiments. Note that the percentage of Ba2+ current inhibited by each toxin was similar in control and cotransfected cells, except for ω-Agatoxin-IVA, which was ineffective only in cotransfected cells.
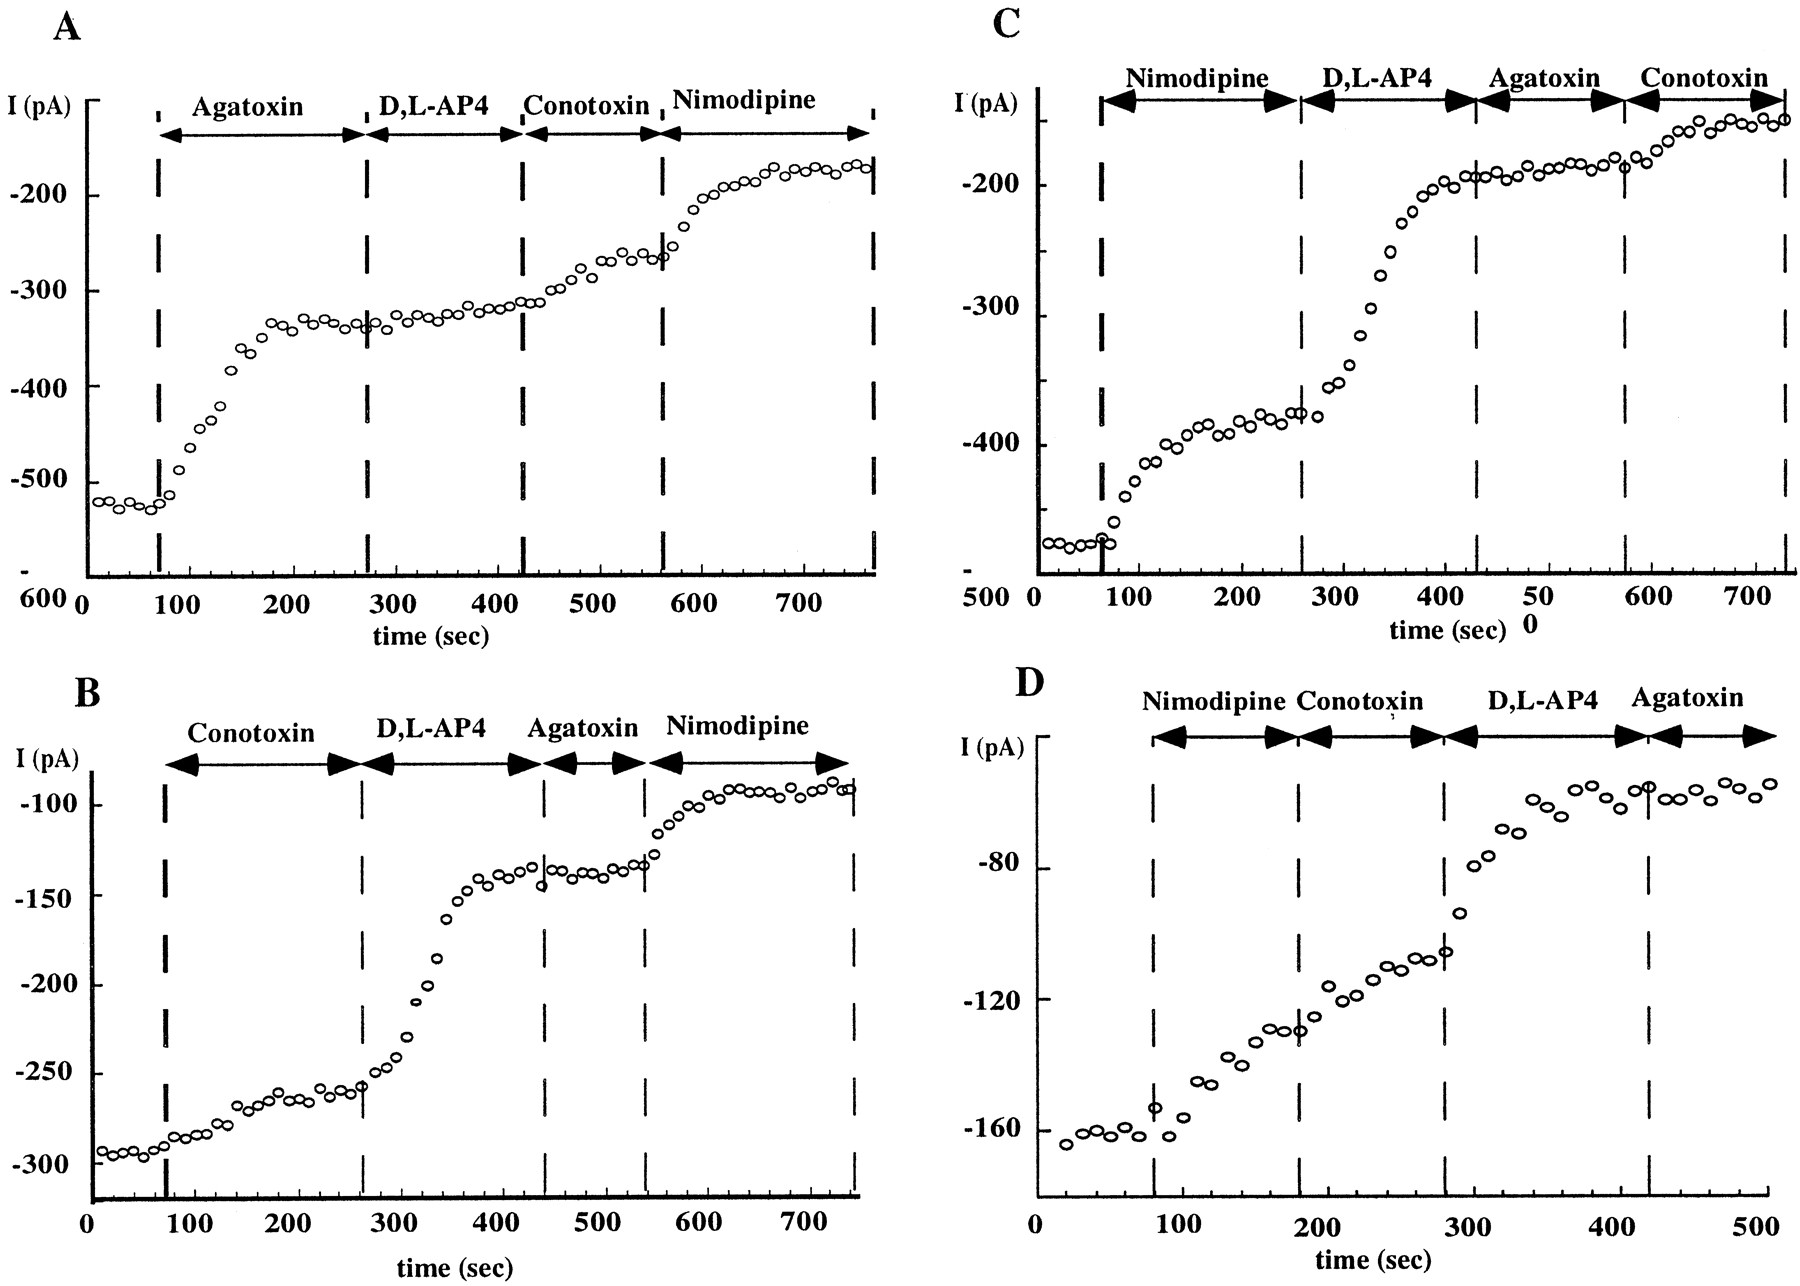
- Fig. 3.
Selective blockade of P/Q-type Ba2+ currents by d,l-AP-4. Absence of effect of d,l-AP-4 (500 μm) on ω-Agatoxin-IVA- (250 nm, A) and inhibitory effect of the agonist on ω-Conotoxin GVIA- (1 μm,B, D) and nimodipine- (1 μm,C, D) insensitive Ba2+ currents. Graphs A–D were obtained from four different mGluR7-transfected cerebellar granule cells. Similar results were obtained from at least five other cells, for each graph.
- Fig. 4.
d,l-AP-4 inhibited Ba2+ current through an indirect action of Go-protein. A, Mean (± SEM;n = 6–10) fractional reduction of the whole-cell Ba2+ current induced by d,l-AP-4 (500 μm) in mGluR7-transfected cerebellar granule cells, under different conditions (from left toright): control condition (CT), in the presence of intracellular GTPγS (100 μm), after an overnight PTX treatment (200 ng/ml), after intracellular dialysis of an antibody raised against the G-protein αo subunit (1:100 dilution;anti-αoAb), after intracellular dialysis of the α1A I-II loop peptide (10 μm;I-II loop), in cells cotransfected with CD8-βARK chimera (βARK), after intracellular dialysis of purified G-protein βγ subunits (50 μg/ml; βγ). NS, Not significantly different from control. B, Whole-cell Ba2+ currents evoked by depolarizing steps to +10 mV, from a holding potential of −80 mV, preceded (right) or not (left) by a prepulse to +80 mV. Note that d,l-AP-4 (500 μm) induced similar Ba2+ current inhibition in the presence or absence of prepulse depolarization. Similar results were observed in eight other mGluR7-transfected neurons.
- Fig. 6.
d,l-AP-4-induced IP3formation in nontransfected or mGluR7-transfected cultured cerebellar granule cells. A, IP formation was determined in nontransfected or mGluR7-transfected cerebellar cultures (fromleft to right) in the absence (Basal) and presence of the mGluR1 agonist DHPG (positive control), or different concentrations ofd,l-AP-4. The last bar of the histogram on theright was obtained in PTX-treated cells. Each bar of the histogram represents the mean ± SEM of four independent experiments performed in triplicate. B, Mean (± SEM;n = 5–10) fractional reduction of the whole-cell Ba2+ current recorded in mGluR7-transfected cerebellar granule cells induced by d,l-AP-4 (500 μm), under the following conditions (fromleft to right): in control cells, in cells recorded with an intracellular medium containing 20 mm BAPTA, and after 5 min dialysis of the IP3receptor antagonist heparin (400 μg/μl).
- Fig. 7.
Model for mGluR7-induced inhibition of the P/Q-type Ca2+ channels in cerebellar granule cells. mGluR7 activates a Go protein, the αo and βγ subunits of which stimulates a PLC. This results in IP3 and diacylglycerol (DAG) formation. IP3-induced Ca2+ release and DAG stimulate PKC, which in turn blocks the P/Q-type Ca2+ channel. Whether PKC directly phosphorylates the channel or acts on an intermediate protein is not determined.


