
Abstract
Interaural time differences (ITDs) are a major cue for localizing the azimuthal position of sounds. The dominant models for processing ITDs are based on the Jeffress model and predict neurons that fire maximally at a common ITD across their responsive frequency range. Such neurons are indeed found in the binaural pathways and are referred to as “peak-type.” However, other neurons discharge minimally at a common ITD (trough-type), and others do not display a common ITD at the maxima or minima (intermediate-type). From recordings of neurons in the auditory cortex of the unanesthetized rabbit to low-frequency tones and envelopes of high-frequency sounds, we show that the different response types combine to form a continuous axis of best ITD. This axis extends to ITDs well beyond that allowed by the head width. In Jeffress-type models, sensitivity to large ITDs would require neural delay lines with large differences in path lengths between the two ears. Our results suggest instead that sensitivity to large ITDs is created with short delay lines, using neurons that display intermediate- and trough-type responses. We demonstrate that a neuron's best ITD can be predicted from (1) its characteristic delay, a rough measure of the delay line, (2) its characteristic phase, which defines the response type, and (3) its best frequency for ITD sensitivity. The intermediate- and trough-type neurons that have large best ITDs are predicted to be most active when sounds at the two ears are decorrelated and may transmit information about auditory space other than sound localization.
- auditory neurophysiology
- auditory pathways
- interaural temporal disparities
- sound localization
- low-frequency hearing
- low-frequency signals
The difference in the time of arrival of low-frequency sounds at the two ears is a major cue for sound localization along the azimuth. The Jeffress (1948) model is the dominant scheme for how sensitivity to these interaural time differences (ITDs) arises. In his model, neurons at the primary site of binaural interaction act as coincidence detectors or equivalently as cross-correlators. Each neuron receives excitatory, phase-locked inputs from each ear, and the path lengths of the inputs vary from neuron to neuron. For each neuron, there is an ITD that offsets the difference in path lengths such that the inputs arrive in coincidence and the neuron fires maximally. By assuming that the path lengths are systematically arrayed, a neural place code for azimuthal sound location is created.
Although there is considerable behavioral, physiological, and anatomical support for the Jeffress model (for review, see Carr, 1993; Colburn, 1995; Kuwada et al., 1997; Stern and Trahiotis, 1997;Yin et al., 1997; Joris et al., 1998), it is insufficient to explain the variety of neural responses encountered in the auditory system. Some neurons discharge maximally at a common ITD across frequency (i.e., peak-type neurons), as predicted by the Jeffress model, but many do not. Instead, some neurons discharge minimally at a common ITD (trough-type neurons), whereas others do not display a common ITD at which the response is maximal or minimal (intermediate-type neurons) (cf. Rose et al., 1966; Yin and Kuwada, 1983; Kuwada et al., 1987;Reale and Brugge, 1990; Stanford et al., 1992; Batra et al., 1997a,b). Trough- and intermediate-type neurons are not predicted by the Jeffress model and are not part of later models based on his original scheme (Colburn, 1973; Stern and Colburn, 1978;Shackelton et al., 1992; Stern and Trahiotis, 1992).
The Jeffress model also does not consider ITD sensitivity to high-frequency signals. In the Jeffress model, sensitivity to ITDs arises from phase-locked inputs to low-frequency sounds. However, phase-locked responses also occur to the envelopes of high-frequency sounds, and many neurons display sensitivity to ITDs in envelopes (Crow et al., 1980; Yin et al., 1984; Batra et al., 1989; Joris and Yin, 1995). As with low-frequency sounds, there are peak-, trough-, and intermediate-type neurons sensitive to ITDs in the envelopes of high-frequency sounds.
The Jeffress model is an attempt to explain ITD sensitivity at the primary site of binaural interaction, which is in the superior olivary complex (SOC). In this report, we examined ITD sensitivity to low-frequency sounds and to envelopes of high-frequency sounds near the endpoint of ITD processing, in the primary auditory cortex. We demonstrate that peak-, trough-, and intermediate-type responses to ITDs in low-frequency sounds and envelopes can create a single, functionally continuous axis of ITD representation. This axis extends to values of ITD much greater than that normally considered. The presence of this continuous and extended axis indicates that Jeffress-type models capture only a part of the ITD representation in the brain.
MATERIALS AND METHODS
Experimental animal. Single and multiunit recording was performed in five female Dutch-Belted rabbits (1.5–2.5 kg). Surgical and experimental procedures have been described previously (Kuwada et al., 1987; Batra et al., 1989) and will be outlined here briefly.
Surgical procedures. All surgery was performed using aseptic techniques on rabbits with clean external ears. Under anesthesia (ketamine, 35 mg/kg, and xylazine, 5 mg/kg, i.m.), a square brass rod was anchored to the skull using screws and dental acrylic. Several days later, the animal was reanesthetized, and a small rectangular hole was made in the skull overlying the dorsal part of the auditory cortex, extending from ∼2 to 5 mm posterior to bregma and from ∼10 to 12 mm lateral to the midline. The hole was covered with sterilized medical elastopolymer (Smith and Nephew Rolyan). At this time, custom ear molds were made for sound delivery.
In one animal, during the initial surgery a catheter for injection of anesthetics during recording was inserted ∼6 cm into the external jugular vein and led subdermally to the skull. A blunted hypodermic (24 gauge) was inserted into the catheter and cemented to the head bar assembly. Heparinized saline was injected daily to keep the catheter patent.
Recording procedures and data collection. All recordings were conducted in a double-walled, sound-insulated chamber. The unanesthetized rabbit was placed in a body stocking from which its head protruded, seated in a padded cradle, and further restrained using nylon straps. The stocking and straps provided only mild restraint, their primary purpose being to discourage movements that might cause injury to the rabbit. The rabbit's head was fixed in a constant position by clamping to the surgically implanted rod. After the rabbit was secured, the elastopolymer covering was removed to expose the opening in the skull. To eliminate pain during the penetration of the electrode, a topical anesthetic (lidocaine) was applied to the dura for ∼5 min and then removed by aspiration. With these procedures, rabbits remained still for a period of 2 or more hours, an important criterion for single-neuron recording. Typically, a rabbit participated in daily recording sessions over a period of 2–6 months. A session was terminated if the rabbit showed any signs of discomfort. The rabbit's comfort was a priority both for ethical reasons and because movements made it difficult to record from single neurons.
Extracellular recordings were made with glass-coated, platinum–tungsten microelectrodes (tip diameter of 1–2 μm; impedances of 10–30 MΣ). The action potentials of single neurons or small clusters of neurons were isolated with the aid of a time/amplitude window discriminator (BAK Electronics, Germantown, MD) and timed relative to the stimulus onset with an accuracy of 10 μsec.
The rabbit has a lissencephalic cerebral cortex, and the primary auditory cortex (AI) is situated on its lateral surface. The vertical electrode penetrations were tangential to the cortical surface and approximately perpendicular to the isofrequency contours (McMullen and Glaser, 1982). Because of the lissencephalic cortex, long penetrations (>2 mm) could be made within the auditory cortex. By exploring the medial–lateral dimension until the most robust responses were encountered, the electrodes could be oriented toward the middle layers of the AI.
Acoustic stimulation. Stimuli were generated by a two-channel digital stimulation system (Rhode, 1976) and delivered independently to the two ears through Beyer DT-48 earphones coupled to the custom-fitted ear molds to form a sealed system. Stimuli were pure tones, sinusoidally amplitude-modulated (SAM) tones or noise presented either monaurally or binaurally. The stimuli were gated on and off with linear rise and fall times of 4.0 msec. Amplitudes and phases of tones (60 Hz to 40 kHz in 20 Hz steps) were calibrated before the first recording session in each animal, by means of a probe tube that extended ∼1 mm from the end of the sound tube. The sound tube extended to within ∼2.5 cm of the tympanum. This calibration was used to deliver tones of specified amplitude and phase.
Sensitivity to ITDs was primarily assessed using binaural-beat stimuli. For low-frequency sounds (less than ∼2 kHz), the binaural-beat stimulus was created by delivering tones to the two ears that differed by 1 Hz, which resulted in a continuously varying ITD with a period of 1 sec (Kuwada et al., 1980). For high-frequency sounds (>2.5 kHz), the binaural-beat stimulus was created by delivering SAM tones to the two ears that had the same carrier frequency (at or near the best frequency of the neuron) but had modulation frequencies that differed by 1 Hz. In some neurons, ITD sensitivity was assessed using noise as well as binaural-beat stimuli. The noises were either low-pass (cutoff frequencies of up to 10 kHz) or bandpass (1/2 or 1 octave wide).
Determination of best frequencies. Two types of best frequency were determined. The first was the best frequency (BF) to monaural (usually contralateral) or diotic tones. This determination was made using isointensity tone bursts, 75 msec long and repeated every 300–400 msec, in 1/2-octave steps from 35,000 to 243 Hz. This frequency range was taken at one or a few suprathreshold levels (usually 40–70 dB sound pressure level). In neurons with narrow-frequency tuning, finer steps of frequency were taken within the responsive range. The centroid of the response range that exceeded 50% of the maximum response was considered the neuron's best frequency. If responses at more than one intensity were recorded, the lowest intensity above threshold was used.
The second determination was the best frequency for ITD sensitivity (BFITD). This was taken as the centroid of the responses over the range of frequencies or modulation frequencies at which a neuron showed significant synchrony to the binaural-beat stimulus (Rayleigh test of uniformity, p < 0.001) (Mardia, 1972). Note that many neurons sensitive to ITDs in envelopes were low-pass, so that the BFITD in these neurons represents an average modulation frequency for ITD sensitivity.
RESULTS
Our results are based on recordings from single (n= 303) and multiple (n = 233) neurons from the primary auditory cortex of the unanesthetized rabbit that were sensitive to ITDs. The response types and distributions were similar between single neuron and multineuron recordings. In the following, all of the illustrated responses are from single neurons, whereas the distributions are pooled single and multiple neurons. Of the total neurons, 410 were sensitive to ITDs in low-frequency sounds (less than ∼2 kHz; 219 single neurons), and 126 were sensitive to ITDs in the envelopes of high-frequency sounds (84 single neurons). All of these met the Yin and Kuwada (1983) criterion for linearity in the change of mean response phase with changes in the stimulus frequency (see below).
Effect of anesthesia
We used an unanesthetized preparation, because anesthesia is known to alter ITD sensitivity in the inferior colliculus (IC) (Kuwada et al., 1989). In the auditory cortex of barbiturate-anesthetized cats, most neurons (74%) sensitive to static ITDs were insensitive to dynamic ITDs created by the binaural-beat stimulus (Reale and Brugge, 1990). However, in the unanesthetized rabbit almost all neurons sensitive to ITDs responded vigorously to binaural beats. To determine whether this difference could be caused by anesthesia, we tested the responses of neurons to static and dynamic ITDs in low-frequency sounds before and after an intravenous injection of sodium pentobarbital. In the example shown in Figure 1, before anesthesia the neuron responded vigorously to both static (Fig.1A) and dynamic (Fig. 1B) ITDs. After anesthesia, the same neuron retained tuning to static ITDs, although the response was greatly reduced (Fig. 1C). The neuron lost its sensitivity to dynamic ITDs (Fig.1D). Most neurons (7/12) lost sensitivity to dynamic ITDs while remaining tuned to static ITDs. Thus, it seems that the reported inability of cortical neurons to follow dynamic ITDs (Reale and Brugge, 1990) was caused by anesthesia. We therefore regard the use of unanesthetized animals as critical for investigating ITD sensitivity.

The effect of pentobarbital anesthesia on the responses of a cortical neuron sensitive to ITDs. A,C, Responses to static changes in ITD before (A) and after (C) administration of anesthesia. The response rate was reduced, but tuning to ITDs remained. Frequency, 700 Hz. B, D, Poststimulus time histograms of the responses to dynamic ITDs before (B) and after (D) administration of anesthesia. Changes in ITD were produced by a binaural-beat stimulus consisting of 700 Hz to the contralateral ear and 701 Hz to the ipsilateral ear. This stimulus produced a 1 Hz cyclic variation in the ITD. The five response peaks in B were synchronized to the variation in ITD, but there was no significant synchrony to the beat in D (Rayleigh test of uniformity,p > 0.001) (Mardia, 1972), and the discharge rate was reduced. The BF of this neuron was 900 Hz, and the BFITD was 700 Hz.
Types of ITD-sensitive responses
Jeffress-type models predict that all neurons have peak-type responses; i.e., the peak response occurs at or near the same ITD across frequencies. Peak-type responses are common at all levels of the auditory system, but they are not the only response type encountered. In this section, we will show examples of peak-, trough-, and intermediate-type responses for both low-frequency sounds and for envelopes and demonstrate how parameters that describe the responses are determined. Subsequent sections will show how each parameter affects the tuning to ITDs and describe the distributions of the parameters among cortical neurons.
Examples of different response types are shown in Figures2 and 3 for neurons sensitive to ITDs in low-frequency tones and in envelopes, respectively. For each neuron, the family of curves in theleft column shows the tuning to ITDs derived from the responses to binaural-beat stimuli with different tone or envelope frequencies. For the peak-type neurons (Figs. 2A,3A) the ITD functions at different frequencies align (dashed lines) at or near the maximal discharge for each frequency. In contrast, for the trough-type neurons (Figs.2B, 3B) the ITD functions align at or near the minimal discharge for each frequency. For the intermediate-type neurons (Figs. 2C, 3C) the curves do not align at the peaks or the troughs but rather somewhere in-between.

Examples of response types to changes in ITD across frequency for cortical neurons sensitive to ITD in low-frequency sounds. LeftColumn, The family of “delay curves” from each neuron. Each delay curve is the response as a function of ITD to a particular stimulus frequency.MiddleColumn, Plots of the mean phase of the response versus the stimulating frequency. The slopeof the best fit line represents the CD, and theintercept is the CP. RightColumn, The “composite curves,” obtained by averaging the delay curves. A, A peak-type response. In a peak-type response the CP is near 0, the CD (dashedlines) occurs near the peak of each delay curve, and the best ITD, or peak of the composite curve (arrow), is similar to the CD. The BF of this neuron was 960 Hz, and the BFITD was 950 Hz. B, A trough-type response. In a trough-type response the CP is near ±0.5, the CD occurs near the trough of each delay curve, and the best ITD differs substantially from the CD. The BF of this neuron was not taken, and the BFITDwas 840 Hz. C, An intermediate-type response. In an intermediate-type response the CP is near ±0.25, the CD occurs between the peaks and troughs of the delay curves, and the best ITD differs from the CD, but not as much as in the case of the trough-type neuron. The BF of this neuron was 3200 Hz, and the BFITD was 840 Hz. Details of the analytic procedures are given in Kuwada et al. (1987). Contra, Contralateral; Ipsi, ipsilateral.

Examples of response types to changes in ITD across frequency for cortical neurons sensitive to ITDs in the envelopes of high-frequency sounds. Conventions are described in Figure2. As with ITD sensitivity to low-frequency sounds, peak-, trough-, and intermediate-type responses occurred for envelope ITD sensitivity. The BFs for the neurons were 4375 Hz for A andB and 3100 Hz for C. The BFITD for A was 250 Hz modulation frequency, for B it was 210 Hz, and for C it was 540 Hz.
Two measures are commonly used to assess the ITD to which a neuron is tuned. The first of these is the ITD at which the ITD functions at each frequency best align (Figs. 2, dashed lines, 3,dashed lines) and is called the characteristic delay (CD) (Rose et al., 1966). The CD can be determined by a least squares, linear fit to a plot of the mean interaural phase of the response versus the stimulating frequency (Figs. 2, middle column, 3, middle column) (Yin and Kuwada, 1983). The slope of the fit is the CD. Yin and Kuwada (1983)devised a measure of the significance of the fit based on the mean square error. Only a few cortical neurons failed this test and were not included. The phase intercept at 0 Hz is called the characteristic phase (CP). The CP is a measure of whether alignment occurs near the peaks of the ITD functions (CP near 0 cycles), near the troughs (CP near ±0.5 cycles), or intermediate between the peak and trough (CP near ±0.25 cycles). Thus, the CP can be used to distinguish peak-, trough-, and intermediate-type responses. In Jeffress-type models, the CDs for peak-type neurons correspond to the difference in conduction delay for the excitatory inputs from each ear to reach the binaural coincidence detector. The models do not consider CDs of trough- and intermediate-type neurons.
The second measure used to assess the ITD to which a neuron is tuned is the best ITD of the composite curve (Yin and Kuwada, 1983). The composite curve is obtained by averaging the ITD functions at each frequency. The peak of a parabola fit to the upper 50% of the composite curve is considered the neuron's best ITD (Figs. 2,arrows, 3, arrows). As expected from the Jeffress model, for the peak-type neurons the best ITD and the CD are essentially equal (Figs. 2A, right column, 3A, right column). However, they are not equal for trough- and intermediate-type neurons (Figs. 2B,C, right column, 3B,C, right column).
The composite curve is expected to be representative of a neuron's ITD sensitivity to a broad-band sound. Figure4 displays the correspondence between a neuron's composite curve and its response to ITDs of a noise stimulus for several neurons sensitive to ITDs in low-frequency sounds: a peak-type neuron (Fig. 4A), two intermediate-type neurons (Fig. 4B,C), and a trough-type neuron (Fig.4D). In each case, the ITD tuning of the composite curves was similar to that from the noise. Across our sample (Fig.4E), there was a good correspondence between the best ITDs derived from the composite curve and from noise (r= 0.86; slope = 0.93). Thus, among cortical neurons, as in neurons from the IC (Yin et al., 1986; Palmer et al., 1990), the composite curves reasonably predict the responses to a broad-band sound, suggesting that integration across frequency is relatively linear.
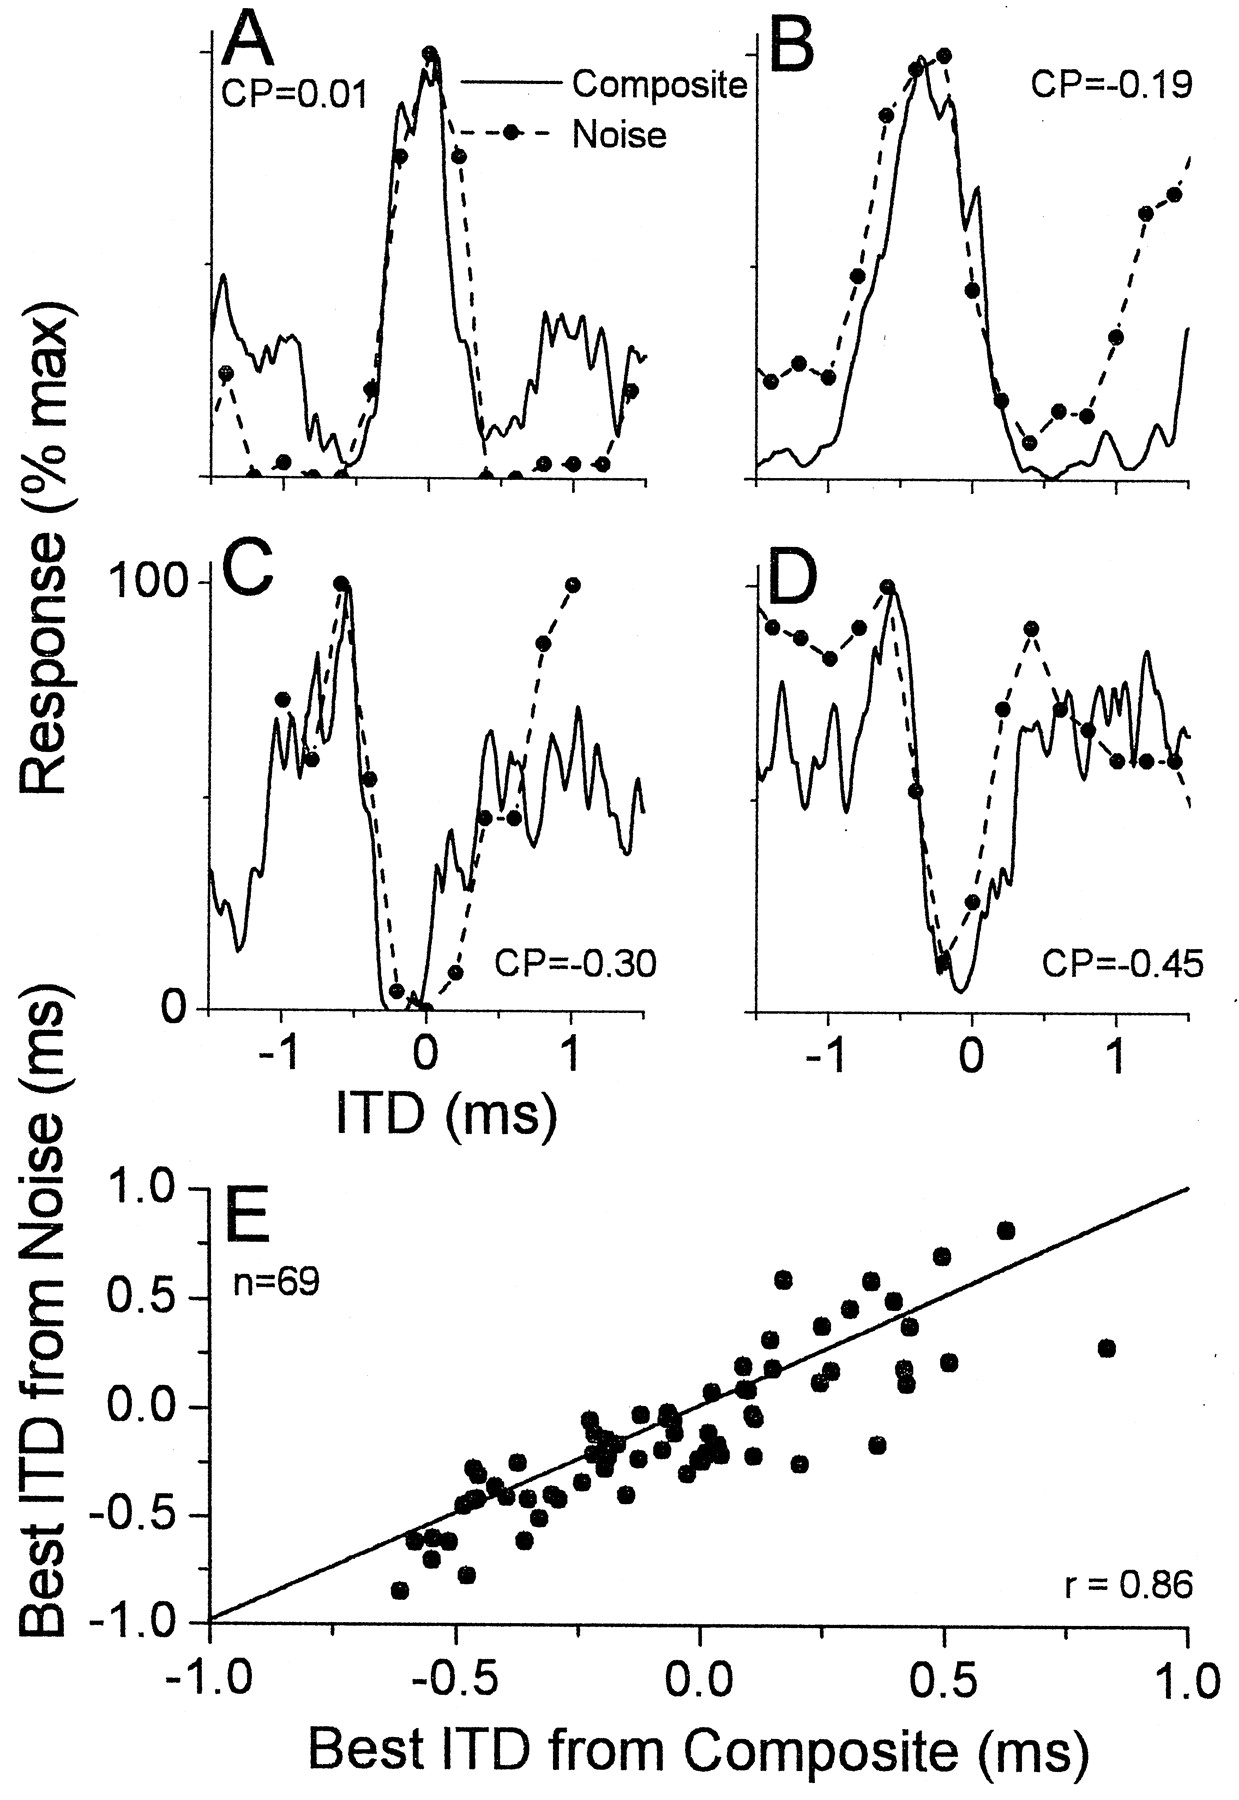
Comparison of composite curves and the ITD tuning to noise in neurons sensitive to ITDs in low-frequency sounds.A, A neuron with a peak-type response. BF = 2900 Hz; BFITD = 750 Hz. B, C, Two examples of neurons with intermediate-type responses. For the neuron inB, the BF was 490 Hz, and the BFITD was 450 Hz; for the neuron in C, the BF was not taken, and the BFITD was 720 Hz. D, A neuron with a trough-type response. The BF was not taken, and the BFITDwas 780 Hz. Noises were low-pass with a cutoff of 2000 Hz inA, 3000 Hz in D, and 5000 Hz inB and C.E, Scatter plot of the best ITDs obtained from composite curves and noise.
Relationships among parameters important for ITD sensitivity
In Jeffress-type models, the range of best ITDs is governed by the range of CDs. This range is shown in Figure5A using as examples five peak-type neurons (CPs near 0) tuned to ipsilateral delays, or contralateral space. In each case, the CDs (arrows) were similar to the best ITDs. Thus, when only peak-type neurons are considered, the range of best ITDs is equivalent to the range of CDs.

Examples of the effects of varying CP and frequency tuning on the ITD sensitivity of cortical neurons.A, Composite curves from five neurons sensitive to ITDs in low-frequency sounds with peak-type responses and varied CDs (arrows). The responses of these neurons are similar to the typical Jeffress-type elements used in many models of ITD sensitivity. B, Composite curves from five neurons sensitive to ITDs in low-frequency sounds that had similar CDs but varying CPs (indicated above the peak of each curve). These examples demonstrate that a wide range of ITDs can be represented by variation in the CP without concomitant changes in the CD. Thus, they are unlike typical Jeffress-type elements.C, Composite curves from five neurons, two that were sensitive to ITDs in low-frequency sounds and three that were sensitive to ITDs in envelopes, with intermediate-type responses that had progressively lower-frequency tuning (BFITD values are indicated above the peak of each curve). These examples indicate that when the CP was not near zero, lower-frequency tuning resulted in larger best ITDs, another feature not captured in models with Jeffress-type elements.Freq, Frequency.
In intermediate- and trough-type neurons, which are not considered in Jeffress-type models, the range of best ITDs is not limited by the range of CDs. The five neurons in Figure 5B had a narrow range of CDs (from −30 to −140 μsec) but covered a wide range of best ITDs (from −60 to −680 μsec), because they differed in their CP. As the CP changed from ∼0 to −0.5 cycles, i.e., from peak-type through intermediate-type to trough-type, the best ITDs became progressively larger.
The effect of CP on the best ITD is dependent on frequency tuning. Figure 5C shows five intermediate-type neurons (CPs near −0.25 cycles) that had progressively lower-frequency tuning. This lower-frequency tuning resulted in progressively larger best ITDs. This figure also demonstrates a continuum between the ITD tuning to low-frequency sounds and envelopes. The two intermediate-type neurons that were sensitive to ITDs in low-frequency sounds (solid lines) had BFITD values (see Materials and Methods) of 1000 and 450 Hz and were sensitive to relatively small ITDs (<1 msec). The remaining three intermediate-type neurons (dashed lines) were sensitive to ITDs in envelopes and had much lower BFITD values (50–200 Hz). The best ITDs of these neurons extended to several milliseconds (Fig. 5, note the difference in scale betweenC, A,B). Thus, sensitivity to lower frequencies greatly increased the shift in best ITD from the CD for a given CP. This effect of frequency is also not considered in Jeffress-type models.
The net effects of variations in the CD, CP, and frequency tuning on a neuron's best ITD (ITDbest) can be described by the equation:
 Equation 1By the use of this equation, the best ITD is equal to the CD when the CP is 0, as is the case for peak-type neurons. As the CP moves away from 0, the best ITD differs from the CD by an amount dependent on the BFITD, with lower-frequency tuning yielding a larger difference. Figure 6 compares the best ITDs of neurons in the cortex with the best ITDs predicted from Equation 1. For neurons sensitive to low-frequency sounds (Fig.6A) or envelopes (Fig. 6B), most comparisons fell on or near the line of equality, supporting the relationship described by Equation 1.

Scatter plots indicating the relation between best ITDs measured from composite curves and those predicted from Equation1. A, Low-frequency sounds. B, Envelopes of high-frequency sounds.
The distributions of parameters important for ITD sensitivity
The previous section described the physical relationships among parameters important for ITD sensitivity. In this section, we will show how these parameters are distributed among neurons in the auditory cortex and the resultant representation of ITDs that is achieved.
Frequency tuning
Before turning to the best frequencies for ITD sensitivity used in Equation 1, we will first consider the more traditional best frequency measured to monaural or diotic tones. The prevailing view is that ITD sensitivity to low-frequency sounds occurs in neurons with low BFs and that ITD sensitivity to envelopes occurs in neurons with high BFs. However, we found no such simple dichotomy. Instead, many neurons sensitive to ITDs in low-frequency sounds (less than ∼2 kHz) had high BFs (more than ∼2 kHz) (Fig.7A; 94/293 neurons or 32% of the sample). The range of BFs of neurons sensitive to ITDs in low-frequency sounds extended from ∼300 Hz to ∼8 kHz. The range of BFs for neurons sensitive to ITDs in envelopes extended from ∼2 to 40 kHz. Sensitivity to ITDs in envelopes was only tested in neurons with high BFs but could also be expected to occur in neurons with low BFs (see Joris and Yin, 1995). Thus, sensitivity to both types of ITDs extends over a wide range of the tonotopic axis in the auditory cortex.

Distribution of frequency tuning for ITD sensitivity to tones and to envelopes. A, Best frequencies to monaural or diotic tones. Both types of ITD sensitivity occurred in neurons that covered a wide range of the tonotopic axis in the cortex. Envelope sensitivity was not tested in neurons with low BFs (less than ∼2 kHz). B, Best frequencies for ITD sensitivity. The best modulation frequencies for ITD sensitivity to envelopes were generally lower than the best frequencies for ITD sensitivity to tones. C, Proportion of neurons that showed significant ITD sensitivity to tones or modulation frequencies (Rayleigh test for uniformity, p < 0.001) (Mardia, 1972). These curves show that the range of frequencies or modulation frequencies to which a large number of neurons were sensitive extended from <50 to nearly 2000 Hz. The continuity in frequency tuning between the two types of signals suggests that they are part of a single functional array for representing ITDs. Bin widths are 1/2 octave. Neurons sensitive to tones and envelopes were normalized separately. The number of neurons is 73 for tones in A, 410 for tones in B and C, and 126 for envelopes in A–C.
In contrast to the BFs to monaural or diotic tones (Fig.7A), the BFITD values to envelope modulations were generally lower than the BFITDvalues for low-frequency sounds. Figure 7B shows the distributions of BFITD values for neurons sensitive to both signal types (median = 172 Hz modulation frequency for envelopes and 863 Hz for low-frequency sounds). In Figure7B, the distributions of frequency representation for the two signal types appear primarily separate and to drop off below ∼200 Hz for envelopes. However, this view is misleading, because many of the envelope-sensitive neurons were low-pass to modulation frequency. When the proportion of neurons sensitive to ITDs at each frequency was considered (Fig. 7C), the distributions of the two signal types overlapped such that all frequencies from <50 Hz to nearly 2 kHz were represented by a large proportion of neurons. Sensitivity to envelopes therefore serves to extend the range of sensitivity to ITDs to lower frequencies than can be extracted from the fine structure of signals.
CP
For neurons sensitive to ITDs in low-frequency tones, there was a nearly uniform distribution of CPs (Fig.8A); i.e., there were many intermediate-type neurons that filled the range between peak- and trough-type. For neurons sensitive to ITDs in envelopes (Fig.8B), there was a large group of neurons with CPs near 0, but also many intermediate- and trough-type neurons. Thus, in both cases there was a continuum of CP, such that it was not possible to draw clear dividing lines between different response types. For both tones and envelopes, there were more neurons (58% for tones and 73% for envelopes) with negative CPs. Neurons with negative CPs have best ITDs that are shifted toward ipsilateral delays relative to the CDs. Ipsilateral delays correspond to those created by sounds in the contralateral field.

Distributions of CPs, CDs, and best ITDs for low-frequency sounds and for envelopes. A, B, Distributions of CPs. The distributions for both low-frequency sounds (A) and envelopes (B) show numerous intermediate-type neurons, i.e., those with CPs far from 0 or ±0.5. There is also a predominance of neurons with negative CPs. The numbers of neurons were 410 for low-frequency sounds and 126 for envelopes. C, D, Distributions of CDs. The distributions for low-frequency sounds (C) were similar for peak- and trough-like neurons (division made at a CP of ±0.25) and were encompassed within approximately ±0.5 msec. The distributions for envelopes were also similar between peak- and trough-like neurons, and most neurons were encompassed within approximately ±1.0 msec. The numbers of neurons were 247 peak-like and 163 trough-like inC and 78 peak-like and 48 trough-like inD. E, F, Distributions of best ITDs. For both low-frequency sounds (E) and envelopes (F), peak-type neurons had relatively small best ITDs, whereas two populations of trough-type neurons had large best ITDs. The two trough-type populations were separated by thesign of the CP. There was a preponderance of neurons with best ITDs to ipsilateral delays, associated with sounds in contralateral space. In C–F, peak- and trough-like populations were normalized separately. Bin widths were 0.1 msec, except in F where they were 0.5 msec. G, The complete representation of the best ITDs obtained from sensitivity to both low-frequency sounds and envelopes. Many neurons had best ITDs within the “physiological range” determined by the head width (horizontalbarabove thehistogram), but many did not. Together, the sensitivity to ITDs in low-frequency sounds and envelopes resulted in a continuous representation of ITDs that extended to very large values. Bin widths were 0.15 msec.
CD
The distribution of CDs was similar between different types of neurons and across sensitivity to tones and envelopes. For illustrative purposes we divided our sample into two groups: peak- and trough-like. The division was made at a CP of ±0.25 cycles, and consequently both groups contain numerous intermediate neurons. The distributions of CDs (Fig. 8C,D) for peak- and trough-like neurons were similar, suggesting that the different response types encode a similar range of differences in the conduction delays from the two sides. For low-frequency sounds, almost all neurons (90%) had CDs within ±500 μsec. The range of CDs was somewhat wider for envelope ITD sensitivity, but still most neurons (61%) had CDs within ±500 μsec. For both low-frequency sounds and envelopes, more neurons had CDs to ipsilateral than to contralateral delays (68 and 63%, respectively).
Best ITD
Because of the effects of CP and frequency tuning described by Equation 1, the best ITDs of peak- and trough-like neurons became separated (Fig. 8E,F). The peak-like neurons represented relatively small ITDs, whereas trough-like neurons represented larger ITDs. For both signal types, trough-like neurons were separated into two groups, one on either side of the peak-like neurons, because of differences in the sign of the CP. The range of best ITDs represented by envelopes was especially large because of the low frequencies involved (Fig. 8E,F, note change of scale of x-axis). There were more neurons with negative best ITDs associated with sounds in contralateral space (65% for low-frequency sounds and 75% for envelopes).
The distributions of best ITDs for the two types of signals were combined in Figure 8G to display the pattern and range of best ITD on a single axis. The range within the head width [Fig.8G, horizontal bar abovethe histogram, ±300 μsec (from Heffner and Masterton, 1980)] was strongly represented, primarily by neurons sensitive to low-frequency sounds but also by neurons sensitive to envelopes. The largest ITDs (>1 msec) were predominantly represented via envelope ITD sensitivity. Thus, neurons with different CPs and neurons sensitive to both types of signals combine to form a single representation that extends to very large values of ITD.
Comparison with other brain levels
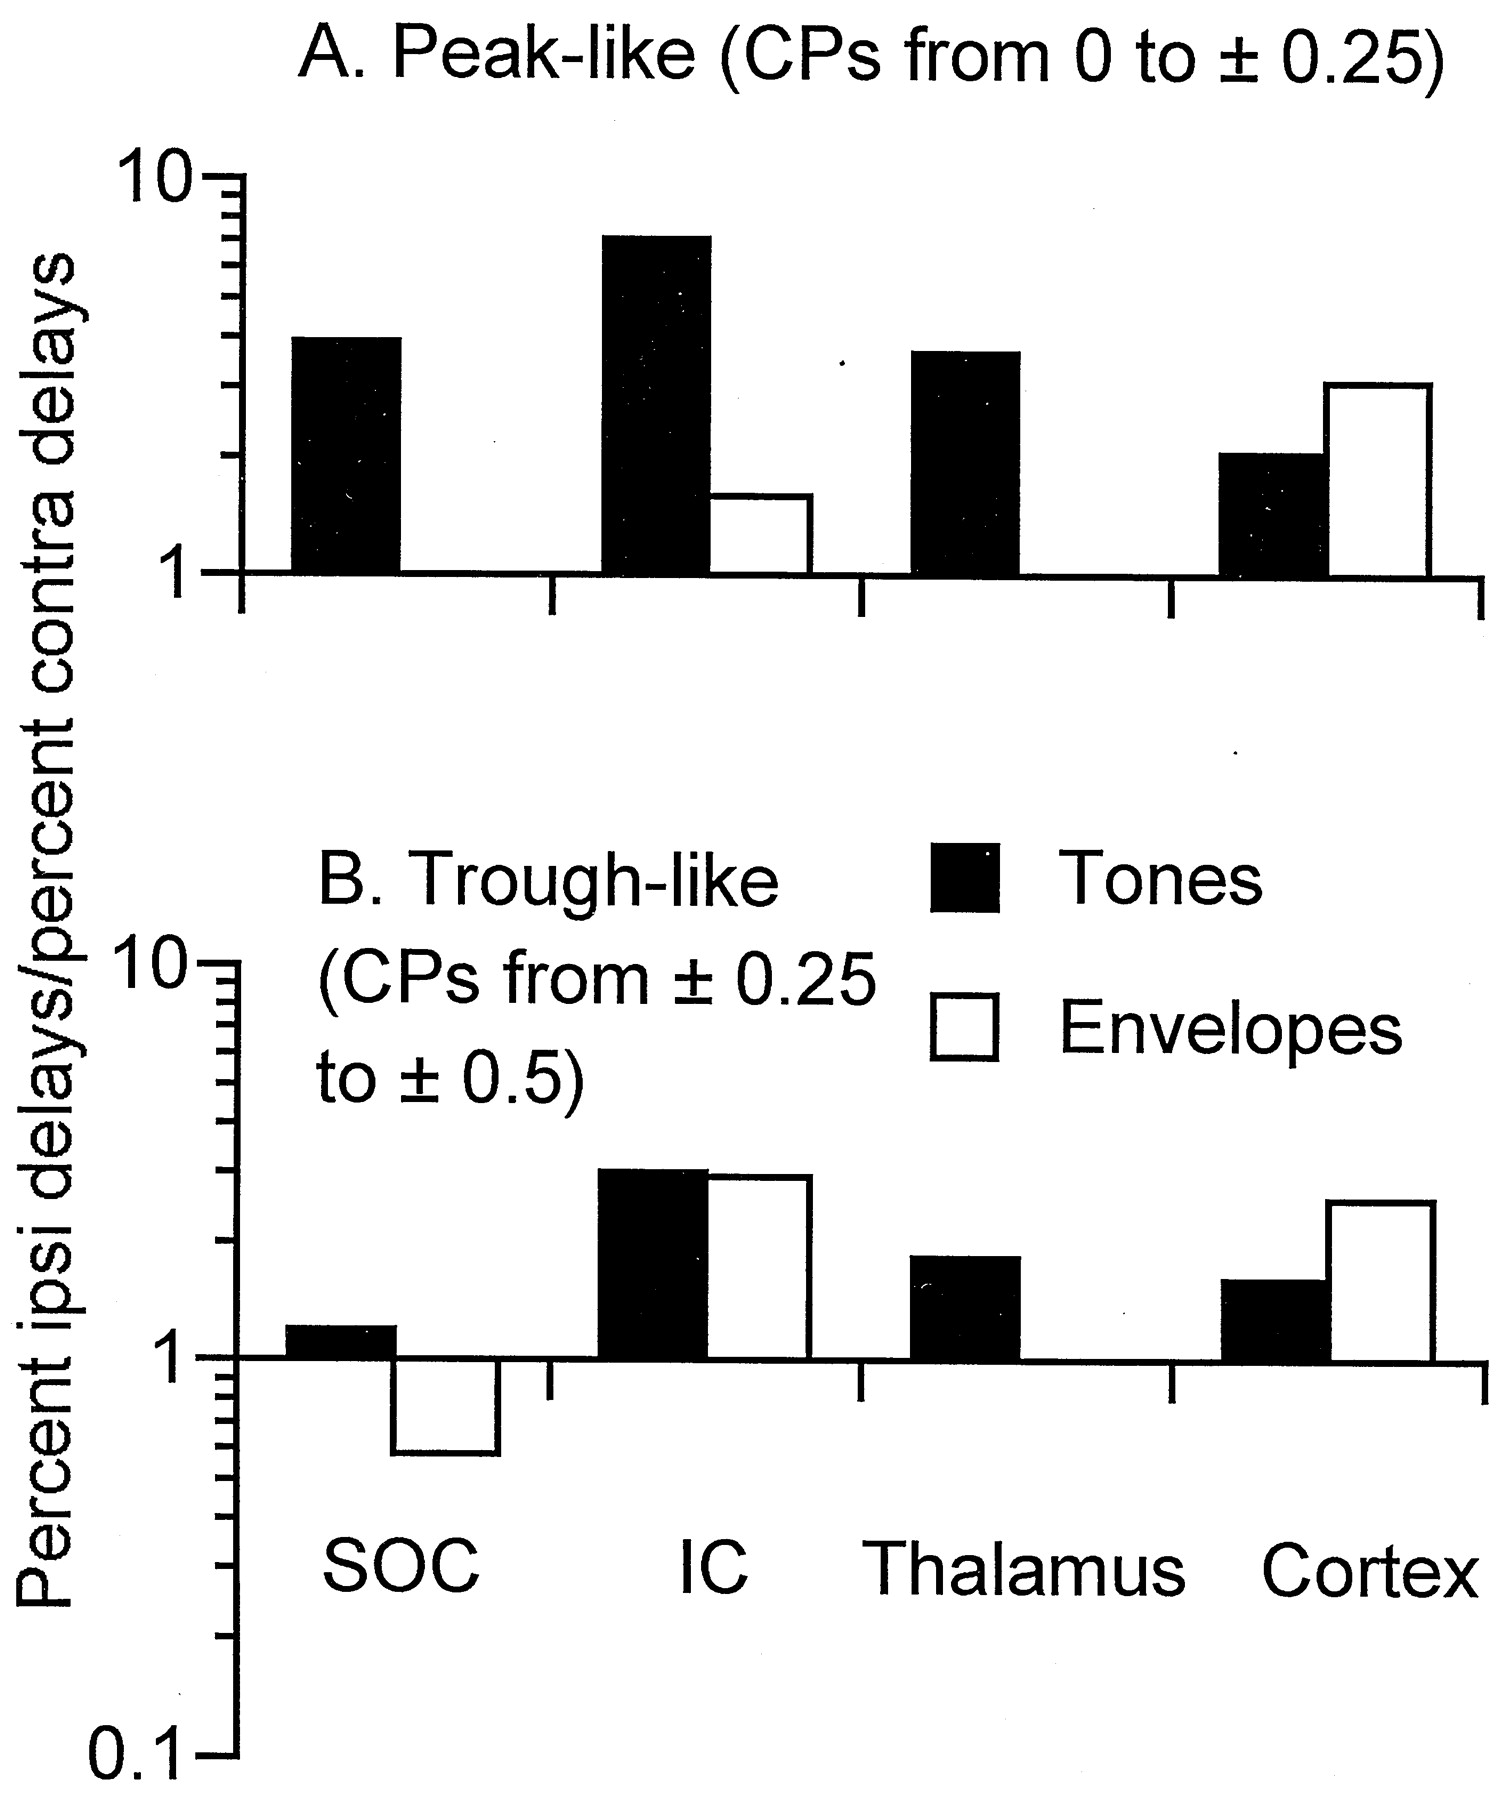
In accord with previous studies of the cortex and other brain levels, the representation of best ITDs in the auditory cortex of the rabbit was primarily to ipsilateral delays associated with sounds in contralateral space. In Figure 9, we compare the bias for contralateral space of the best ITDs in the cortex with that of other brain levels, including the SOC, IC, and auditory thalamus. The bars show the proportion of neurons with best ITDs to ipsilateral delays (contralateral space) divided by the proportion of neurons with best ITDs to contralateral delays (ipsilateral space). Above the level of the SOC, the contralateral representation of ITDs predominated for both peak- and trough-like neurons (Fig. 9A,B, respectively) and for ITD sensitivity to both low-frequency sounds and envelopes (closed andopen bars, respectively). For peak-like neurons, there was also a large contralateral bias in the SOC. In contrast, for trough-like neurons the bias for contralateral space in the SOC was quite small for ITD sensitivity to low-frequency sounds, and there was an ipsilateral bias for sensitivity to envelopes. Thus, the bias for contralateral space in the best ITDs for trough-like neurons seen in the cortex seems to depend on a transformation that occurs between the SOC and IC.

Comparison of the bias in the best ITD for contralateral space for neurons from different brain levels. Thebars show the proportion of neurons with best ITDs to ipsilateral delays (associated with sounds in contralateral space) divided by the proportion of neurons with best ITDs to contralateral delays. A, For peak-type neurons from the SOC to the cortex, there was a preponderance of neurons with best ITDs to ipsilateral delays, indicating a bias for sounds in contralateral space. B, For trough-type neurons, the bias for contralateral space in the SOC was quite weak for neurons sensitive to ITDs in low-frequency sounds, and for neurons sensitive to ITDs in envelopes, the bias was for contralateral space. Above the level of the SOC, there was a bias for contralateral space comparable with that for peak-type neurons. Thus, a transformation in the distribution of best ITDs occurred for trough-type neurons between the SOC and higher levels. All neurons were recorded from unanesthetized rabbits using techniques similar to those used for this study. The numbers of neurons for each level were as follows: for SOC tones, peak-like, 54, and trough-like, 46; for SOC envelopes, trough-like, 19; for IC tones, peak-like, 226, and trough-like, 116; for IC envelopes, peak-like, 70, and trough-like, 90; for thalamus tones, peak-like, 187, and trough-like, 119; for cortex tones, peak-like, 247, and trough-like, 163; and for cortex envelopes, peak-like, 78, and trough-like, 48.
DISCUSSION
Our main result is that the distribution of best ITDs was continuous across peak-, trough-, and intermediate-type neurons and across sensitivity to ITDs in low-frequency sounds and envelopes. Thus, Jeffress-type models that depend exclusively on delay lines and peak-type neurons to encode ITDs capture only a part of the ITD representation in the brain. In the following, we will first compare our results with those from previous studies, then discuss how subcortical processing may contribute to the cortical representation described, and end by considering the functional significance of the results.
Comparison with previous studies
Cortical studies of ITD sensitivity are remarkably few (Brugge et al., 1969; Brugge and Merzenich, 1973; Benson and Teas, 1976; Reale and Brugge, 1990), and none have considered ITDs in envelopes. The previous studies examined few neurons and few frequencies for each neuron. On the basis of responses to approximately three frequencies per neuron,Benson and Teas (1976) reported that most neurons did not show sufficient alignment of their delay curves to have a CD. Reale and Brugge (1990) recorded over a wider range of frequencies and reported that most cortical neurons showed linear changes in mean interaural phase with frequency according to the criterion defined by Yin and Kuwada (1983) and thus had a CD. In agreement with our results, they reported the presence of peak-, trough-, and intermediate-type responses.
Construction of a continuous representation of ITDs
Much evidence indicates that the initial site of ITD processing is in the SOC, including both the medial superior olive (MSO) and the lateral superior olive (LSO). However, there has been no coherent view of how the peak-like neurons most common in the MSO and the trough-like neurons most common in the LSO may be related. The continuum among response types reported here indicates that both nuclei work together to provide a single representation of auditory space. This view is supported by the physiology at higher levels and by the anatomy of the output pathways from the SOC. At levels above the SOC, peak- and trough-like responses occur in the same rather than in separate nuclei. Anatomically, the projections from the MSO and LSO to the IC overlap to a considerable extent (Henkel and Brunso-Bechtold, 1993; Grothe et al., 1994; Oliver et al., 1995; Kelly et al., 1998). Interactions among putative MSO and LSO inputs can be demonstrated in responses of IC neurons (Batra et al., 1993; McAlpine et al., 1998).
Above the level of the SOC, a contralateral representation of ITDs predominated for both peak- and trough-like neurons (Fig. 9). In the SOC, in contrast, the bias for contralateral space for trough-like neurons was small for low-frequency sounds, and for envelopes the bias was for ipsilateral space. This transformation between the SOC and higher levels is consistent with the principal excitatory projection of the LSO, which is crossed (Saint Marie et al., 1989; Glendenning et al., 1992; Oliver et al., 1995). That is, the crossed LSO projection appears to transform a representation of space in the SOC that is discontinuous between the MSO and LSO to one that is continuous and predominately contralateral at higher levels. This view is supported by unilateral lesions of the SOC, which yield bilateral deficits in sound localization, whereas unilateral lesions at higher levels cause predominantly contralateral deficits (Kavanagh and Kelly, 1992).
Other pathways also support the physiological results observed. The consistent bias for contralateral space across levels for peak-type neurons is presumably based on the predominantly ipsilateral projections starting from the MSO and continuing to the cortex. The LSO has a small ipsilateral excitatory projection, which should transmit trough-type responses with best ITDs primarily to ipsilateral space. Taken together, these projections can account for the distribution of best ITDs seen in the cortex, which consists of a central representation of peak-like neurons flanked on either side by trough-like neurons in which the contralateral representation predominates (Fig. 8E,F).
In addition to peak- and trough-type responses, the proposed continuum emphasizes the presence of intermediate-type responses. The SOC has been shown recently to contain many neurons with intermediate-type responses (Batra et al., 1997a,b). Such neurons could be derived from mismatches of frequency inputs to the two sides (Schroeder, 1977;Shamma et al., 1989; Bonham and Lewis, 1999) or via inhibition (Batra et al., 1997a; Grothe and Park, 1998). The distribution of CPs in the SOC is less flat than is that in the auditory cortex (Yin and Chan, 1990; Spitzer and Semple, 1995; Joris, 1996; Batra et al., 1997a), suggesting that the numbers of intermediate-type neurons increase at higher levels in the pathway. It has been shown that intermediate-type responses can be created by a convergence of peak- and trough-type inputs in the IC (McAlpine et al., 1998). Similarly, computations indicate that increasing the strength of ITD-tuned inhibition onto IC neurons can cause a shift from peak- to trough-type responses (Cai et al., 1998). Thus, mechanisms for creating the continuum observed in the cortex start at the most peripheral level and accumulate as ITD information ascends through the auditory pathways.
Functional significance of the proposed continuum
The continuum proposed assumes that the signal encoded is the best ITD, or peak of firing. In the following, we will first consider other possible interpretations. We will then consider the functional implications of the proposed continuum.
A contrasting view would be that while peak-type neurons encode the ITD by the peak of response, trough-type neurons use the trough. Such an organization would resemble on- and off-center cells in the visual system. However, if peak- and trough-type neurons were providing information that differed only in sign, there would be no need for a continuum between them. The large numbers of intermediate neurons at all levels make a simple dichotomy between peak- and trough-type neurons less credible.
Another difficulty is that if both peak- and trough-type neurons provide information about relatively small ITDs, then the distributions should be governed by the size of the head. However, distributions of CDs from all animals are similar, despite wide variation in head size (Palmer et al., 1990; Grothe and Park, 1998). Thus, there is little reason to assume that trough-type neurons signal the ITD of the trough simply because it occurs within the head width in most neurons.
It is also possible that neither the peaks nor the troughs are the salient response features, but that the slope between them is (Skottun, 1998; McAlpine et al., 1999). However, although the slopes are typically to smaller ITDs than are the peaks, there are still many neurons, especially those sensitive to envelopes, with slopes that lie well outside the head width, and there is a continuum between neurons with slopes at small and large ITDs.
In humans wearing headphones, the side with a leading ITD can be discerned for ITDs >10 times the head width (e.g., >10 msec) (Blodgett et al., 1956; Mossup and Culling, 1998). Experiments to probe the ability of humans to compensate for external delays with internal processing indicate that sensitivity to large ITDs cannot occur via the use of elements tuned only to short delays but that internal representations of delay up to at least several milliseconds must exist (van der Heijden and Trahiotis, 1998). If peak- and trough-type neurons were each signaling a similar range of ITDs, delay lines up to these extreme ITDs would seem necessary. Alternatively, the amplification of the ITD representation by variations in CP and frequency tuning can allow for sensitivity to very long ITDs without the need for comparably large delay lines.
In our scheme, large ITDs are principally encoded by trough-like neurons, which will be suppressed by ITDs that occur within the head width. This suggests that the signal that drives these neurons is not large ITDs per se but rather the absence of a small ITD, a condition that arises when sounds at the two ears have a low correlation. A relationship between ITD sensitivity and the correlation of signals at the ears has long been known (Sayers and Cherry, 1957; Blauert, 1978;Colburn and Durlach, 1978; Bernstein and Trahiotis, 1996). Highly correlated signals that have an ITD within the head width yield a fused and compact sound image with a strong perception of azimuthal location. As the correlation declines, the image broadens, and the localization strength diminishes (Jeffress et al., 1962; Blauert and Lindemann, 1986). Physiologically, neurons sensitive to ITDs are also sensitive to interaural correlation (Yin et al., 1987; Albeck and Konishi, 1995;Saberi et al., 1998). Extending the representation to large ITDs may therefore serve to create a continuous representation of the binaural correlation.
In a sound field, the interaural correlation is affected by many factors, including the size of the space, the number of sources, and the number and position of reflective surfaces. Because most sounds have dynamically changing envelopes, the interaural correlation is dynamically changing. Periods of low correlation may contain regularities related to the patterns of reverberation defined by the room acoustics. We therefore suggest that the large axis of ITD sensitivity may be useful not only for sound localization but also for gaining information about auditory space.
Footnotes
- Received September 14, 1999.
- Revision received November 30, 1999.
- Accepted December 1, 1999.
This study was supported by National Institutes of Health Grants DC03948 and DC01366 and by National Science Foundation Grant IBN9807872. We thank Lisa M. Fitzpatrick for technical assistance and Drs. Constantine Trahiotis and Leslie R. Bernstein for lively discussions of this work.
Correspondence should be addressed to Dr. Douglas C. Fitzpatrick, Department of Otolaryngology, University of North Carolina at Chapel Hill, 610 Burnett-Womack Building, CB# 7070, Chapel Hill, NC 27510. E-mail: dcf{at}med.unc.edu.
Dr. Batra's present address: Department of Anatomy, University of Mississippi Medical Center, 2500 North State Street, Jackson, MS 39216.
- Copyright © 2000 Society for Neuroscience