

Article Figures & Data
Figures
- Fig. 1.
Construction of the log-interspike interval histogram (log-ISIH). Each panel shows the ISIHs of the m-sequence response (solid line) and the response to a uniform field at the same mean luminance (shaded) of a simple cell (44/9t) that fired 21.0 spikes/sec, 35,581 ISIs total.Top, Standard ISIH (1 msec bins); middle, standard ISIH plotted on a logarithmic time axis;bottom, log-ISIH consisting of 300 bins spaced logarithmically between 1 msec and 10 sec, which bracketed the distribution of ISIHs found in the data. Each bin is 3.1% larger than the previous one. We obtain a relatively smooth histogram by applying a uniformly distributed, random timing jitter to each ISI, the magnitude of which is at most half the data collection resolution of 0.1 msec. The log-ISIH allows us to easily distinguish three separate ISI peaks, which are not readily visible in the standard ISIH.
- Fig. 2.
Division of log-ISIHs into component peaks. Thetop four panels are the responses of different neurons to the m-sequence stimulus. Log-ISIHs consist of 200 bins spaced logarithmically between 0.1 msec and 2 sec, so that each bin is 5.1% larger than the previous one. Each log-ISIH is divided, by eye, into its component peaks, which are then color-coded according to the position of the maximum (black for <3 msec,light gray for 3–38 msec, and dark grayfor >38 msec). Top, Same simple cell as in Figure 1; three peaks. Second panel, Simple cell (38/6), 5.9 spikes/sec, 11,343 ISIs; two peaks (short and long). Third panel, Simple cell (34/12t), 5.2 spikes/sec, 9,997 ISIs; two peaks (medium and long). Fourth panel, complex cell, 29.9 spikes/sec, 57,943 ISIs; one peak (medium). The boundary positions across 66 neurons are collected into a log-ISIH (bottom panel), which reveals a tightly clustered, bimodal distribution.
- Fig. 3.
Real versus exchange-resampled log-ISIHs. We compare the log-ISIHs (same parameters as in Fig. 2) of real spike trains (shaded) with those obtained from a resampling procedure that preserves the firing rate modulation and distribution of spikes per trial from the original data (solid lines). If the original data were consistent with a modulated Poisson process, then the original and resampled log-ISIHs in all panels would superimpose. Top row, left panel(asterisk), Complex cell (33/1), 31.7 spikes/sec, 61,556 ISIs. Top row, right panel(plus sign), Simple cell (39/9), 34.7 spikes/sec, 67,269 ISIs. Middle row, left panel, Simple cell (35/1), 10.0 spikes/sec, 19,283 ISIs. The other three log-ISIHs are from Figure 2.
- Fig. 4.
Receptive-field maps. A, Complex cell (33/1), average firing rate 31.7 spikes/sec, spatial extent 1°22′ × 1°22′, information rate 25.2 bits/sec or 0.79 bits/spike, efficiency 17.8%, log-ISIH in Figure 3(asterisk). Calibration: −4.9 to 4.9 spikes/sec. B, Simple cell (39/9), average firing rate 34.7 spikes/sec, spatial extent 1°22′ × 1°39′, information rate 31.2 bits/sec or 0.90 bits/spike, efficiency 20.5%, log-ISIH in Figure3 (plus sign). Calibration: −12.9 to 12.9 spikes/sec. In each panel, the top row is the RF map of the full response, the second row is the RF map of the short-ISI subset (10% of spikes in A, 24% inB), the third row is the RF map of the medium-ISI subset (68 and 50%), and the bottom row is the RF map of the long-ISI subset (22 and 26%). Values on the calibration bar refer to the RF map of the full response only (f in Eq. 1 and 2); to obtain values for any of the ISI subsets (s), multiply the full-response values by the fraction of spikes in that subset.
- Fig. 5.
Across-neuron distributions of RF map indices. Data from 66 neurons. Box plot whiskers show the 5th and 95th percentiles, and box boundaries show the 25th and 75th percentiles. Thehorizontal line divides each box at the median, and thesquare represents the mean. Top, Percentage of spikes with preceding ISIs <3 msec (short), 3–38 msec (medium), and >38 msec (long). Middle, Similarity index (or correlation coefficient) between the subset and full-response RF maps; values can be between −1 and +1. Bottom, Efficacy, or average contribution made by spikes in each subset to the overall RF map properties. An efficacy of 1 means that the spikes in that subset contribute as much as expected, given their number. See Results for mathematical definitions of the similarity index and efficacy.
- Fig. 6.
RF map changes: real versus exchange-resampled. In each panel, we plot the similarity index (left column) and efficacy (right column) for real data on the horizontal axis, and the mean value of the same parameter derived from 200 exchange resamplings of the real data on the vertical axis. Data are from 66 neurons, and each point represents a different neuron. The exchange-resampling procedure tests the hypothesis that the observed RF map changes could have been generated by a neuron that fires spikes according to a rate code with exactly the same firing rate modulation as the original response. Filled squares represent subsets for which the real data were significantly different from the resampled data, that is, points that fell significantly (p < 0.05, two-tailed direct comparison) off the diagonal in each panel.
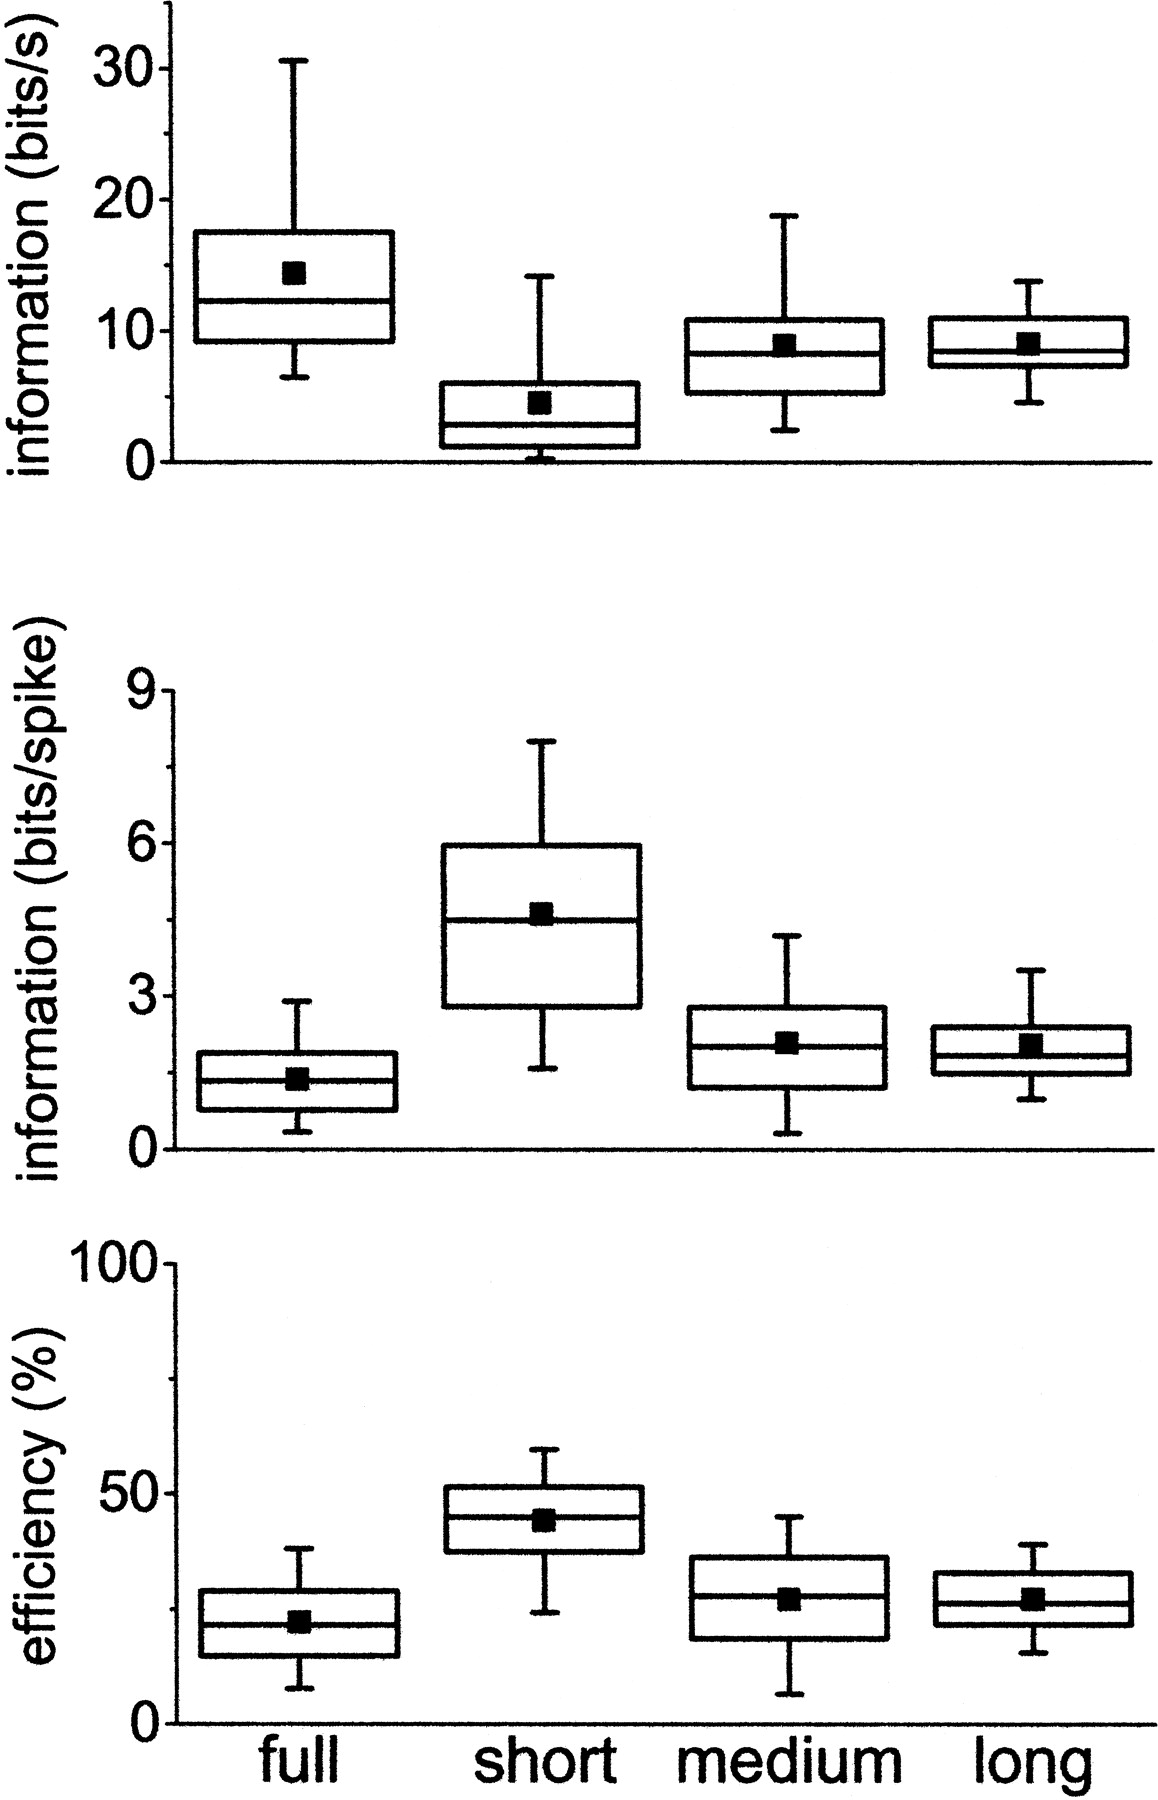
- Fig. 7.
Across-neuron distributions of transmitted information values. Data are from 98 neurons. As in Figure 5, box plot whiskers show the 5th and 95th percentiles, and box boundaries show the 25th and 75th percentiles. The horizontal line divides each box at the median, and the square represents the mean. The full response (leftmost distribution in each panel) is compared with each of the three ISI subset responses.Top, Transmitted information, measured in units of bits per second (bits/s). Middle, Transmitted information, bits per spike (bits/spike).Bottom, Efficiency, or percentage of the total signal entropy (see Materials and Methods) that is used to transmit stimulus-related information.
- Fig. 8.
Information: real versus exchange-resampled. In each panel, we plot the information in bits per second (bits/s) (left column) and bits per spike (bits/spike) (right column) for real data on the horizontal axis, and the mean value of the same parameter derived from 40 exchange resamplings of the real data on the vertical axis. Data are from 98 neurons, and each point represents a different neuron. The exchange resampling procedure tests the hypothesis that the observed RF map changes could have been generated by a neuron that fires spikes according to a rate code with exactly the same firing rate modulation as the original response. Filled symbolsrepresent subsets for which the real data were significantly different from the resampled data, that is, points that fell significantly (p < 0.05, two-tailed direct comparison) off the diagonal in each panel.


