

Abstract
Whole-cell recordings have been used to extensively characterize the voltage-dependent inhibition of N-type calcium current induced by various neurotransmitters. Results from these studies have yielded several predictions on the effect of inhibition on N-channel gating, namely delayed channel opening and inhibition-induced reluctant openings. Previous single N-channel studies observed delayed channel opening but failed to find reluctant openings. However, strong depolarizations may be necessary to see reluctant openings, but this was not tested. We have examined N-channel gating at voltages depolarized to those used previously and found a neurotransmitter-induced open state that has properties predicted for the reluctant open state. The openings had lower open probability (Po) and brief open times compared to the dominant gating state observed in control (highPo). These reluctant events were reduced after strong depolarizing pulses used to reverse inhibition. The threshold voltage for activation of reluctant events was ∼30 mV depolarized to that of the normal gating state (highPo). However, an action potential will provide sufficient depolarization to open reluctant N-channels.
- cell-attached
- patch-clamp
- single Ca2+ channel
- N-type calcium current
- norepinephrine
- willing–reluctant model
Neurotransmitters can inhibit synaptic transmitter release by reducing N-type calcium current in the nerve terminal (Yawo and Chuhma, 1993). The most commonly observed effect of neurotransmitters on N-current is a voltage-dependent inhibition (Hille, 1994; Dolphin, 1996) that appears to be intracellularly mediated by G-protein βγ subunits (Gβγ;Herlitze et al., 1996; Ikeda, 1996). Along with voltage dependence (temporary relief by strong depolarizations), this type of inhibition is also time-dependent because current activation is slowed. The voltage dependence appears to result from the transient dissociation of Gβγ from the N-channel (Golard and Siegelbaum, 1993; Elmslie and Jones, 1994; Ehrlich and Elmslie, 1995; Zamponi and Snutch, 1998). Thus, evoked currents after a strong depolarization are restored to near control levels (facilitation) and to normal activation kinetics.
In addition to changes in activation kinetics, whole-cell data support the idea that inhibited N-channels can open to a new reluctant open state. The evidence includes: (1) strong depolarizations can open inhibited channels without inducing facilitation, and (2) modulated channels close more quickly, implying multiple open states (Elmslie et al., 1990; Boland and Bean, 1993). Such observations were used to generate the willing–reluctant model (Fig.1; Bean, 1989; Elmslie et al., 1990). In this model there are two pathways out of the reluctant “mode”, so the predominant pathway used by the channel can depend on the conditions used to measure channel activity. Specifically, for weak depolarizations [in which the reluctant closing (RC)–reluctant opening (RO) equilibrium favors RC], the RC–willing closing (WC) pathway dominates, producing long latencies to first channel opening. However, for strong depolarizations RO is favored over RC, so the RC–RO transition can occur first. Of course, this four-state model is an over-simplification (multiple WC and RC states are likely), but even after 10 years it still captures the essence of the problem. The molecular interpretation of the model is that the reluctant (R) states are Gβγ-bound, whereas the willing (W) states are Gβγ-free. Thus, the “W” states are the normal gating states. The affinity of Gβγ is state-dependent with higher affinity for the closed state. Thus, the observation of reluctant openings will imply that the open channel can bind Gβγ.

The willing–reluctant model with rate constants (in sec−1) derived from whole-cell data from frog sympathetic neurons (Elmslie et al., 1990). The rate constants for normal opening and closing are k1 = 200e+0.06(V + 5) andk−1 = 200e−0.06(V + 5), respectively. WC and WO represent the willing closed and open states, respectively. RC and RO represent the reluctant closed and open states, respectively.
Two laboratories have previously examined the effect of neurotransmitters on N-channel gating. Both groups found delayed channel opening, but failed to observe reluctant openings (Carabelli et al., 1996; Patil et al., 1996). Two possibilities for this are that (1) the channels used in these studies are fundamentally different or (2) the voltage steps were too hyperpolarized. In support of the first possibility, faster N-channel closing during neurotransmitter-induced inhibition has not been observed in all preparations (Kasai, 1992). Single calcium channel studies have traditionally focused on relatively negative voltages, in which the signal-to-noise ratio is good. However, reluctant openings should be rare at these voltages. We have reexamined this issue using low-noise recordings to examine more positive voltages, and a preparation in which whole-cell data suggest that reluctant openings should exist. We have found that N-channels can exhibit an inhibition-induced reluctant gating state as predicted by the willing–reluctant model.
MATERIALS AND METHODS
Cells. Neurons were dissociated from caudal paravertebral sympathetic ganglia of adult bullfrogs (Rana catesbeiana) by a collagenase/dispase digestion and trituration. Cells were maintained in modified L-15 culture medium at 4°C until use (usually 1–10 d) (Kuffler and Sejnowski, 1983; Jones, 1987;Elmslie, 1992).
Cell-attached patch recording. Recording conditions were similar to those previously published from our laboratory (Elmslie, 1997). Briefly, the pipette solution consisted of (in mm): 100 BaCl2, 10 tetraethylammonium chloride, 5 4-aminopyridine, and 10N-methyl-d-glucamine (NMG)-HEPES. The extracellular solution contained (in mm): 100 KCl, 10 K-HEPES, and 5 NMG-EGTA, 0.001 (±) Bay K 8644, pH 7.2. This high-potassium solution effectively set the membrane potential to 0 mV (Elmslie, 1997). Bay K 8644 was present to reveal L-channels in the patch (Plummer et al., 1989). Patches containing L-type calcium channels were excluded from analysis. When testing the effect of norepinephrine (NE) on N-channel gating, either 30 or 100 μm NE was added to the pipette solution. A 30 μm concentration was used to slow potential desensitization of the adrenergic receptors, which was clearly observed in some patches exposed to 100 μm NE. The dose–response relationship generated from whole-cell data in 100 mm Ba2+ shows that 30 μm NE elicits inhibitions ∼90% of maximum (Lee et al., 2000). These high concentrations of NE were required to overcome the competitive block of the adrenergic receptors by the high concentration of Ba2+ (Lee et al., 2000).
Electrodes for single-channel experiments were fabricated from fiber-filled glass [either Corning 7740, Kimble EN-1 (both outer diameter (o.d.) 2.0 mm, inner diameter (i.d.) 0.7 mm; Garner Glass, Indian Hills, CA) or Corning 7052 (o.d. 1.5 mm, i.d. 0.86 mm; A-M Systems, Everett, WA)]. These electrodes had resistances ranging from 15 to 40 MΩ and were coated with the General Electric equivalent of Sylgard (GE Silicones RTV615; General Electric Company, Waterford, NY).
An Axopatch 200A amplifier (Axon Instruments, Foster City, CA) was used to amplify and filter (2 kHz) the currents. Currents were amplified an additional 10 times by a Frequency Devices 900 Bessel filter and digitized with a MacAdios II analog-to-digital converter (GW Instruments, Somerville, MA) at 10 kHz (five times the filter cutoff frequency). The experiment was controlled by an Macintosh II computer running data acquisition software written by Dr. Stephen Ikeda (Guthrie Research Institute, Sayre, PA), and the data were analyzed using IgorPro (WaveMetrics, Lake Oswego, OR).
As described previously, some data were obtained in sets of 100 voltage steps of 100 msec duration delivered at a 2 sec interval (Lee and Elmslie, 1999). Other data were recorded using a triple pulse protocol to examine the voltage dependence of neurotransmitter-induced inhibition (Fig. 2). This protocol used two 40 msec steps to the same voltage that bracket a 25 msec voltage step to +70 mV, and the steps were given as a set of 100 with an interval of 3 sec. Single N-channels were typically recorded from a holding potential of −40 mV. This holding potential was used to inactivate Ef-channels that contaminate some patches, but N-channels were not inactivated at the −40 mV holding potential (Elmslie, 1997; Lee and Elmslie, 1999). In some patches that did not contain Ef-channels, a holding potential of −80 mV was used. We have found no difference in N-channel activity recorded from these two holding potentials.
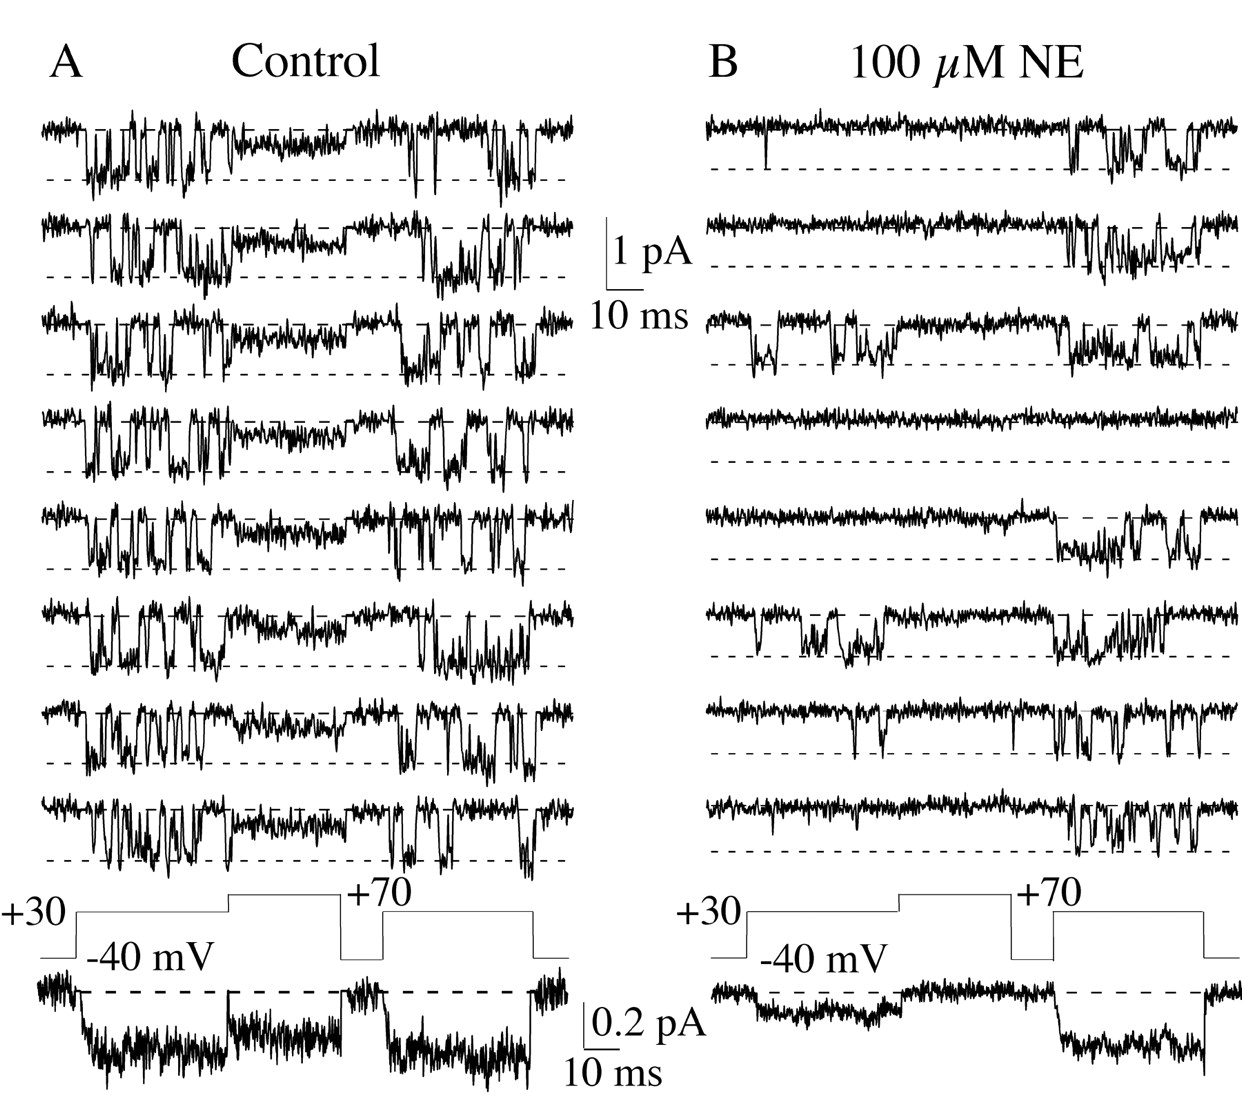
NE induces voltage dependent inhibition of single N-type calcium channels. Eight consecutive sweeps are shown from a patch under control conditions (A) and another patch exposed to 100 μm NE (B). The control patch contained one N-channel and at least one Ef-channel. The NE patch contained only a single N-channel. NE inhibited N-channel activity during the prepulse (preceding the +70 mV conditioning pulse). However, the conditioning pulse restored N-channel activity during the postpulse. At the bottom of each set of individual sweeps is the pseudomacroscopic current, which was generated by averaging 90 sweeps for A and 100 sweeps forB. The difference between the number of sweeps averaged results from exclusion of sweeps that contain transient noise events (Elmslie, 1997). The line with long dashes indicates the zero current level, and theline with the short dashes indicates the open channel current level.
Analysis of single-channel records. Uncorrected capacitative current and voltage-independent leakage current were removed from the records by averaging null sweeps and subtracting them from the active sweeps. Single-channel current amplitudes were determined using low variance analysis (Patlak, 1988, 1993; Elmslie et al., 1994; Elmslie, 1997). Single-channel events were detected using the 50% threshold detection method after being Gaussian-filtered at 1 kHz. These events were log-binned into open and shut dwell time histograms (10 bins/decade; Sigworth and Sine, 1987). The first closed time and the last event in the step (whether closed or open) were excluded from these dwell time histograms. The dwell time distributions were fit to exponential functions using the Marquardt–Levenberg algorithm (IgorPro routine). Three methods were used to determine the number of exponential components required to best fit a dwell time histogram (Colquhoun and Sigworth, 1995). First, the histogram was visually inspected. Second, the reproducibility of the time constants was examined. Third, the χ2 values for two fits were compared to determine if a significantly better fit was obtained with the additional component. The first closed time was used to generate the cumulative first latency histogram.
As described above, the data were Gaussian-filtered at 1 kHz for analysis of events. This was required for data at +40 and +50 mV at which the amplitude of open channel current is small (∼0.5 pA or less). Without this additional filtering the baseline noise routinely triggered the 50% threshold event detector, which made analysis impossible. To be consistent, data from all voltages were filtered at 1 kHz. The data were not corrected for missed events. Treating the data in this manner allowed us to make comparisons with previously published data (Lee and Elmslie, 1999).
As previously described (Lee and Elmslie, 1999), we used two methods to calculate Po during voltage steps. ThePo data in Figure 12 was calculated by dividing the sum of the open times by the step duration. The meanPo was determined by averaging thePo measured from all sweeps at a single voltage (including null sweeps). Plots ofPo versus voltage were fit to the Boltzmann equation. Certain parameters were constrained when fitting the data from NE patches. For the data from postpulse sweeps, the slope was constrained to that observed in control sweeps (slope = 6; Lee and Elmslie, 1999). Whole-cell recordings demonstrate that activation versus voltage relations in the presence of inhibitory neurotransmitters are returned to normal after strong depolarization (Ikeda, 1991). The data from prepulse sweeps in NE were normalized to the maximum Po calculated from the NE postpulse data. Because the inhibition is voltage-dependent, the prepulse Po will reach that of the postpulse (voltage-dependent inhibition transiently reversed) at depolarized voltages.
The other method of calculating Poexcluded the first latency (first shut time) and the last event if the channel was shut. We call this Po-exfor Po excluding first and last shut times (Lee and Elmslie, 1999). This method is best for looking at changes in Po when the channel is actively gating (e.g., when the channel changes gating modes).
RESULTS
Three types of calcium channels have been characterized in frog sympathetic neurons, N-type, L-type, and Ef-type channels (Elmslie, 1997). The criteria for identifying these single calcium channels have been previously published (Elmslie, 1997). Briefly, N-channels recorded in 100 mmBa2+ activate at voltages >0 mV, have a slope conductance ∼20 pS, and have a single-channel current at 0 mV of ∼1.4 pA. L-channels have similar slope conductance and current amplitude as N-type, but gate at more negative potentials in the presence of BayK 8644. Ef-channels have single-channel current ∼1/2 that of N-type and L-type channels, which makes them easily distinguished. In addition, Ef-channels are strongly inactivated by holding the patch potential at −40 mV, which has no effect on N-type or L-type channels (Elmslie et al., 1994; Elmslie, 1997).
The effect of NE was examined in 22 patches containing one or two N-channels. The slope conductance of these N-channels ranged from 17 to 25 pS with a mean of 21.8 ± 2.5 pS (mean ± SD), and the mean current at 0 mV was −1.4 pA. Many of these patches were excluded from detailed analysis because they either (1) contained multiple contaminating Ef-channels with sufficient activity to prevent analysis of N-channel gating, or (2) had a noise level that precluded analysis of N-channel activity at voltages more than +30 mV. The latter point is significant because we could only detect reluctant events at these depolarized voltages. Detailed analysis was applied to eight patches exposed to NE. Five of these patches contained a single N-channel, and another contained one N-channel and one Ef-channel. This Ef-channel had a very low level of activity, which made it easy to exclude these events. Two additional patches contained two N-channels. These patches were used to examine open times, but not shut times or Po. In addition, control data were obtained from 12 patches (no NE in pipette) used in our previous study (Lee and Elmslie, 1999; 22.0 ± 1.5 pS and a mean current at 0 mV of −1.4 pA). Ten of these patches contained a single N-channel, whereas the remaining two patches contained two N-channels.
NE can inhibit single N-channels
The inclusion of 100 μm NE in the pipette solution inhibited N-channels recorded in the majority of patches. Because we were not able to determine control activity before NE application, we exploited the voltage dependence of inhibition and used a strong depolarizing pulse (the conditioning pulse) to temporarily reverse the NE effect (Fig. 2). In whole-cell recordings it has been established that the ratio of the postpulse current amplitude (after the conditioning pulse) to that of the prepulse (preceding the conditioning pulse) is an index of inhibition (Elmslie et al., 1990; Ikeda, 1991;Elmslie, 1992). A ratio near 1 indicates no N-channel inhibition, and increasing postpulse/prepulse (post/pre) ratios correspond to increasing inhibition (Elmslie et al., 1990; Elmslie, 1992). In Figure2b the effect of NE can be observed during the prepulse in which N-channel activity is suppressed relative to that during the postpulse. N-channel activity in control patches was not altered by the conditioning pulse (Figs. 2a,3). To quantify the NE effect, we averaged N-channel activity from many sweeps to obtain a pseudomacroscopic current. The post-pre ratio was calculated from prepulse and postpulse current amplitudes measured from the pseudomacroscopic record for each patch. The average post-pre ratio was 0.9 ± 0.2 (range, 0.7–1.2; n = 6) for N-channels recorded from control patches (Fig. 3). In the presence of 100 μm NE, the mean ratio was 2.4 ± 1.4 (mean ± SD; range, 0.8–5.6; n = 18). However, no inhibition was evident in five of the 18 NE patches because the post-pre ratio (range, 0.8–1.2) overlapped that of control patches (Fig. 3). This was not surprising because it has been shown using macropatches (hundreds of channels in cell-attached patch) that N-channels in some membrane patches were insensitive to NE (Elmslie et al., 1994).

Variable effects of NE on single N-channels. Prepulse and postpulse pseudomacroscopic currents were measured as the average between 5 and 15 msec into the 40 msec depolarization to +30 mV. The ratio of postpulse current to prepulse current was calculated for six control patches and 18 patches exposed to 100 μmNE. A ratio of ∼1 indicates no modulation, whereas ratios > 1 are positively correlated with the magnitude of inhibition.
During neurotransmitter-induced inhibition fast and slow components of whole-cell N-current activation can be observed (Marchetti et al., 1986). The fast component is similar to control activation, whereas the slow component results from voltage-dependent inhibition of N-current (Bean, 1989; Grassi and Lux, 1989; Elmslie et al., 1990). In single channels, the latency to first channel opening correlates with macroscopic activation kinetics. Thus, neurotransmitter-induced inhibition has been shown to increase the delay to first N-channel opening (Carabelli et al., 1996; Patil et al., 1996). Under control conditions, a cumulative distribution of N-channel first latencies typically shows a monotonic rise after a brief delay (Fig.4; see also Lee and Elmslie, 1999). However, the distribution has two components in the presence of NE (Fig. 4). One component is similar to control, whereas the second component shows the delayed channel opening of inhibited N-channels. The short latency activation of the “inhibited” N-channel in some sweeps is interesting because it shows that a single channel can switch between inhibited and control activation kinetics (see Fig. 9).

NE increases the delay to channel opening.A,B, Consecutive sweeps are shown for four voltages from control and NE patches. The control data from 20–40 mV are from one patch, and the data at +50 mV are from a separate patch. Each patch contained one N-channel and at least one Ef-channel. The NE data from 20–40 mV are from one, and the data at +50 mV are from a separate patch. Each patch contained only a single N-channel. The NE concentration was 100 μm for 20–40 mV data and 30 μm for the +50 mV data. The pseudomacroscopic currents for each voltage are shown beneath the relevant sweeps. C, The latency to first channel opening was measured and binned into a cumulative histogram (0.2 msec bin width). To show the effect of NE on the distribution, the histograms were normalized to the number of events in the last bin. The number of sweeps used to generate the histograms were 85 and 47 (+20 mV), 80 and 70 (+30 mV), 37 and 93 (+40 mV), and 238 and 114 (+50 mV) for control and NE patches, respectively.
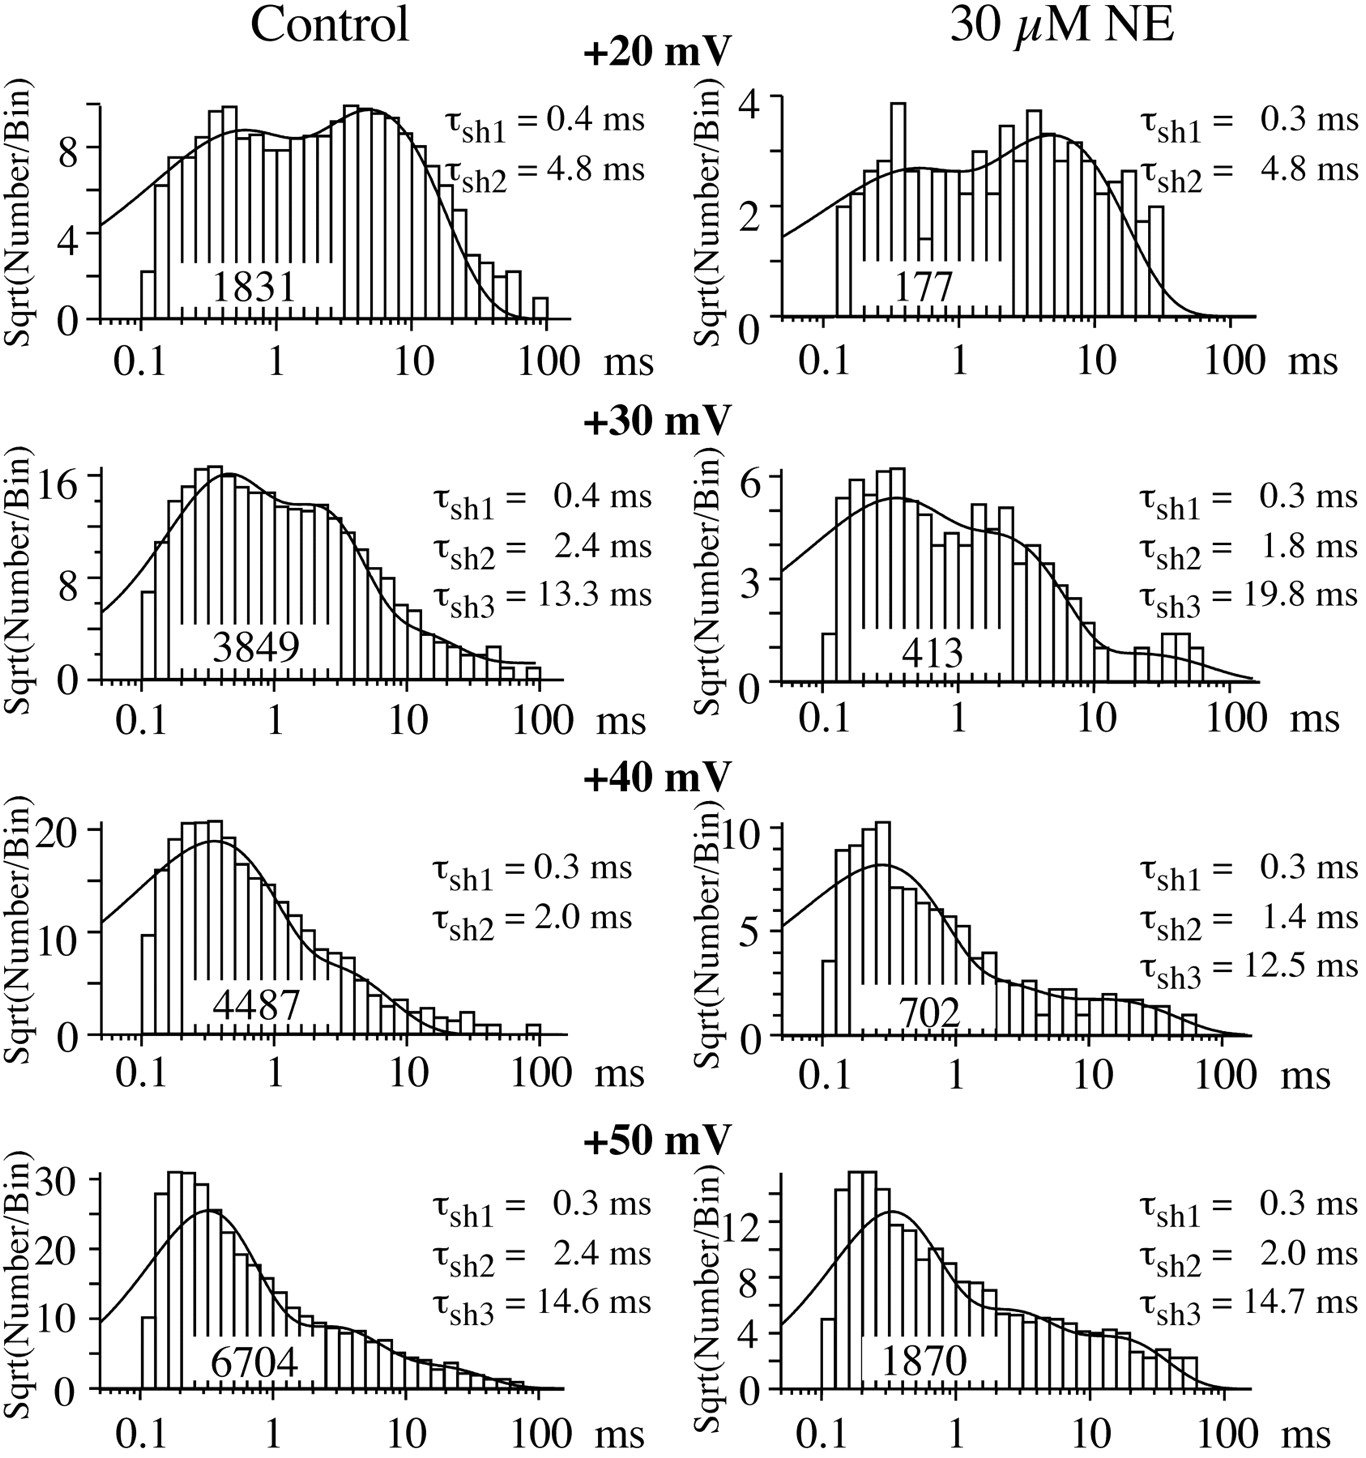
The NE-induced delay in first latency to channel opening occurs with little change in subsequent shut times (Fig.5). This is expected if N-channels follow the RC–WC–willing opening (WO) pathway to open, and WC to RC transitions are rare, because once channels become willing they traverse the same closed states as control channels. Control shut time distributions were generally well described by two exponential functions, but a third component was noted in some patches (Lee and Elmslie, 1999). We observed no differences in shut time distributions between NE and control patches at +20 and +30 mV (Fig. 5). However, NE induced an increase in the frequency of long shut time events at +40 and +50 mV, which resulted in the histograms being consistently well described by three exponential functions (Fig. 5). The mean shut time for the third histogram component at +40 mV was 17 ± 6 msec (mean ± SD) for the six patches examined, and the long shut events comprised 13% of total events. Although shut times of similar duration could be recorded in control patches at +40 mV, their frequency was never sufficient to generate enough events to allow us to obtain consistent fits to three exponential functions (Fig. 5) (see also Lee and Elmslie, 1999). At +50 mV the mean shut times for the long shut events were 9 and 15 msec for the two NE patches examined. Figure5 shows the one control patch in which we were able to fit three exponentials to the shut time histogram at +50 mV. The third component in this histogram comprised 10% of all events, which is smaller than the two NE patches where that component comprised 20% (Fig. 5) and 53% of all events. Alterations in the shut time distribution (as observed at +40 mV) would be expected if N-channels followed the RC–RO–WO pathway.

NE induces a long shut time at +40 and +50 mV. Log binned distributions of shut time measured from control and NE (30 μm) patches. The histogram was generated with 10 bins/decade. The control data are from a single patch that contained one N-channel and at least one Ef-channel. The NE data from 20–40 mV are from one patch, and the data at +50 mV are from a separate patch. Each NE patch contained only a single N-channel. Thesmooth lines were generated from either double or triple exponential fits to the data. The resulting time constants (τsh) are listed along with the number of events used to generate the distribution.
N-channel open times support two pathways to open for inhibited channels. As in control, open time distributions were well fit by a single exponential function at both +20 and +30 mV in patches exposed to NE (Fig. 6), and the mean open times were similar between NE and control patches (Table1). This single exponential distribution indicates a single open state, as expected if the inhibited channel follows the RC–WC–WO pathway. At +40 and +50 mV, the open time distribution was best fit by two exponential functions in all NE patches examined (Fig. 6, Table 1). The mean open time of one component matched that of control patches, whereas the second component yielded a smaller mean open time (Fig. 6, Table 1). The amplitude of the brief component at +40 mV comprised 40 ± 15% (mean ± SD; range, 22–71%) of the total. The brief component at +50 mV comprised 42 and 58% of the total amplitude in the two patches examined. Two mean open times are predicted if the N-channel follows the RC–RO–WO pathway.

NE induces brief openings at +40 and +50 mV, but not at more hyperpolarized voltages. Log binned histograms (10 bins/decade) of open times are shown for N-channel activity from a control and NE patches (30 μm). The control and NE data are from same patches used for shut time histograms (Fig. 5). The solid lines on the +20 and +30 mV histograms were generated by single exponential fits. The control +40 mV histogram was also fit by a single exponential. However, for the +40 mV histogram in NE and the +50 mV histograms (control and NE), the dashed line is the single exponential fit to the data, whereas the solid line is a double exponential fit. The time constants (τo) from the fits are listed for each histogram. The number of events used to generate the distribution is listed on each histogram.
Comparison of mean open times between control and NE-exposed patches
At voltages more than or equal to +40 mV, the frequency of N-channel gating with brief open times and long shut times was substantially increased in NE-exposed patches over control patches. We hypothesize that this results from reluctant gating. If there are separate RC–RO and WC–WO modes (i.e., if the R–W transition is slow), then short ROs should be adjacent to long RCs, and the long WOs adjacent to short WCs. This prediction was examined by plotting the open times of individual events against the following shut time (Fig.7). Figure 7 compiles data from all control and NE patches that contained only one N-channel. As expected from the open and shut time distributions, the data from NE patches was similar to that from control patches for +20 and +30 mV. This supports our conclusion that reluctant openings were rare at these voltages. However, at +40 and +50 mV the NE patches have a large number of brief openings (<1 msec) that are followed by long closings (>10 msec). The fraction of events at +40 mV below aPo = 0.2 cutoff line was 0.13 for NE (1609 of 6199 events) and 0.06 (808 of 13,928 events) for control. At +50 mV this fraction was 0.16 (345 of 2155) for NE and 0.03 (136 of 5080) for control (Po = 0.2 serves as an aid to highlight differences between control and NE patches). The differences between control and NE patches were calculated to be statistically significant using a binomial proportions test for independent samples (Snedecor and Cochran, 1980) with Z= 19 for +40 mV and Z = 16 for +50 mV (Z > 1.7 is significant). For comparison, this fraction at +30 mV was 0.19 for NE (584 of 3081) and 0.16 (2218 of 14165) for control, which was significantly different withZ = 4. At +20 mV the fraction of events below thePo = 0.2 cutoff was 0.41 for control (3400 of 8311) and 0.39 for NE (399 of 1015), which was not significantly different (Z = 1.0). When we combined data from all patches we were able to observe a significant NE-induced increase in events with brief open times followed by long shut times at voltages more than or equal to +30 mV (Fig. 7). However, in individual patches we were only able to detect NE-induced gating changes at voltages more than or equal to +40 mV. It is likely that the NE-induced events were too rare at +30 mV to detect with the number of events we typically recorded from single patches (∼1500 events at +30 mV). Our data are consistent with an NE-induced reluctant gating mode at voltages more than or equal to+40 mV. As predicted by the willing–reluctant model, this mode is characterized by brief open times (≤1 msec) and long shut times (∼15 msec) at +40 and +50 mV.

NE induces reluctant gating that is characterized by brief openings followed by long closings. Open times are plotted against the following shut time for data from all patches containing one N-channel. The line indicates Po = 0.2 and is presented to highlight gating differences between NE and control. Control data are from seven patches for 20–40 mV and two patches for 50 mV. NE data are from five patches for 20 mV, six patches for 30 and 40 mV, and two patches for 50 mV. The number of control open time and shut time pairs plotted are 8311 (20 mV), 14,165 (30 mV), 13,928 (40 mV), and 5080 (50 mV). The number of events plotted in NE are 1015 (20 mV), 3081 (30 mV), 6199 (40 mV), and 2155 (50 mV). The NE concentration was either 30 or 100 μm for 20–40 mV data, but only 30 μm for 50 mV data.
NE induces reluctant openings
We hypothesize that the NE-induced brief openings are reluctant openings. However, under control conditions the N-channel has been observed to switch between two modes of gating at +40 mV, highPo(Po > 0.5) and lowPo(Po < 0.5; Lee and Elmslie, 1999). At +40 mV, the mean open time in the highPo mode was ∼3 msec compared to 1 msec for the low Po gating mode. The mean open time of NE-induced brief openings is close to that of the lowPo gating mode. However, lowPo gating was rare in control sweeps, accounting for only 14% of active sweeps (Lee and Elmslie, 1999). Thus, these brief events could result from either a NE-induced increase in low Po gating or NE-induced reluctant gating. To distinguish between these two possibilities we examined 100 msec steps to +40 mV. We expect that reluctant channels will switch to willing gating during a depolarization that is sufficiently strong to reverse inhibition. Figure8 shows that NE-induced brief openings at +40 mV were typically observed toward the beginning of the voltage step, but switched to long openings (highPo) by the end of the sweep. This was not observed with N-channels gating in the lowPo mode (Fig. 8) (Lee and Elmslie, 1999, their Fig. 6). The low Po gating was observed throughout the voltage step, and this gating could be sustained (∼1 min) before reverting to the highPo mode (Lee and Elmslie, 1999). Therefore, NE-induced gating appears to be distinct from lowPo gating. Because these NE-induced brief events match those of reluctant openings predicted by the willing–reluctant model, we will refer to them as reluctant openings.

A comparison of low Pogating (control) and NE-induced brief openings. A,Twelve consecutive sweeps show the continuous lowPo gating that can be observed in N-channels recorded from control patches. This patch contained only a single N-channel. Note that the low Po gating does not introduce a slow component of activation to the pseudomacroscopic current (averaged from 88 sweeps). B, To compare the NE-induced brief events with low Po gating, twelve nonconsecutive sweeps are shown. Nonconsecutive sweeps were used since sweeps with NE-induced brief events are not clustered like those showing low Po gating. This patch contained only a single N-channel. Note the slow activation of the pseudomacroscopic current (average of 95 sweeps).
To confirm the effect of depolarization on reluctant N-channels, we examined the effect of a +70 mV conditioning step on N-channel gating in the presence of NE. Figure 9 shows 24 consecutive sweeps from a patch exposed to 100 μm NE. The black arrowheads point to the seven sweeps with reluctant openings in the prepulse. In six of seven sweeps, N-channel activity was converted to high Po gating after the conditioning step to +70 mV. The remaining sweep showed a long delay in the postpulse before the channel opened (Fig. 9, open arrowhead). This type of gating will be examined in further detail below. Note that the channel switches between inhibited and control gating even though the patch is constantly exposed to NE.

Strong depolarization converts reluctant events into high Po gating. Twenty-four consecutive sweeps illustrate the effect of 100 μm NE on N-channel gating. The black arrowheads indicate the sweeps with reluctant openings during the prepulse. The open arrowheads show the sweeps with delayed channel opening and reluctant events during the postpulse. The black circlesshow sweeps with no openings during the prepulse, but highPo gating during the postpulse. Note from the prepulses that the channel switches between control-like (short latency to high Po gating) and inhibited gating. This patch contained only a single N-channel. The pseudomacroscopic current shown at the bottom is an average of 99 sweeps. Facilitation measured from this pseudomacroscopic current was 1.9.
The data presented indicates that the primary effect of NE at voltages less than +40 mV is to increase the latency to first opening, whereas NE induces reluctant gating as the membrane is depolarized more than or equal to +40 mV. Thus, NE should only affect N-channelPo (excluding the first latency) at those depolarized voltages. In addition, the conditioning pulse should reduce any NE-induced changes in Po. To test these predictions, Pohistograms were generated from prepulse and postpulse sweeps. Because we were interested in measuring Poonly during active gating, we calculatedPo by excluding first latency and last event if the channel was closed [we call thisPo-ex to distinguish it from the other method of calculating Po (see Materials and Methods; see also Lee and Elmslie, 1999)]. In agreement with the open time and shut time distributions, we did not notice substantial differences in distribution of N-channelPo-ex between prepulses versus postpulses at +20 and +30 mV, except that there were more active sweeps in the postpulse than in the prepulse (Fig.10). However, at +40 mV thePo-ex histograms from prepulse and postpulse sweeps show two peaks, one atPo ∼0.1 and the otherPo ∼0.8 (Fig. 10). The peak atPo = 0.8 corresponds to highPo gating (Lee and Elmslie, 1999). Strong depolarization appears to switch the gating to highPo, because the peak atPo = 0.8 is increased whereas the activity at Po < 0.2 is decreased in the histogram from postpulse sweeps. Thus, reluctant events appear to gate with a Po < 0.2 at +40 mV.

Strong depolarization shifts the gating of inhibited N-channels from reluctant to highPo at +40 mV.Po-ex was measured for each sweep by dividing the sum of open times by the sum of shut times (excluding the first and last shut times; see Materials and Methods). Data from three patches exposed to 100 μm NE are included in the histogram. The bin width was 0.05 Pounits.
As shown before (Fig. 7), NE-induced brief openings are adjacent to long closings, which we hypothesize to result from reluctant gating. Because strong depolarization temporarily reverses the NE-induced inhibition, such a depolarization should reduce reluctant gating. This prediction was examined by plotting the open times of individual events against the following shut time (Fig.11). In agreement with thePo histograms, there were no differences observed in the scatter plots of prepulse and postpulse events at either +20 or +30 mV. At +40 mV, there were many events below the Po = 0.2 line during the prepulse, but the +70 mV conditioning pulse reduced the frequency of those events in the postpulse. On average, 21% of prepulse events (174 of 830) fell below the Po = 0.2 line, compared to 9% of postpulse events (145 of 1612; data from three single N-channel patches). This difference was calculated to be significant (Z = 7.7) using a binomial proportions test for independent samples (Snedecor and Cochran, 1980). For comparison, the prepulse versus postpulse data at +30 mV was not significantly different because Z = 0.52. These data strongly support the prediction of the willing–reluctant model that inhibition places the N-channel into a reluctant gating state. The reluctant open state appears to have a Po ∼0.1 and a mean open time <1 msec at + 40 mV.

The conditioning pulse reduces reluctant events at +40 mV. Individual events were plotted as their open time versus the following shut time. The data are from the same three patches in Figure10. The solid line indicatesPo = 0.2 and is presented to highlight gating differences at +40 mV. The percentage of events beyond thePo < 0.2 line were 40 and 40% (+20 mV), 17 and 16% (+30 mV), and 21 and 9% (+40 mV) for the prepulse and postpulse sweeps, respectively. The number of open time and shut time pairs plotted are 246 and 523 (+20 mV), 524 and 1174 (+30 mV), and 830 and 1612 (+40 mV) for the prepulse and postpulse sweeps, respectively.
Postpulse Po is inhibited by NE
Whole-cell experiments show that strong depolarization cannot fully recover the inhibited N-current in sympathetic neurons (i.e., postpulse current is always inhibited compared to control currents;Elmslie et al., 1990; Beech et al., 1992; Boland and Bean, 1993; Werz et al., 1993). It has been speculated that this results from a voltage-independent component to the neurotransmitter-induced inhibition (Beech et al., 1992; Hille, 1994). Alternatively, the inhibited postpulse could result from a mechanism of voltage-dependent inhibition (Jones and Elmslie, 1997). One such mechanism could be Gβγ binding to the open channel with lower affinity than for the closed channel. Measurements ofPo demonstrate that the activity of single N-channels cannot be completely recovered by strong depolarization (Fig. 12).Po measured from all sweeps (including null sweeps) reaches a maximal value of ∼0.5 under control conditions (Fig. 12a; Lee and Elmslie, 1999). As expected, the +70 mV conditioning pulse had no effect on Pomeasured during the postpulse (compared with prepulse; Fig.12a). In the presence of NE, the conditioning pulse facilitates Po measured during the postpulse as expected for voltage-dependent inhibition. However, the conditioning pulse does not recover Poto control levels. At +40 mV, controlPo = 0.62 ± 0.1 (mean ± SD; n = 3) for the prepulse and 0.59 ± 0.08 for the postpulse. In the present of NE,Po was reduced to 0.32 ± 0.16 (n = 3) for postpulse activity and 0.14 ± 0.1 for prepulse activity (Fig. 12b). Thus, the strong conditioning pulse fails to fully recover the gating of inhibited N-channels to the high Po mode.

The conditioning step partially recovers Po of the postpulse sweeps in NE exposed patches. Po was measured as the sum of open times divided by the sweep duration (including the latency to channel opening). The mean Po was averaged from all sweeps (including nulls) at the indicated voltage to provide an estimate of mean N-channel activity during macroscopic recordings. The Po from prepulse sweeps are indicated asopen symbols, whereas those from postpulse sweeps are indicated as solid symbols. Separate symbols are used for data from each control patch and each NE patch. Data are plotted from three control patches (except n = 4 at +30 mV and n = 2 at +10 mV) and four NE patches (exceptn = 3 at +40 mV). The dashed linesare Boltzmann fits to the prepulse data, and solid linesare Boltzmann fits to the postpulse data. The fits to control data were unconstrained (see Materials and Methods). However, the fit to the postpulse data in NE was constrained so that the slope was 6, and the fit to the prepulse data was constrained so that the maximumPo was equal to that of the postpulse (see Materials and Methods). The parameters for the fits in control wereV1/2 = 33.7 and 32.5 mV, slope 6.0 and 5.6 mV/e-fold, Po max = 0.84 and 0.74 for prepulse and postpulse data, respectively. The parameters for the fits in NE were V1/2 = 44.3 and 28.4 mV, slope 10.9 and 6 mV/e-fold, Po max = 0.37 and 0.37 for prepulse and postpulse data, respectively.
Does postpulse inhibition result from voltage-dependent mechanisms or can N-channels switch between voltage-dependent and voltage-independent inhibition? At least some of the postpulse inhibition can be explained by a voltage-dependent mechanism. The cumulative first latency distribution from three single N-channel patches shows longer delays to opening during the postpulse in the presence of NE as compared with that during postpulse or prepulse under control conditions (Fig.13a). Single-channel sweeps show that the channel generally opens into a highPo mode after the delay (Fig. 9). However, in some sweeps brief reluctant events can be observed during the delay to high Po gating (Figs. 9,13b).

NE can delay channel opening during the postpulse. A, Cumulative histograms of the latency to first channel opening are shown for prepulse (dashed line) and postpulse (solid lines) sweeps. NE is placed between the postpulse and prepulse histograms from the patch exposed to NE. To illustrate the effect of NE on the distributions, the histograms have been normalized to the number of sweeps in last bin. The data for the histogram were combined from three control patches and three NE patches. The number of sweeps used was 212 and 207 (control) and 173 and 223 (NE) for prepulse and postpulse, respectively.B, Example sweeps from the same NE-exposed patch shown in A. The vertical dashed line shows the beginning of the postpulse. Note the delayed channel opening in these postpulse sweeps.
DISCUSSION
We have compared the gating of N-channels inhibited by NE with those in control patches. At voltages more than or equal to +40 mV a new gating state is observed that exhibits a lowerPo (<0.2), brief open times (0.6 msec at +40 mV and 1 msec at +50 mV) and long shut times (17 msec at +40 mV and 12 msec at +50 mV) compared to the normal gating mode (highPo). We have labeled these events reluctant openings because they match the properties predicted by the willing–reluctant model of voltage-dependent inhibition. The occurrence of reluctant events is highly correlated with inhibition, because their frequency is reduced after conditioning pulses used to reverse inhibition and they are rarely observed in N-channels from control patches (1.5% of active sweeps). In addition, we find that inhibition induces a delay to channel opening at all voltages tested, which agrees with previous reports (Carabelli et al., 1996; Patil et al., 1996). However, these previous investigations failed to observe reluctant openings in inhibited N-channel gating. When we examine gating at voltages (less than +40 mV) similar to those previously used (+20 mV, Carabelli et al., 1996; +30 mV, Patil et al., 1996), we also do not observe changes in open or shut times. Thus, it is likely that reluctant events were missed in these investigations because of the voltage used to examine N-channel gating. Indeed, the Yue lab has presented preliminary data that they can observe reluctant events at +45 mV (Colecraft et al., 1999).
Previous studies have examined single calcium channel gating in frog sympathetic neurons under control conditions and in the presence of NE (Lipscombe et al., 1989; Delcour et al., 1993; Delcour and Tsien, 1993). Although these channels were thought to be N-type, it is now clear that they were misidentified. The misidentified channel matches an ω-conotoxin GVIA-insensitive channel that we have called “novel” (Elmslie et al., 1994) or, more recently, Ef-channel (Elmslie, 1997).
The intracellular pathway mediating voltage-dependent inhibition appears to involve direct interaction between Gβγ and the N-channel (Herlitze et al., 1996; Ikeda, 1996; De Waard et al., 1997; Zamponi et al., 1997; Delmas et al., 1998; Stephens et al., 1998) (but see,Diversé-Pierluissi et al., 1995, 1997). The voltage dependence appears to result from the transient disruption of Gβγ-N-channel coupling, because the kinetics of reinhibition after strong depolarization become faster with higher concentrations of active G-proteins (Golard and Siegelbaum, 1993; Elmslie and Jones, 1994;Ehrlich and Elmslie, 1995; Zamponi and Snutch, 1998). Boland and Bean (1993) interpreted the willing–reluctant model in terms of G-protein binding and unbinding, with reluctant gating corresponding to the G-protein-bound channel and G-protein unbinding leading to the willing state. Figure 14 interprets the gating we observe in terms of the willing–reluctant model. At the onset of depolarization, the channel is in the G-protein-bound state, where it is reluctant to open. If the depolarization is sufficiently strong (more than or equal to +40 mV), the reluctant channel can open to the RO state where it dwells only briefly. With time, at this voltage the Gβγ subunit unbinds from the channel, and the N-channel gates in the willing mode (the RC–RO–WO pathway). In our recordings we have termed willing gating the high Po mode to distinguish it from a low Po gating mode we observed in N-channels recorded under control conditions. For depolarizations less than +40 mV, the RC–RO equilibrium favors RC, so reluctant openings are rare, and the dominant pathway is RC–WC–WO. The RC–WC transition results in the observed longer latencies to first opening for inhibited channels.

Interpretation of single-channel gating using the willing–reluctant model. The model is shown to theright. WC and WO represent willing closed and open states, and RC and RO represent reluctant closed and open states, respectively. The curly bracket shows the region of the single-channel records where we believe the channel to be gating reluctantly. The square bracket shows the region of the records where the channel is gating in the highPo mode (willing). The three sweeps are nonconsecutive, and this patch contained two N-channels.
In sympathetic neurons, the depolarizing conditioning pulse does not completely recover inhibited current to control levels. This has been interpreted as either evidence for an additional voltage-independent pathway of inhibition (Hille, 1994) or as mechanism of voltage-dependent inhibition (Jones and Elmslie, 1997). Recently,Delmas et al. (1999) presented evidence supporting a “relatively” voltage-independent inhibition mediated by Gi-associated βγ subunits. Their data supports the involvement of both voltage-dependent and voltage-independent pathways in the incomplete reversal of inhibition (Delmas et al., 1999). Our data supports the idea that voltage-dependent inhibition can explain at least part of this incomplete recovery of inhibited current. We find that in the presence of NE the latency to first opening is not fully recovered to control levels by the conditioning depolarization. These postpulse sweeps with delayed channel opening could result from rebinding of Gβγ during the 10 msec interval between the conditioning step and postpulse. In frog sympathetic neurons the half time to reinhibition was found to be ∼50 msec for large inhibitions (Elmslie and Jones, 1994). So given the relatively slow kinetics, it is unlikely that rebinding can explain all of the observed postpulse inhibition. Another possibility is that strong depolarization does not always disrupt the coupling between Gβγ and the N-channel. This could be explained if the open channel could still bind Gβγ subunit with lower affinity than the closed channel. Thus, another mechanism of postpulse inhibition could be that some N-channels remain G-protein-bound despite strong depolarization. Our observation of multiple transitions between RC and RO implies that Gβγ can remain bound to the open N-channel.
We found that some N-channels did not appear to be modulated by the NE included in the patch pipette. This observation has also been made in cell-attached patches containing hundreds of channels (macropatches;Elmslie et al., 1994). One likely explanation is that these N-channels were not coupled to adrenergic receptors. Whole-cell recordings have shown that the application of two neurotransmitters can have a partially additive effect, as if some N-channels were coupled to one receptor, whereas others were coupled to the other receptor, and the remaining N-channels were coupled to both receptors (Elmslie, 1992).Carabelli et al. (1996) included both an adrenergic and an opiate receptor agonist in their patch pipette to increase the frequency of observing inhibition of single N-channels.
One consistent observation from whole-cell recordings is that the voltage-dependent pathway generally inhibits only a portion of the N-current (rarely >60%). This could result from all N-channels not being coupled to all receptors as discussed above, but even coapplication of several neurotransmitters fails to completely inhibit N-current. The simplest explanation is that the Gβγ does not reach saturating concentrations (even for the closed channel). However, our single-channel data show that in the constant presence of NE, the N-channel will switch between inhibited and normal gating. The distribution of first latencies from N-channels inhibited by NE has two components. The slow component results from inhibition-induced delayed channel opening, but the other matches that of control N-channel gating. These two components mirror the activation of inhibited N-current observed during whole-cell recordings (thousands of channels). Although NE is constantly present, the N-channel can open with normal delays into high Po gating mode. Thus, some of the incomplete inhibition of N-current results from single N-channels being inhibited only part of the time.
Physiological significance of reluctant openings
Our data show that the threshold for opening of reluctant channels is approximately +40 mV, which may not appear to be physiologically relevant because the peak of the action potential barely reaches +40 mV under physiological conditions (2 mmCa2+; Adams et al., 1986). However, our single-channel recordings used 100 mmBa2+ to maximize the single-channel current amplitude. This concentration of Ba2+ has been shown to shift N-channel gating ∼40 mV depolarized compared to an external solution containing 2 mm Ba2+ (Elmslie et al., 1994). Based on this observation, we estimate that +40 mV in 100 mm Ba2+ is equivalent to ∼0 mV in physiological Ca2+. Thus, reluctant events have an activation voltage that could be easily reached during an action potential. In addition, voltages depolarized to 0 mV are predicted to increase the Po of reluctant openings and decrease the latency of N-channels opening within the reluctant mode (Elmslie et al., 1990; Boland and Bean, 1993;Jones and Elmslie, 1997). Thus, a reluctant channel could be opened during an action potential.
Neurotransmitters have been shown to reduce neurotransmitter release by inhibiting N-type calcium current (Lipscombe et al., 1989; Yawo and Chuhma, 1993; Koh and Hille, 1997). Under control conditions N-channels gating in the high Po mode provide the Ca2+ influx needed to trigger vesicle release. During inhibition, our recordings show that N-channels will switch between inhibited and normal gating (Fig. 9). In addition, inhibited channels may open reluctantly during the action potential. The resulting Ca2+ influx would be reduced, but not to zero, so repetitive activity could trigger release through summation of the reduced Ca2+influx generated by each action potential. In addition, it has been shown that trains of action potentials can recover inhibited N-channels (Brody et al., 1997; Williams et al., 1997; Park and Dunlap, 1998;Tosetti et al., 1999), although this has not been a universal finding (Penington et al., 1991; Toth and Miller, 1995). This ability of N-channels to provide some Ca2+ influx even during maximal inhibition may ensure that the synapse is never completely shut down.
Footnotes
This work was supported by grants from National Institutes of Health (NS33671) and the Louisiana Education Quality Support Fund (LEQSF-RD-A-28). We thank Drs. Stephen Jones, Yong Sook Goo, Geoffrey G. Schofield, and Ms. Haoya Liang for helpful suggestions throughout this work.
Correspondence should be addressed to Keith S. Elmslie, Department of Physiology, Tulane University Medical School, 1430 Tulane Avenue, New Orleans, LA 70112. E-mail: kelmslie{at}mailhost.tcs.tulane.edu.


