

Article Figures & Data
Figures
- Fig. 1.
Terminals dialyzed with ATP but not ATP-γ-S exhibit fast compensatory endocytosis. A, The time-resolved capacitance record of an isolated synaptic terminal dialyzed with standard internal solution (2 mm ATP). In response to a 500 msec depolarization from aVh of −60 to 0 mV, the membrane capacitance (Cm) increased by ∼186 fF. The time course of restoration of the membrane capacitance back to baseline could be described by a single exponential with a time constant of ∼2.96 sec. The corresponding membrane conductance (Gm) and series conductance (Gs) are shown in the bottom panels. Lack of correlated changes betweenCm and Gs orGm suggest that changes inCm reflect changes in membrane surface area.B, The time-resolved capacitance record of an isolated synaptic terminal dialyzed with internal solution in which 2 mm ATP was replaced by 2 mm ATP-γ-S. In response to a 500 msec depolarization from aVh of −60 to 0 mV, the membrane capacitance increased by ∼55 fF. Note the slow time course of membrane retrieval.Gm and Gs are shown in the bottom panels. Again, there are no correlated changes in Cm andGm or Gs. For both A and B, timing of the depolarization is given by the arrow. Terminals are from the same trituration.
- Fig. 2.
ATP-γ-S does not support rapid endocytosis, even when differences in internal Ca2+ are minimized.A, B, Top panels, The capacitance records from isolated synaptic terminals dialyzed with Ca2+–EGTA-buffered internal solutions containing either ATP (A) or ATP-γ-S (B). Exocytosis was evoked by a 500 msec depolarization from −60 to 0 mV. Fast endocytosis followed exocytosis with ATP but not ATP-γ-S. Timing of the depolarizations are indicated by the arrows. Bottom panels, The corresponding Ca2+ records, ratiometrically calculated from changes in fura-2 fluorescence.
- Fig. 3.
The ATP requirement for endocytosis is independent of intraterminal Ca2+. A, Exocytosis followed by endocytosis was evoked by a 500 msec depolarization from −60 to 0 mV. The mean endocytosis time constant is shown for terminals dialyzed with Ca2+–EGTA-buffered internal solutions containing either ATP (n = 8; black bar) or ATP-γ-S (n = 6; gray bar). Four terminals dialyzed with ATP-γ-S-containing internal solution failed to endocytose in the >40 sec after exocytosis and are not included in this figure. B, There are no statistical differences in the mean Ca2+parameters between terminals with ATP versus ATP-γ-S when Ca2+-buffered internal solutions are used. Same group of terminals as in A. Data are expressed as mean ± SEM.
- Fig. 4.
GTP-γ-S does not block endocytosis, but it does decrease the amplitude of exocytosis. A, Capacitance record from the synaptic terminal of a bipolar neuron that was dialyzed with internal solution containing 3.2 mm GTP-γ-S and 2 mm Mg2+. Two 2 sec depolarizations from −60 to 0 mV were given at the times indicated by thearrows to evoke exocytosis. Note the reproducibility of the response. The time constant of endocytosis was ∼4 sec.B, Pooled data showing the average time constant of endocytosis from five cells (9 responses) dialyzed with GTP-γ-S compared with ATP terminals (2 or 10 mm;n = 8). In GTP-γ-S cells, free Mg2+ was either 2 mm(n = 3) or 10 mm (n= 2). Voltage steps were from −60 to 0 mV and were 0.25–1 sec in duration. Data expressed as mean ± SEM. C, The amplitude of the capacitance response to a 500 msec depolarization was diminished in terminals with GTP-γ-S (n = 5;light gray bar) relative to terminals with Ca–EGTA-buffered internal solutions containing either ATP (n = 13; black bar) or ATP-γ-S (n = 15; dark gray bar) or literature estimates (dotted line) of the average size of the release-ready pool of synaptic vesicles in bipolar neuron synaptic terminals (Heidelberger, 2001). Increasing the duration of Ca2+ influx to 2 sec increased the amplitude of the capacitance response in GTP-γ-S terminals (n = 6 terminals, 12 responses).
- Fig. 5.
GDP-β-S does not inhibit endocytosis.A, Capacitance record from an isolated synaptic terminal that was dialyzed with an internal solution containing GDP-β-S in place of GTP. Exocytosis was evoked by a 500 msec depolarization from −60 to 0 mV. Timing of depolarization is indicated by thearrow. The time constant of membrane recovery was 3.5 sec. B, Pooled data show that GDP-β-S terminals (n = 4; gray bar) endocytosed with a nearly identical time course as ATP terminals (2 or 10 mm;n = 8; black bar) after 500 msec depolarizations (GDP-β-S) or 0.250–1 sec depolarizations (ATP).
- Fig. 6.
The time course of Ca2+recovery predicts the time course of endocytosis. A,B, Top panels show the capacitance records from synaptic terminals of bipolar neurons dialyzed with internal solution containing 10 mm ATP and stimulated to exocytose with either a 500 msec (A) or 1 sec (B) depolarization from −60 to 0 mV.Bottom panels, The ratiometrically calculated intraterminal Ca2+ determined with fura-2.Insets show the corresponding Ca2+current. The thickness of the trace that precedes and follows the inward current carried by Ca2+ is attributable to the superimposed sine wave stimulus used to monitor membrane capacitance. Curves in the top panels are the time course of membrane recovery predicted from the recovery time course of intraterminal Ca2+. Curves were drawn according to the following:Cm(t) =a + be−αt, where α(t) = 0.54(1 − 1/(1 + (0.460/[Ca2+])4)), from von Gersdorff and Matthews (1994b). C, Black bars show the mean rate of endocytosis experimentally observed in terminals with 10 mm ATP after depolarizations of the indicated durations from −60 to 0 mV. Gray bars show the rate of endocytosis predicted from the recovery time course of intraterminal Ca2+. For mild to moderate duration depolarizations, the time course of endocytosis matched the time course of endocytosis predicted by the time course of recovery of intraterminal Ca2+ in terminals with 10 ATP. However, after a 2 sec depolarization, there was a statistically significant difference between the measured and the predicted rates of endocytosis (p < 0.005). After a 5 sec depolarization, the measured and predicted rates were also significantly different (p < 0.07). For ≤500 msec,n = 4 responses, 2 terminals. For 1 sec,n = 2 responses, 1 terminal. For 2 sec,n = 4 responses, 3 terminals. For 5 sec,n = 5 responses, 3 terminals. Data are expressed as mean ± SEM.
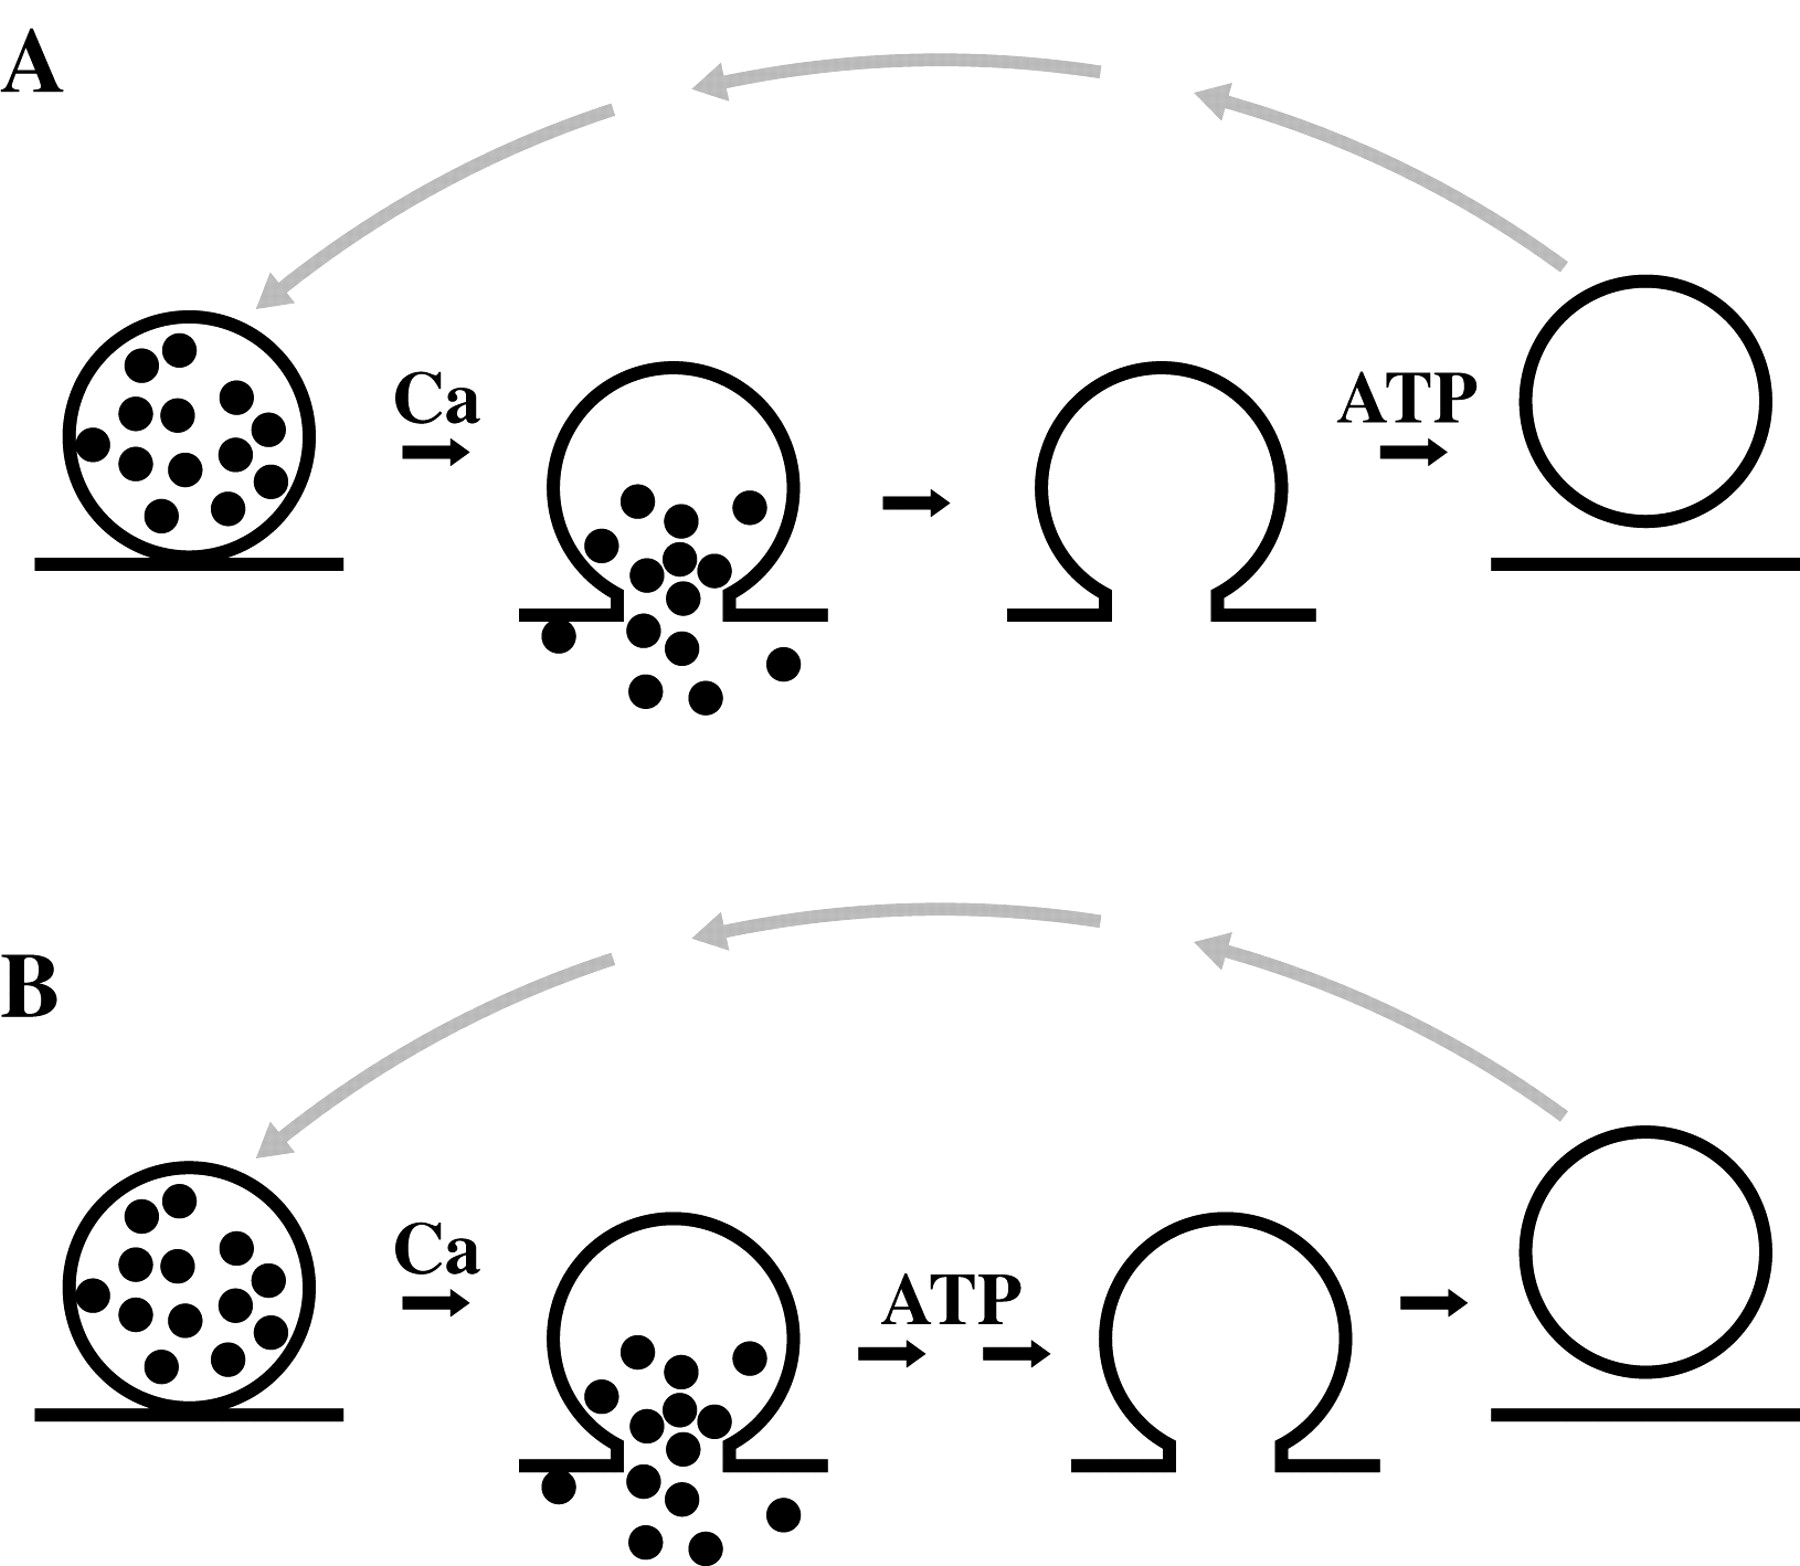
- Fig. 7.
Possible locations of an early requirement for ATP in the fast compensatory endocytosis pathway in synaptic terminals.A, ATP may be required for the membrane fission step of the fast compensatory pathway, perhaps by acting as an energy source.B, ATP may be required for a postfusion step that is prerequisite for membrane retrieval via the fast compensatory pathway but not be needed for fission. This ATP-dependent step might reflect the disassembly and sorting of SNARE complexes. In addition, the possibility that ATP may both play a prefission role and act at the fission step is not excluded.


