

Article Figures & Data
Figures
- Fig. 1.
Simulating the effect of d-AA on NMDAR EPSCs. A, A kinetic model of the NMDAR (Clements et al., 1992; Lester and Jahr, 1992), incorporating the binding and unbinding of d-AA. Rates (m−1sec−1 or sec−1):ka of 5 × 10⁶;k-a of 5; kb of 7 × 10⁶; k-b of 210; α of 91.6; β of 46.5; kd of 8.4; and k-d of 1.8. B, Model prediction of receptor response to an exponentially decaying glutamate concentration transient ([Glu]peak of 1 mm; τdecay of 1 msec; top panel) in “control” conditions (thin black line) and in 70 μmd-AA (thick black line). The d-AA trace is also scaled (thick gray line) to the same amplitude as control. C, As inB, except the glutamate transient is 2 μm, 300 msec. D, Contour plot of the blockade ofd-AA of the simulated EPSC amplitude. [Glu]peak values were 0.001, 0.003, 0.01, 0.03,0.1, 0.3, 1, 3, and 10 mm; τdecay values were 0.1, 0.3, 1, 3, 10, 30, 100, 300, and 1000 msec. All combinations were simulated, resulting in a 9 × 9 array that was used to create the contour map in Igor Pro. E, As in B, except for [Glu]peak of 1 μm and τdecayof 100 msec. F, As in B, but with the glutamate transients from B and Ecombined to drive the simulation. G, As inB, except that the responses from B andE were added in a 1:6 ratio to simulate a multisynapse EPSC.
- Fig. 2.
d-AA speeds the decay of the NMDAR EPSC. A, NMDAR EPSCs (Vh of +50 mV) recorded under control conditions (i,iii, v) and in the presence of 1 μmd-CPP (ii) or 70 μmd-AA (iv).Traces represent averages of 20 consecutive responses. Response vi recorded at Vh of +10 mV. B, NMDAR EPSC amplitudes over the course of the experiment in A. C, EPSCsii, iii, and iv fromA, scaled to the same amplitude. D, Half-decay times of NMDAR EPSCs recorded in control solution, in the presence of 70 μmd-AA, or in the presence of 1 μmd-CPP. n = 8.
- Fig. 3.
d-AA does not affect release probability, glutamate transport, or NMDAR kinetics. A, AMPAR EPSCs (Vh of −70 mV; no AMPAR or NMDAR antagonists present). Control trace (top panel) reflects average of 25 EPSCs before application of d-AA. Traces in control and d-AA are overlaid in the right panel for comparison.B, STCs recorded from astrocytes (Vh of −95 mV; AMPAR and NMDAR antagonists present). Responses in control solution (left panel) and in d-AA (middle panel) are overlaid for comparison (right panel). C, NMDAR currents elicited in an outside-out excised patch by a brief application of 1 mml-glutamate. Top panel shows “open-tip” current, obtained at the end of the experiment after patch rupture to check the speed of solution exchange across the patch pipette.Vh of +60 mV.
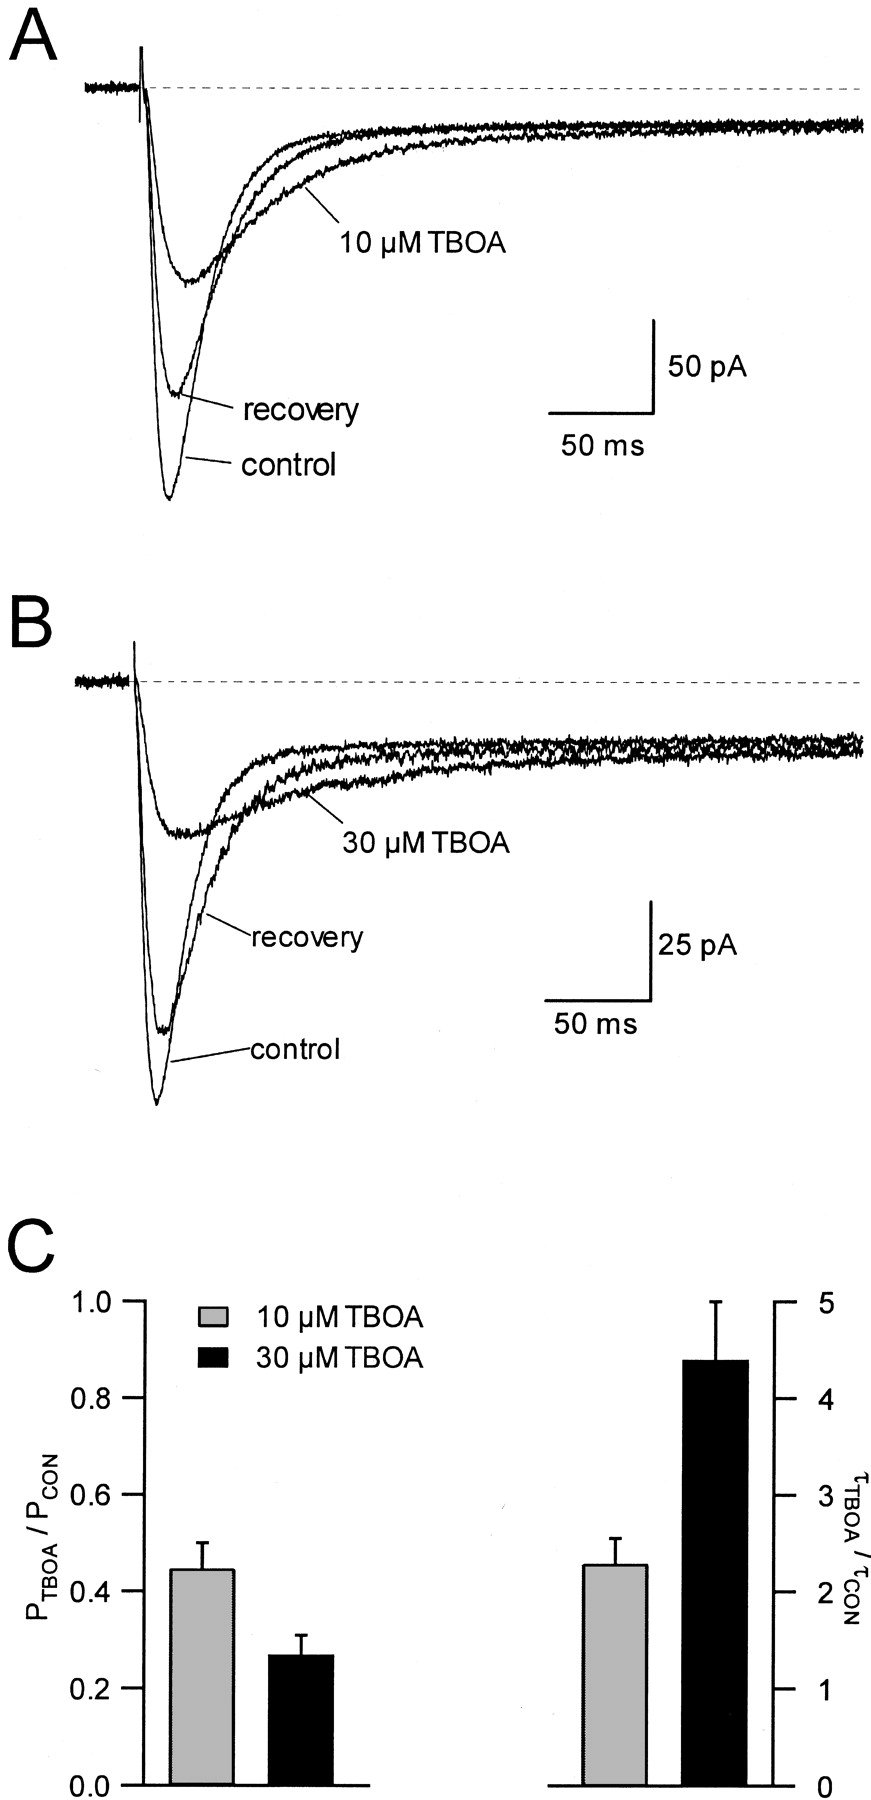
- Fig. 4.
Effects of TBOA on astrocyte STCs.A, TBOA at 10 μm reversibly reduced the amplitude and slowed the decay of the STC. B, Effects of 30 μm TBOA on the STC (different astrocyte than inA). C, Effects of 10 μm(n = 4) and 30 μm(n = 4) TBOA on STC amplitude (PTBOA/PCON) and exponential decay (τTBOA/τCON). Amplitudes were calculated by subtracting the peak from the amplitude of the slowly-decaying potassium current (Bergles and Jahr, 1997) measured 400–450 msec after stimulation.
- Fig. 5.
TBOA preferentially enhances a slow component of the NMDAR EPSC. A, NMDAR EPSCs (Vh of +50 mV) recorded in control conditions and in the presence of 70 μmd-AA.B, EPSCs recorded in control conditions and in the presence of 30 μm TBOA. Recovery response obtained at the end of the experiment (see D). C, EPSCs recorded in the presence of 30 μm TBOA alone and in the additional presence of 70 μmd-AA. Calibration in C also applies to A andB. D, NMDAR EPSC amplitude throughout the entire experiment in which all illustrated responses were obtained.E, Control and d-AA responses fromA, scaled to the same amplitude for comparison of decay.F, TBOA and TBOA plus d-AA responses fromC, scaled. G, Effect of d-AA on NMDAR EPSC decay under different conditions. TBOA at 10 μm (n = 6) and 30 μm(n = 4) was applied in different experiments. Control values were not different in the two data sets (p = 0.63), so the control bar reflects the pooled results (n = 10).
- Fig. 6.
d-AA speeds the NMDAR EPSC decay at 34°C. A, NMDAR EPSCs recorded in control conditions and in the presence of 70 μmd-AA or 1 μmd-CPP. Traces have been scaled to the same amplitude for comparison of decay. Vh of +50 mV. B, Effects in a group of experiments ofd-AA (n = 6) and d-CPP (n = 4).
- Fig. 7.
Effects of d-AA on NMDAR EPSCs elicited by a range of stimulus intensities. A, NMDAR EPSCs (Vh of +50 mV) were elicited by 75 (triangles), 150 (circles), and 225 (squares) μA stimulation. Stimuli were interleaved throughout experiment. B, Effects of changing stimulus intensity on EPSC amplitude (black bars) and half-decay time (gray bars). Data pooled from six experiments. C, Effects of d-AA on EPSC amplitude at different stimulus intensities. D, Effects of d-AA on EPSC half-decay time at different stimulus intensities. Data in C and D were taken from same six cells as B. Data from individual cells are superimposed on bar graphs in C andD.
- Fig. 8.
d-AA speeds NMDAR EPSC decay only when postsynaptic transport is inhibited. A, NMDAR EPSCs were recorded at −60 or +60 mV (as indicated in top panel), and the effects of d-AA andd-CPP were compared at both potentials. B, EPSCs from the experiment shown in A, recorded in control conditions and in the presence of 70 μmd-AA. Responses in antagonist have been duplicated and scaled (dashed lines) to control response for comparison of decay time course. Inset, Comparison of control EPSCs recorded at negative (i) and positive (ii) potentials. C, as inB, except recordings are in control and in the presence of 1 μmd-CPP. D, Effects of 70 μmd-AA and 1 μmd-CPP at Vh of −70 mV with NMDG in the patch pipette. No synaptic current was observed whenVh was +60 mV. Responses at −70 mV were scaled to the control response for comparison of decay time course. Control EPSC amplitude was 240 pA. E, Effects ofd-AA on NMDAR EPSC half-decay time at negative and positive potentials with Cs+ in the recording pipette and at negative potentials with NMDG in the pipette. Experiments were performed at 22°C (black bars) or 34°C (gray bars). Numbers in eachbar indicate number of cells tested.
- Fig. 9.
Monte Carlo simulation of indirect, direct, and extrasynaptic NMDAR activation. A diffusion model (see Materials and Methods) was designed to simulate the effects of neuronal transporters in different scenarios. A, Indirect activation. Glutamate diffused into the synaptic cleft from a distant release site. NMDARs (white ovals) were located in the center of the postsynaptic density, and glutamate transporters (black circles) were located perisynaptically. The number of glutamate molecules released and rate of clearance from simulation were adjusted to yield a homogeneous concentration that peaked at 1 μmand decayed with an exponential time constant of 100 msec. Dense, perisynaptic transporter expression (5000 μm−2, ∼1000 transporters total) reduced the amount of glutamate that reached the NMDARs (second panel) and, consequently, reduced NMDAR activation (third panel). This reduction in [Glu]cleftrequired the uptake of >600 glutamate molecules (fourth panel). Traces reflect averages of 20 simulations.B, Direct activation. Panels are the same as inA, except that a quantum of glutamate (5000 molecules) was released from within the synaptic cleft. Perisynaptic transporters did not affect the glutamate concentration in the cleft or in NMDAR activation. Traces reflect the average of 10 simulations.C, Extrasynaptic activation, as in A andB, except that NMDARs (500 μm−2) and transporters (5000 μm−2) were distributed randomly in the extrasynaptic membrane. Glutamate was released from a distance, as in A. Whole-cell transporter currents (right panel) were scaled to reflect transport into the pyramidal cell during an evoked response if synaptically released glutamate were to reach 10% of the pyramidal cell membrane in stratum radiatum (see Materials and Methods). Traces reflect the average of 10 simulations.


